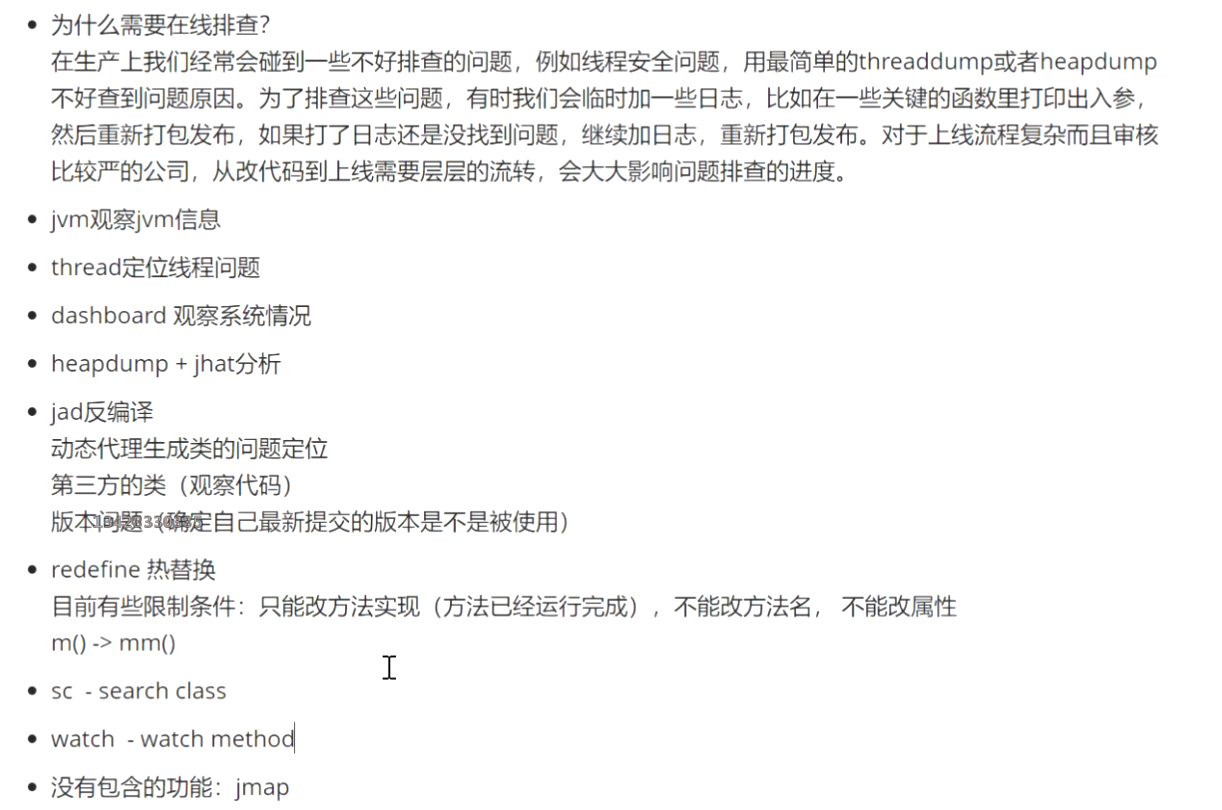
arthas online troubleshooting tool
https://github.com/alibaba/arthas/blob/master/README_CN.md
step
Run our java program

Start the jar file of arthas. We can see that the process number of the java program just running is 1, so type in the process number 1 and press enter. It will hang itself to this process
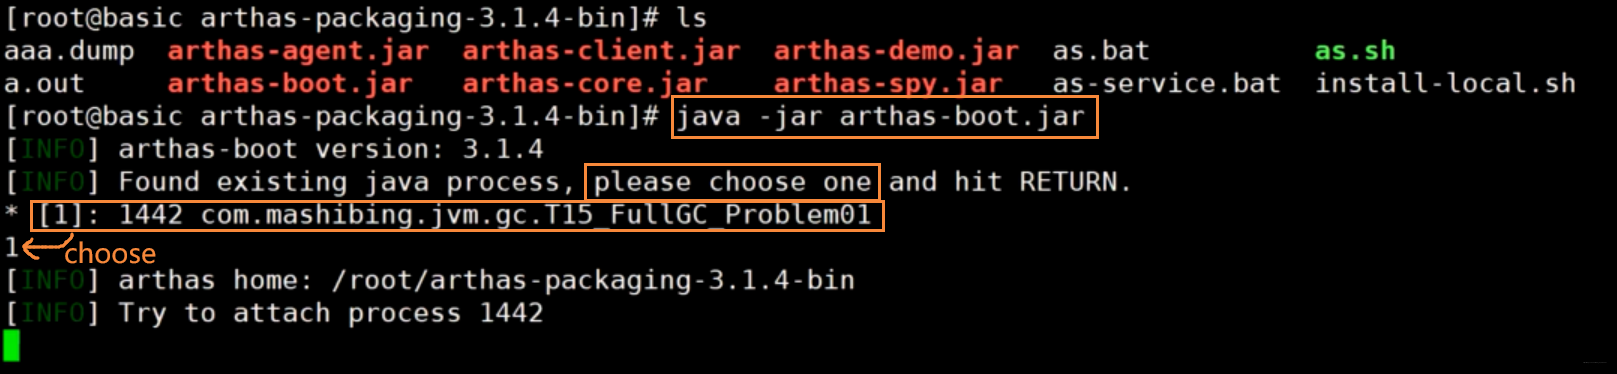
Then you can use some commands provided by arthas to observe your program
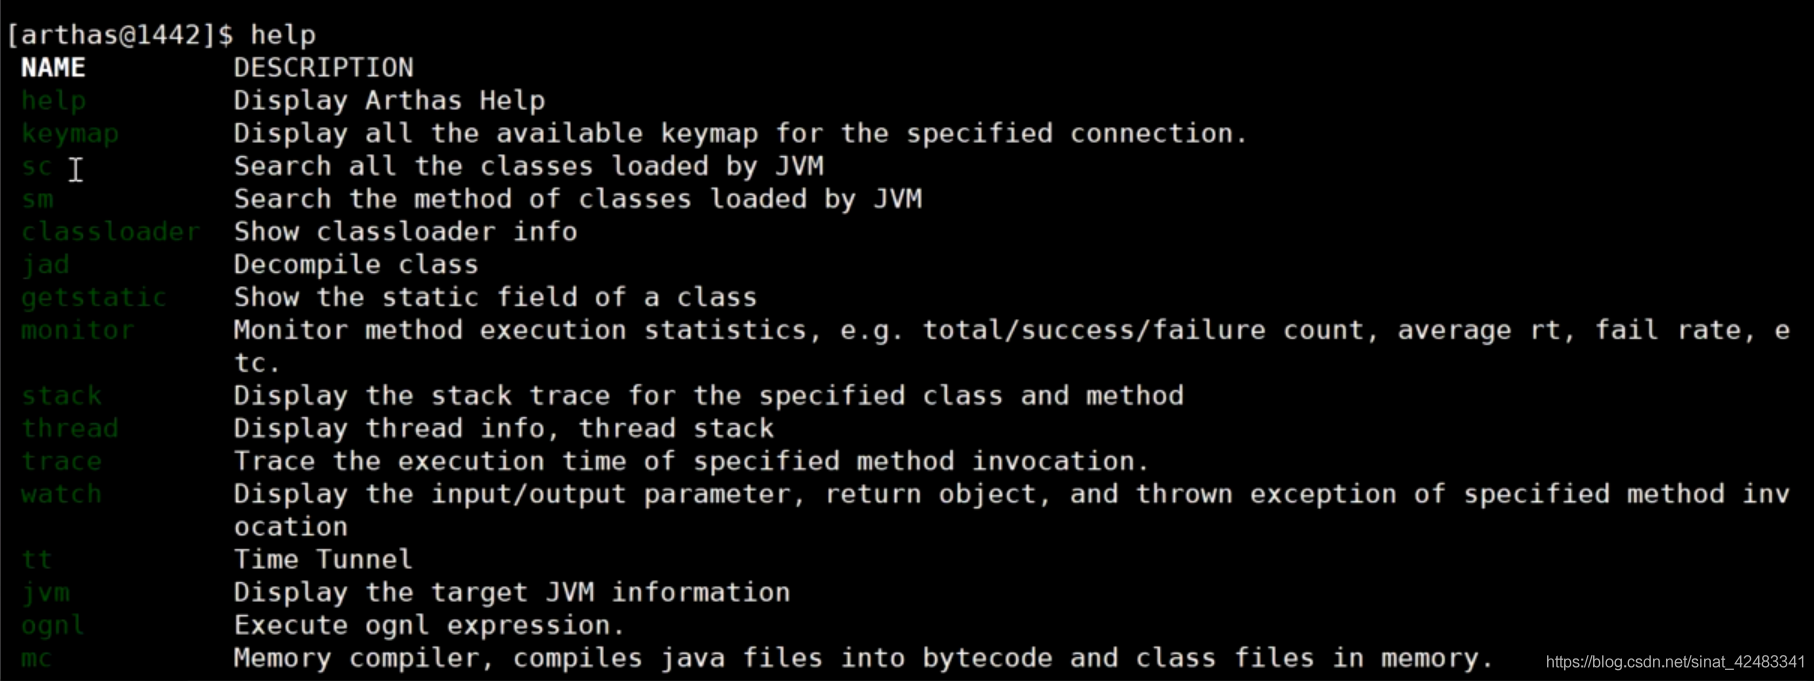
Use help to view the common commands of arthas:
Some common commands include jvm, dashboard, heapdump, etc
With arthas, you can give up most JDK commands~
For example, export a heap file. It has a default path. You can also specify the path yourself. It will have some impact on the online system. Therefore, we can not guide the stack without guiding the stack, and we can locate online if we can locate online.
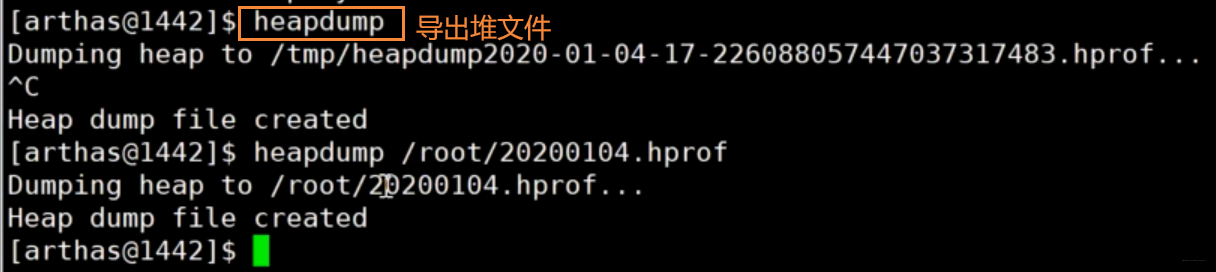
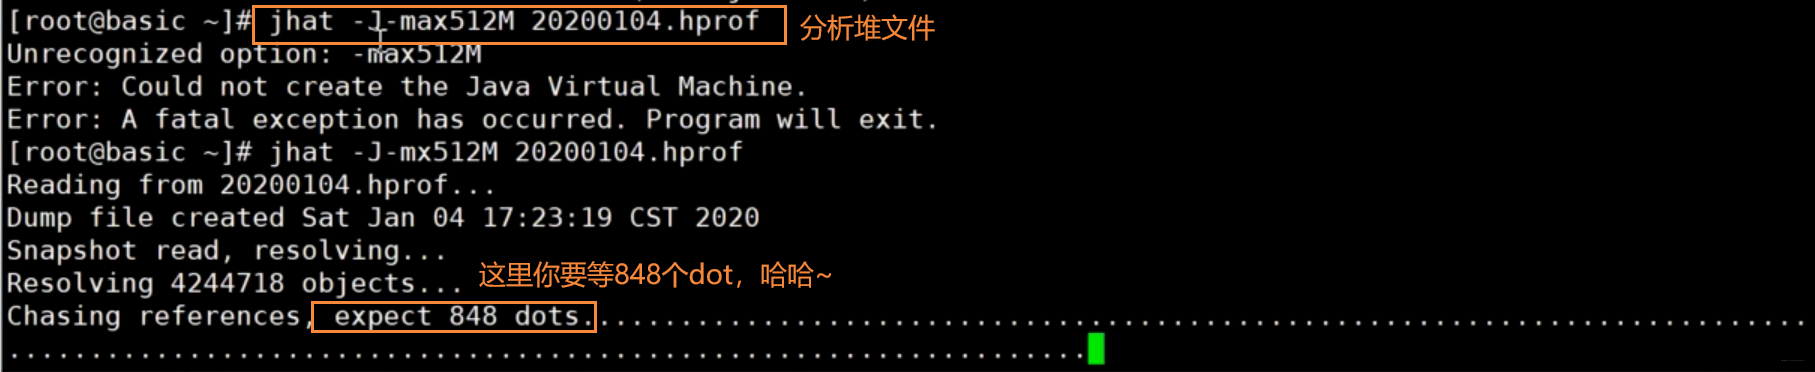
Then let's analyze the exported heap file
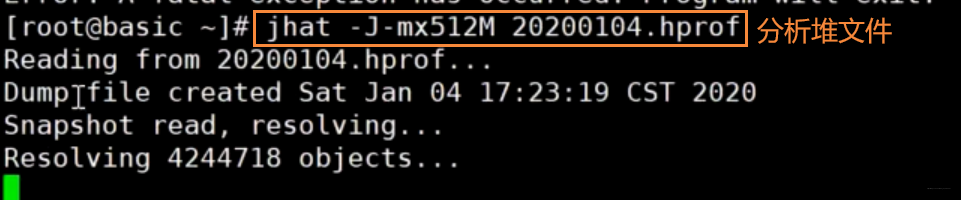
After exporting, it will remind you that you can access it through port 7000
There is a package and other in it. Go to the bottom and click instance. It is equivalent to the jmap interface, which can analyze which class contains the most objects
There is also a powerful function called OQL, which can query the objects in a language similar to SQL. The syntax is still very flexible. You can also use where to filter
For example, select s from Java lang.String s
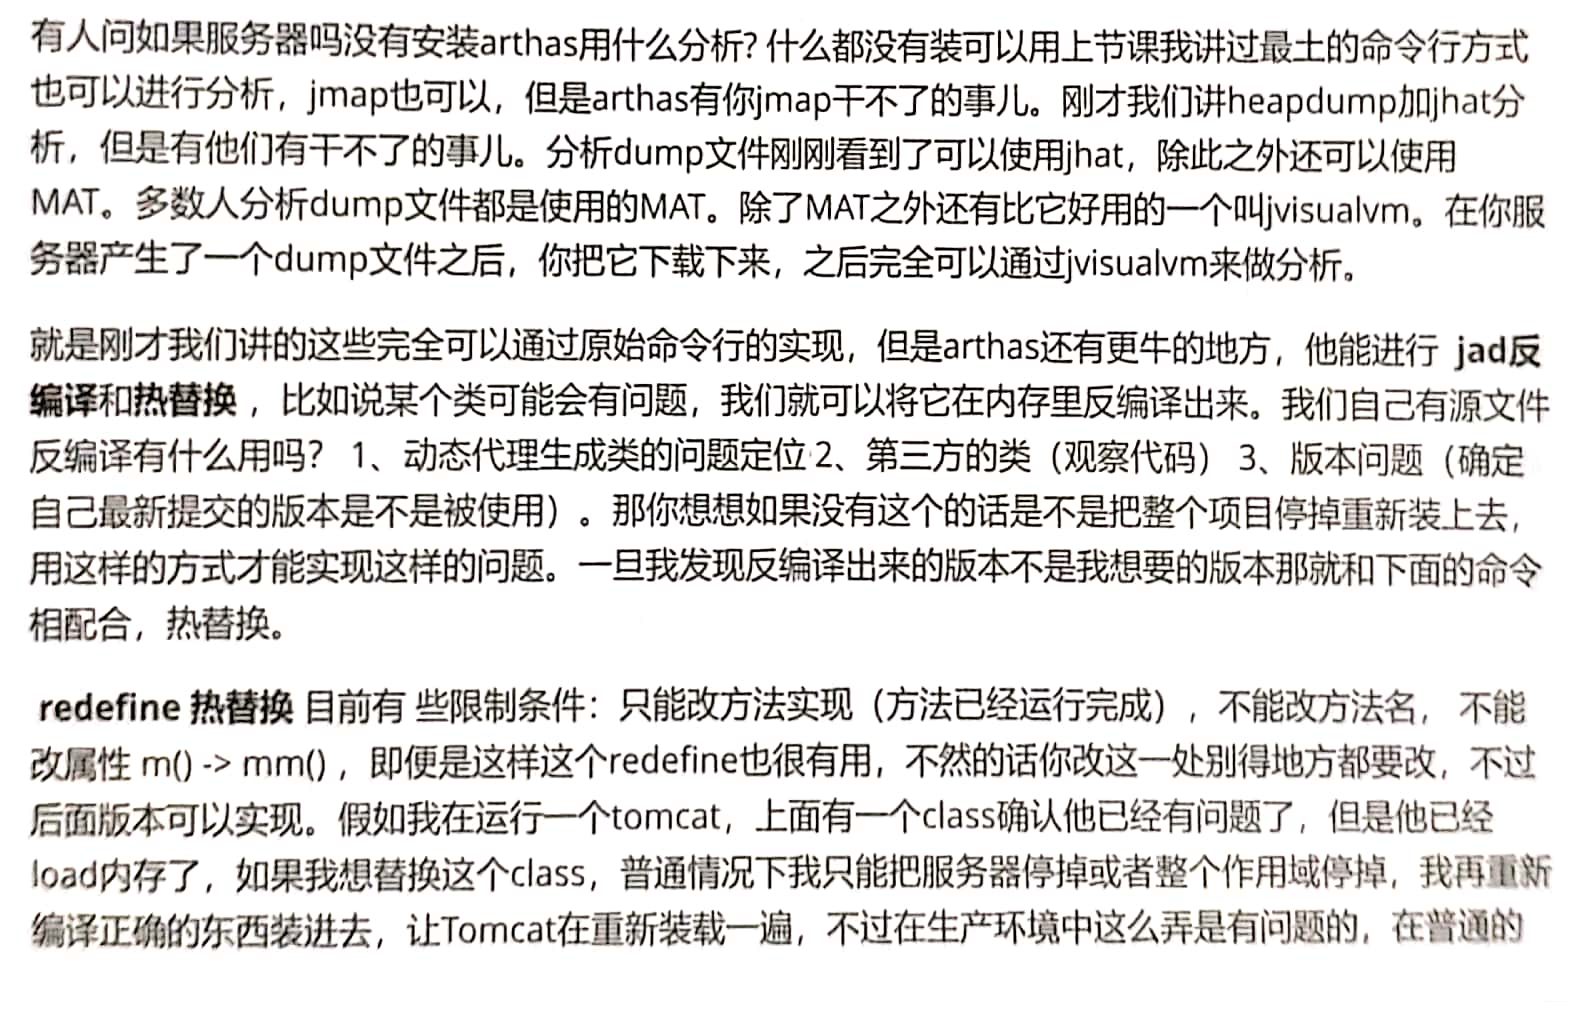
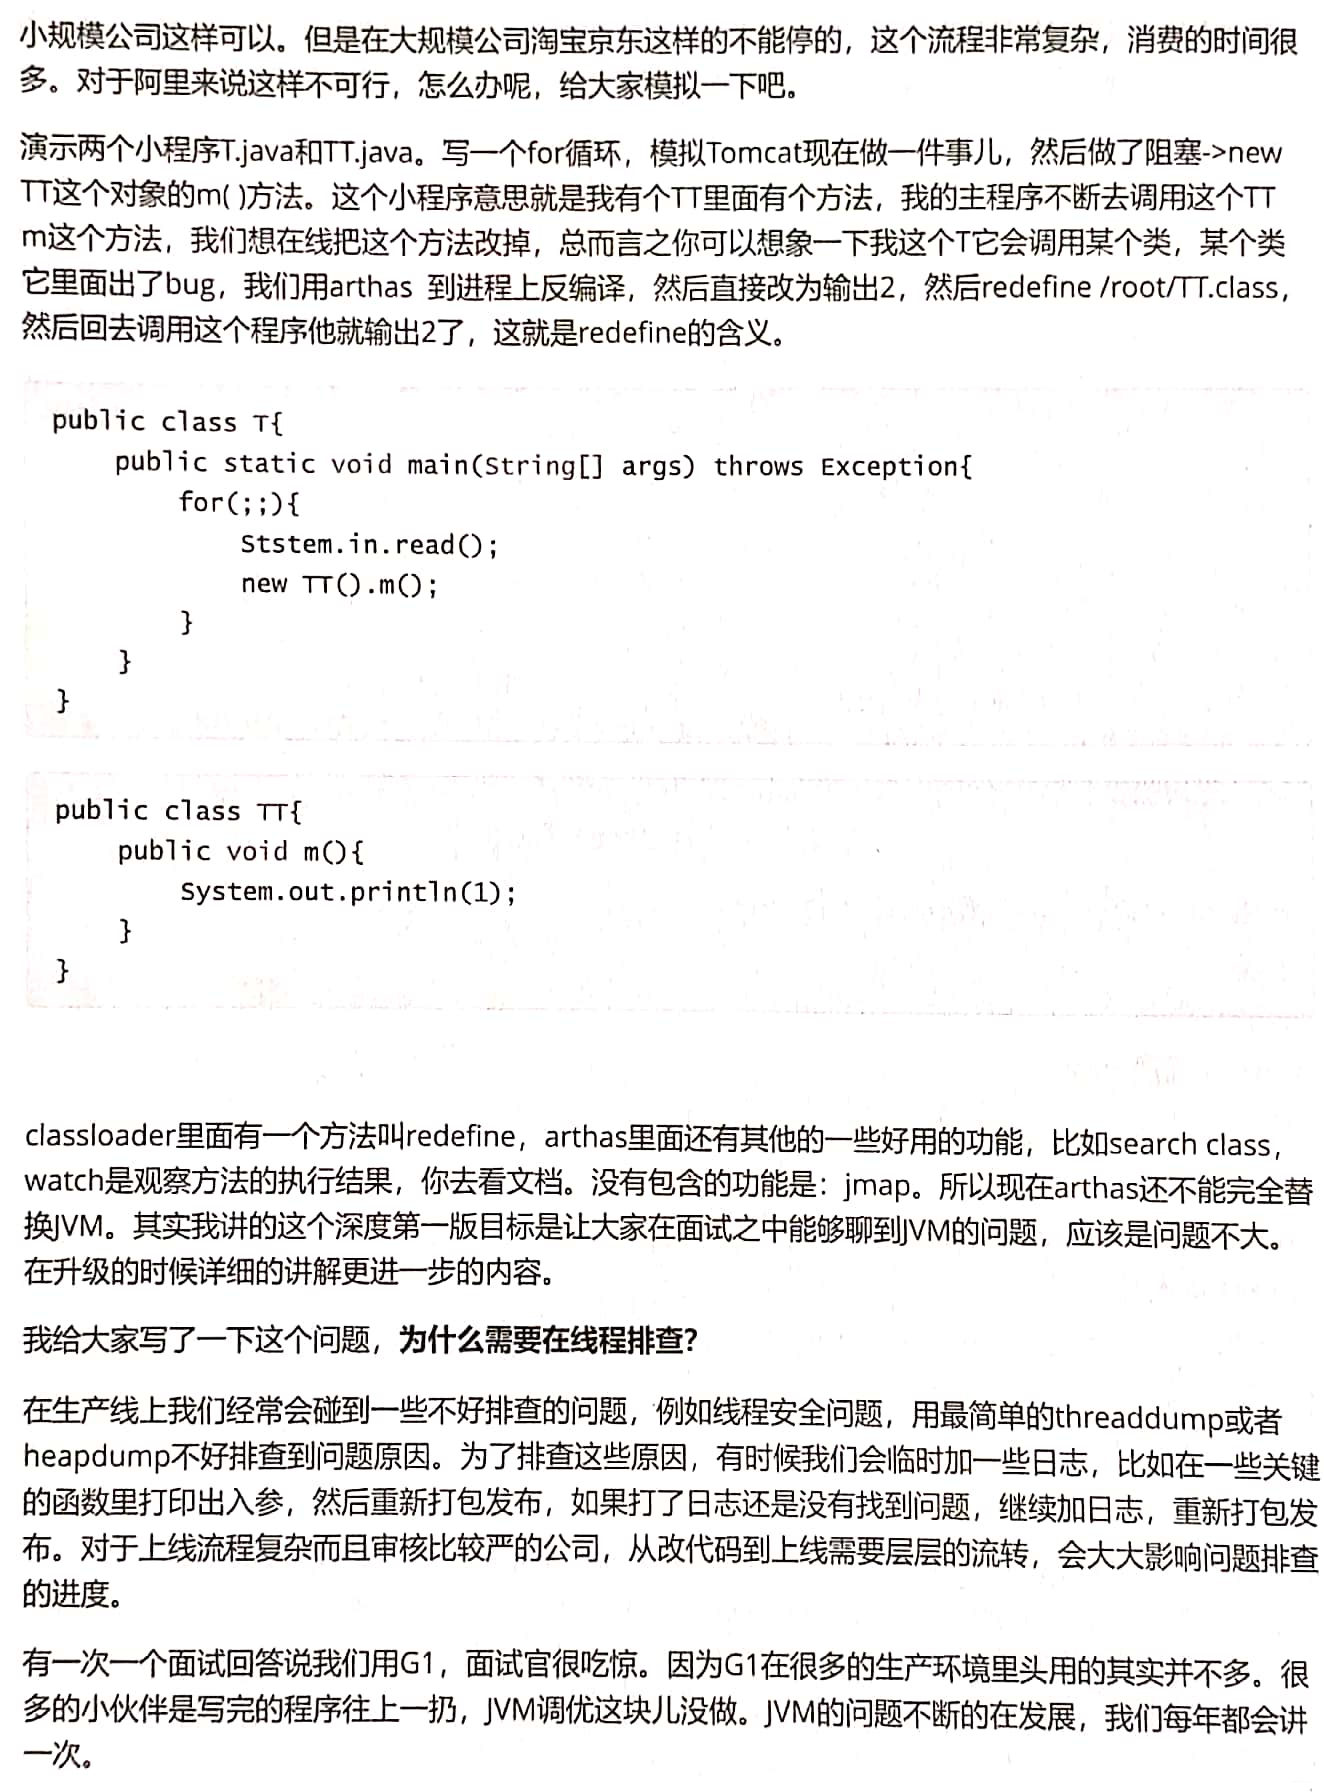
arthas also has a better place called redefine hot replacement
Summary of OOM troubleshooting cases
There are various reasons for OOM generation. Some programs may not generate OOM and keep FGC(CPU soars, but memory recovery is particularly small) (the above case)
-
The hardware upgrade system is the problem of Caton (see above)
-
OOM problem caused by improper use of thread pool (see above)
Keep adding objects to the List (it's too LOW) -
jira problem
The actual system is constantly restarted
Solve the problem and add memory + replace garbage collector G1
What's the real problem? I don't know -
Tomcat HTTP header size is too large (Hector)
-
lambda expression causes method area overflow problem (MethodArea / Perm Metaspace)
LambdaGC.java -XX:MaxMetaspaceSize=9M -XX:+PrintGCDetails
   "C:\Program Files\Java\jdk1.8.0_181\bin\java.exe" -XX:MaxMetaspaceSize=9M -XX:+PrintGCDetails "-javaagent:C:\Program Files\JetBrains\IntelliJ IDEA Community Edition 2019.1\lib\idea_rt.jar=49316:C:\Program Files\JetBrains\IntelliJ IDEA Community Edition 2019.1\bin" -Dfile.encoding=UTF-8 -classpath "C:\Program Files\Java\jdk1.8.0_181\jre\lib\charsets.jar;C:\Program Files\Java\jdk1.8.0_181\jre\lib\deploy.jar;C:\Program Files\Java\jdk1.8.0_181\jre\lib\ext\access-bridge-64.jar;C:\Program Files\Java\jdk1.8.0_181\jre\lib\ext\cldrdata.jar;C:\Program Files\Java\jdk1.8.0_181\jre\lib\ext\dnsns.jar;C:\Program Files\Java\jdk1.8.0_181\jre\lib\ext\jaccess.jar;C:\Program Files\Java\jdk1.8.0_181\jre\lib\ext\jfxrt.jar;C:\Program Files\Java\jdk1.8.0_181\jre\lib\ext\localedata.jar;C:\Program Files\Java\jdk1.8.0_181\jre\lib\ext\nashorn.jar;C:\Program Files\Java\jdk1.8.0_181\jre\lib\ext\sunec.jar;C:\Program Files\Java\jdk1.8.0_181\jre\lib\ext\sunjce_provider.jar;C:\Program Files\Java\jdk1.8.0_181\jre\lib\ext\sunmscapi.jar;C:\Program Files\Java\jdk1.8.0_181\jre\lib\ext\sunpkcs11.jar;C:\Program Files\Java\jdk1.8.0_181\jre\lib\ext\zipfs.jar;C:\Program Files\Java\jdk1.8.0_181\jre\lib\javaws.jar;C:\Program Files\Java\jdk1.8.0_181\jre\lib\jce.jar;C:\Program Files\Java\jdk1.8.0_181\jre\lib\jfr.jar;C:\Program Files\Java\jdk1.8.0_181\jre\lib\jfxswt.jar;C:\Program Files\Java\jdk1.8.0_181\jre\lib\jsse.jar;C:\Program Files\Java\jdk1.8.0_181\jre\lib\management-agent.jar;C:\Program Files\Java\jdk1.8.0_181\jre\lib\plugin.jar;C:\Program Files\Java\jdk1.8.0_181\jre\lib\resources.jar;C:\Program Files\Java\jdk1.8.0_181\jre\lib\rt.jar;C:\work\ijprojects\JVM\out\production\JVM;C:\work\ijprojects\ObjectSize\out\artifacts\ObjectSize_jar\ObjectSize.jar" com.mashibing.jvm.gc.LambdaGC
   [GC (Metadata GC Threshold) [PSYoungGen: 11341K->1880K(38400K)] 11341K->1888K(125952K), 0.0022190 secs] [Times: user=0.00 sys=0.00, real=0.00 secs]
   [Full GC (Metadata GC Threshold) [PSYoungGen: 1880K->0K(38400K)] [ParOldGen: 8K->1777K(35328K)] 1888K->1777K(73728K), [Metaspace: 8164K->8164K(1056768K)], 0.0100681 secs] [Times: user=0.02 sys=0.00, real=0.01 secs]
   [GC (Last ditch collection) [PSYoungGen: 0K->0K(38400K)] 1777K->1777K(73728K), 0.0005698 secs] [Times: user=0.00 sys=0.00, real=0.00 secs]
   [Full GC (Last ditch collection) [PSYoungGen: 0K->0K(38400K)] [ParOldGen: 1777K->1629K(67584K)] 1777K->1629K(105984K), [Metaspace: 8164K->8156K(1056768K)], 0.0124299 secs] [Times: user=0.06 sys=0.00, real=0.01 secs]
   java.lang.reflect.InvocationTargetException
   	at sun.reflect.NativeMethodAccessorImpl.invoke0(Native Method)
   	at sun.reflect.NativeMethodAccessorImpl.invoke(NativeMethodAccessorImpl.java:62)
   	at sun.reflect.DelegatingMethodAccessorImpl.invoke(DelegatingMethodAccessorImpl.java:43)
   	at java.lang.reflect.Method.invoke(Method.java:498)
   	at sun.instrument.InstrumentationImpl.loadClassAndStartAgent(InstrumentationImpl.java:388)
   	at sun.instrument.InstrumentationImpl.loadClassAndCallAgentmain(InstrumentationImpl.java:411)
   Caused by: java.lang.OutOfMemoryError: Compressed class space
   	at sun.misc.Unsafe.defineClass(Native Method)
   	at sun.reflect.ClassDefiner.defineClass(ClassDefiner.java:63)
   	at sun.reflect.MethodAccessorGenerator$1.run(MethodAccessorGenerator.java:399)
   	at sun.reflect.MethodAccessorGenerator$1.run(MethodAccessorGenerator.java:394)
   	at java.security.AccessController.doPrivileged(Native Method)
   	at sun.reflect.MethodAccessorGenerator.generate(MethodAccessorGenerator.java:393)
   	at sun.reflect.MethodAccessorGenerator.generateSerializationConstructor(MethodAccessorGenerator.java:112)
   	at sun.reflect.ReflectionFactory.generateConstructor(ReflectionFactory.java:398)
   	at sun.reflect.ReflectionFactory.newConstructorForSerialization(ReflectionFactory.java:360)
   	at java.io.ObjectStreamClass.getSerializableConstructor(ObjectStreamClass.java:1574)
   	at java.io.ObjectStreamClass.access$1500(ObjectStreamClass.java:79)
   	at java.io.ObjectStreamClass$3.run(ObjectStreamClass.java:519)
   	at java.io.ObjectStreamClass$3.run(ObjectStreamClass.java:494)
   	at java.security.AccessController.doPrivileged(Native Method)
   	at java.io.ObjectStreamClass.<init>(ObjectStreamClass.java:494)
   	at java.io.ObjectStreamClass.lookup(ObjectStreamClass.java:391)
   	at java.io.ObjectOutputStream.writeObject0(ObjectOutputStream.java:1134)
   	at java.io.ObjectOutputStream.defaultWriteFields(ObjectOutputStream.java:1548)
   	at java.io.ObjectOutputStream.writeSerialData(ObjectOutputStream.java:1509)
   	at java.io.ObjectOutputStream.writeOrdinaryObject(ObjectOutputStream.java:1432)
   	at java.io.ObjectOutputStream.writeObject0(ObjectOutputStream.java:1178)
   	at java.io.ObjectOutputStream.writeObject(ObjectOutputStream.java:348)
   	at javax.management.remote.rmi.RMIConnectorServer.encodeJRMPStub(RMIConnectorServer.java:727)
   	at javax.management.remote.rmi.RMIConnectorServer.encodeStub(RMIConnectorServer.java:719)
   	at javax.management.remote.rmi.RMIConnectorServer.encodeStubInAddress(RMIConnectorServer.java:690)
   	at javax.management.remote.rmi.RMIConnectorServer.start(RMIConnectorServer.java:439)
   	at sun.management.jmxremote.ConnectorBootstrap.startLocalConnectorServer(ConnectorBootstrap.java:550)
   	at sun.management.Agent.startLocalManagementAgent(Agent.java:137)
-
Direct memory overflow problem (rare)
In depth understanding of Java virtual machine P59, use Unsafe to allocate direct memory or use NIO -
Stack overflow problem
-Xss setting is too small -
Compare the similarities and differences between the two procedures and analyze which is the better way to write:
Object o = null; for(int i=0; i<100; i++) { o = new Object(); //Business processing //This way of writing is better. Every time you enter the loop, only one reference points to it, and other references that do not point to it may be recycled } for(int i=0; i<100; i++) { Object o = new Object(); // Only when the cycle is over can it be released and recycled } -
Overriding finalize causes frequent GC
Xiaomi cloud, HBase synchronization system, system access timeout alarm through nginx (system CPU is in frequent GC, CPU is soaring), finally troubleshooting, C + + programmer rewrites finalize, causing frequent GC problems
Why do C + + programmers rewrite finalize? (the new object needs to reclaim memory manually. It calls the destructor delete, thinking that finalize is the destructor, so it is rewritten.)
Finalizing takes a long time. Some complex logic is written in it. It takes time (200ms) and can't be recycled -
If there is a system that consumes no more than 10% of heap memory, but observes the GC log and finds that FGC is always generated frequently, what will cause it?
Because someone explicitly called system GC () (this is Low) -
Distuptor has a chain length that can be set. If it is too large and the object is large, it will overflow if it is not released after consumption
-
Using jvm will overflow. mycat has crashed. There is a problem with a temporary version of sql sub query algorithm in 1.6.5. The joint sql of nine exists leads to the generation of millions of objects
-
A large number of new threads will generate native thread OOM, (low) thread pool should be used,
Solution: reduce heap space (too TMlow) and reserve more memory to generate native thread
JVM memory accounts for 50% - 80% of physical memory