jvm runtime data area
Overview
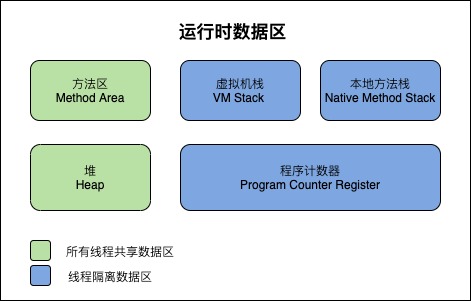
The memory managed by java virtual machine will be divided into several areas when running. These areas have their own purposes, creation and destruction time. Some are created with the start of virtual machine process, and some are created and destroyed with the start and end of user thread. According to the virtual machine specification, the virtual machine memory is divided into the following areas
Program counter
definition
Program computer Register program counter
-
Remember the address of the next instruction
-
In the process of program execution, in case of branch, loop, jump and thread recovery, it is necessary to obtain the address of the next instruction through the counter for execution
-
characteristic
-
Thread private
Each thread has its own independent program counter, because multithreading is realized through thread switching in turn. At the same time, there is always only one thread executing on the cpu or kernel. It is the turn of the next thread to execute half of a thread's execution. It is necessary to save the instruction execution address through the counter, and continue to execute from the address saved by the counter after recovery
-
The memory consumption is very small, and there is no risk of memory overflow
-
case
Here is an example to see how the program counter works
public class PCTest {
    public static void main(String[] args) {
        for (int i = 0; i < 2; i++) {
            if(i == 0){
                System.out.println("hello");
            }else {
                System.out.println("world");
            }
        }
    }
}
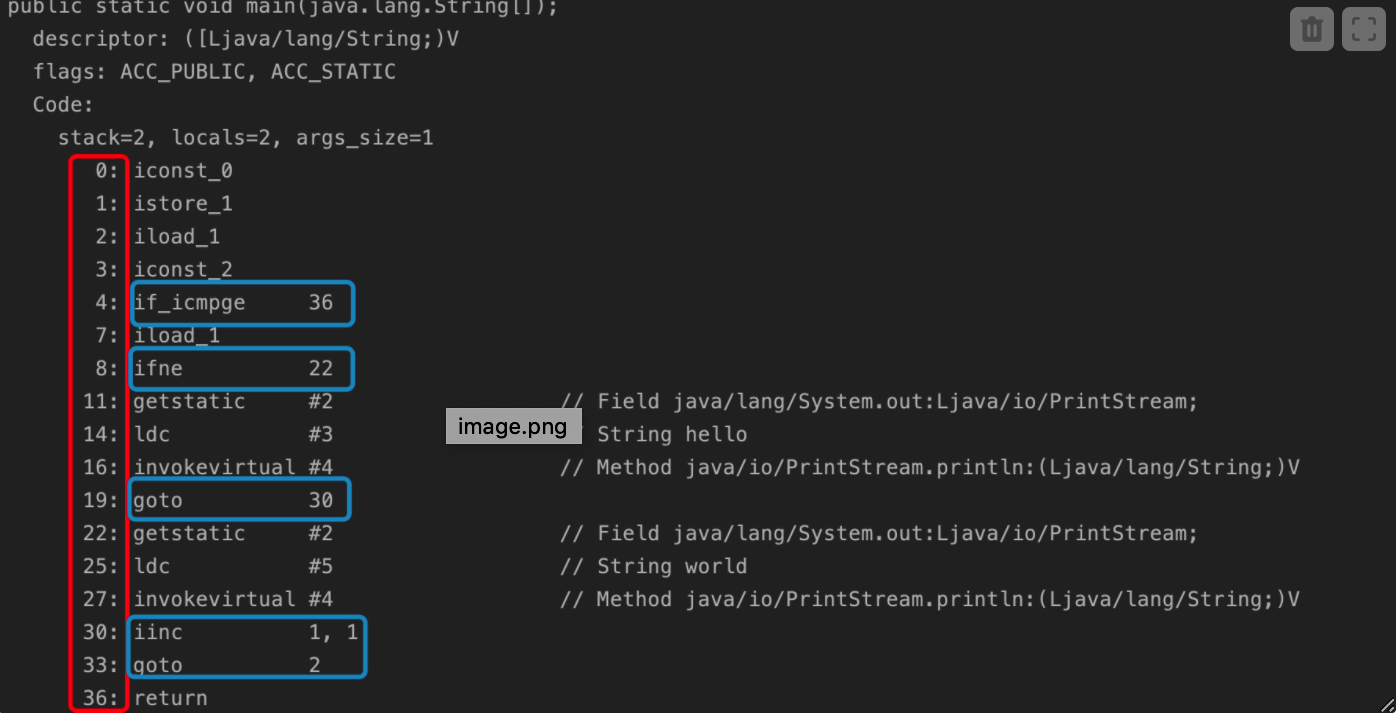
Use javap -v PCTest to decompile and get the following fragments. The red box on the left is the bytecode instruction address, and the blue box indicates that this bytecode instruction will jump to the specified address for execution. The function of PC is to record the address of these instructions.
VM Stack
definition
- The memory space required for each thread to execute is called stack
- When the method is called, a stack frame will be created and put into the stack. After the method is called, its stack frame will be put out of the stack
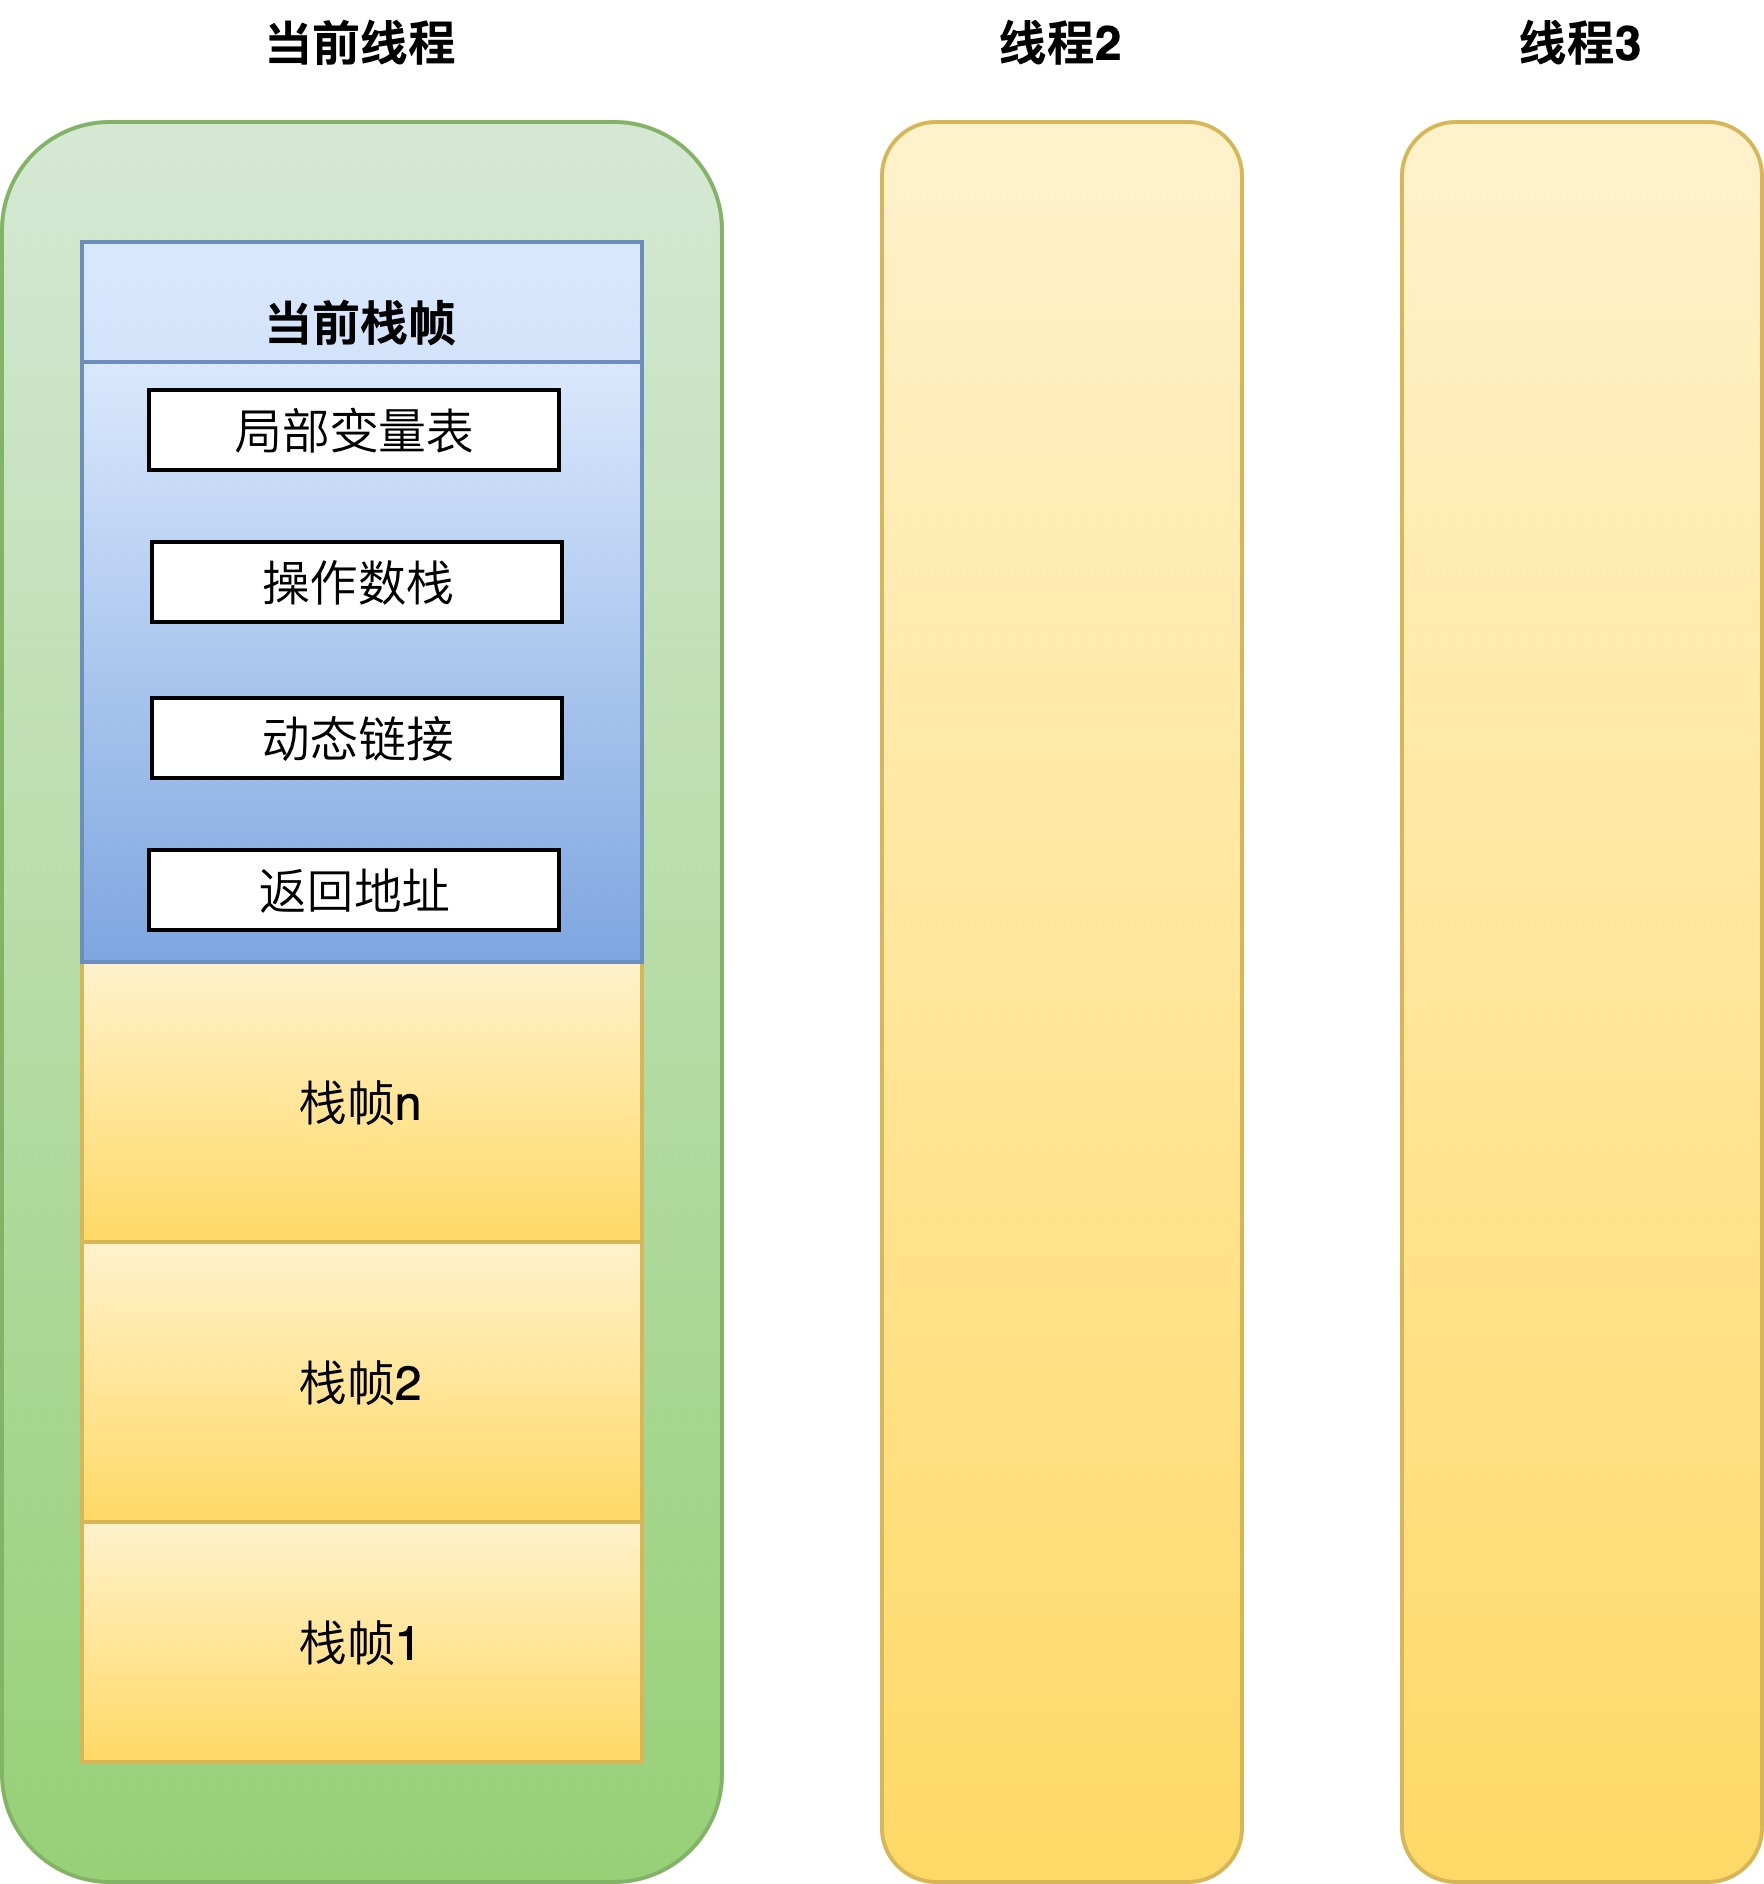
- Stack frame contains local variable table, operand stack, dynamic link, return address and other information
- Each stack has only one active stack frame, that is, the stack frame at the top of the stack, corresponding to the method being executed
Stack frame
Local variable table
The storage space of a set of variable values can be understood as an array. Each position in the array is used to store a local variable, or method parameters and this variable (only instance methods). When compiling as a class file, the maximum length of the local variable table has been determined, and there is max of the code attribute_ Locals is in the additional attribute.
Variable slot
- Each variable slot can store data of type boolean, byte, char, short, int, float, reference or returnAddress
- If it is double or long type data, use two consecutive variable slots
- The reference type has two functions
- You can directly or indirectly find the address of the object in the heap
- You can directly or indirectly query the type information of the data type of the object in the method area
Allocation of variable slots
- If it is an instance method, the first variable slot uses this
- First distribute the parameters to the variable slot, and then assign the variable slot to the local variable
- Variable slot multiplexing
- The scope of variables defined in the method body is not necessarily the whole method. Variables defined outside the scope of a variable can reuse its variable slot
Operand stack
- It's a first in, then out stack
- The maximum depth has been determined after compilation and is stored in max of the code attribute_ Stacks data item
- double and long occupy two stack capacities, and other data types occupy one stack capacity
- Can be used to pass parameters to the calling method
- Can be used for arithmetic operations
dynamic link
-
Each stack frame contains a reference to the address of the type to which the current method belongs in the runtime constant pool, which is used to support the dynamic link of method code.
-
In the class file, a method calls other methods or accesses fields through symbolic references. Dynamic links convert the symbolic references of these methods into direct references of methods, load class information if necessary to resolve unresolved symbolic references, and convert the access of variables into appropriate offsets in the storage structure related to the runtime location of these variables.
Return address
- There are two types of method exit: normal exit and abnormal exit. Normal exit may have a return value, and abnormal exit must not have a return value. However, whether normal or abnormal exit, it must return to the location where the method was originally called
- Normal exit is through the value of the PC counter of the main calling method saved in the stack frame as the return address
- When an exception exits, the return address is determined through the exception handling table
- The process of method exit may be as follows
- Destroy the current stack frame, restore the operand stack and local variable table of the previous stack frame, press the return value of the current stack frame into the operand stack of the caller's stack frame, and adjust the value of the PC counter to the position of the next instruction after the method call
Relationship between thread, stack and stack frame
Stack frame demo
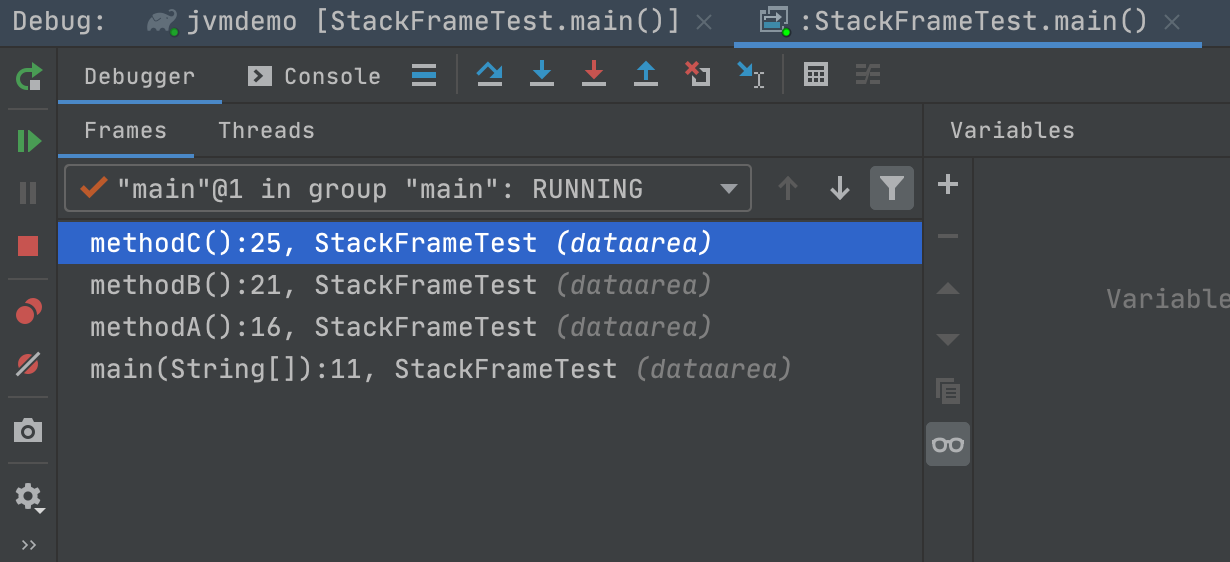
Write the test class with idea, put a breakpoint in the methodC() method, and then start the program in debug mode
public class StackFrameTest {
    public static void main(String[] args) {
        methodA();
    }

    private static void methodA() {
        System.out.println("A");
        methodB();
    }

    private static void methodB() {
        System.out.println("B");
        methodC();
    }

    private static void methodC() {
        System.out.println("C");
    }
}
When the program runs to methodC(), check the console and find that four stack frames appear
Native Method Stack
- Native method stacks are very similar to virtual machine stacks. The difference is that the virtual machine stack serves to call java methods, while the local method stack serves to call local methods for virtual machines
- The local method stack will throw StackOverflowError and OutOfMemoryError exceptions respectively when the stack depth overflows or the stack expansion fails
heap
definition
- The area of memory used to store object instances
characteristic
- It is shared by threads, and the objects in the heap need to consider thread safety
- Manage heap memory through automatic memory reclamation
- The minimum and maximum heap memory are set by - Xms and - Xmx respectively. For example, the maximum heap memory is set to 10m by - Xms10m
Heap memory overflow
The following code can be used to test the overflow of heap memory. Before starting the program, you need to set the virtual machine parameter - Xmx10m and set the maximum heap memory to 10m
package dataarea;

import java.util.ArrayList;
import java.util.List;

/**
 * VM Args -Xmx10m
 * Heap memory overflow problem
 * @author ct
 * @date 2021/10/21
 */
public class HeapOOMTest {
  static class OOMObject{
    byte[] bytes = new byte[1024];
  }
  public static void main(String[] args) {
    List<OOMObject> list = new ArrayList<>();

    try{
      while (true){
        list.add(new OOMObject());
      }
    }catch(Throwable e){
      e.printStackTrace();
    }finally {
      System.out.println(list.size());
    }

  }
}
It can be seen from the running results that the heap memory overflowed, resulting in an OOM exception
8641
  Exception in thread "main" java.lang.OutOfMemoryError: Java heap space
    at java.lang.Throwable.printStackTrace(Throwable.java:649)
    at java.lang.Throwable.printStackTrace(Throwable.java:643)
    at java.lang.Throwable.printStackTrace(Throwable.java:634)
    at dataarea.HeapOOMTest.main(HeapOOMTest.java:24)
Method area
definition
- The method area is an area shared by all threads
- It is mainly used to store class related information, such as runtime constant pool, field, method data, method or constructor code
- The method area is created when the virtual machine starts
- Although the method area is logically a part of the heap, the implementation of the virtual machine can choose not to garbage collect or clean up.
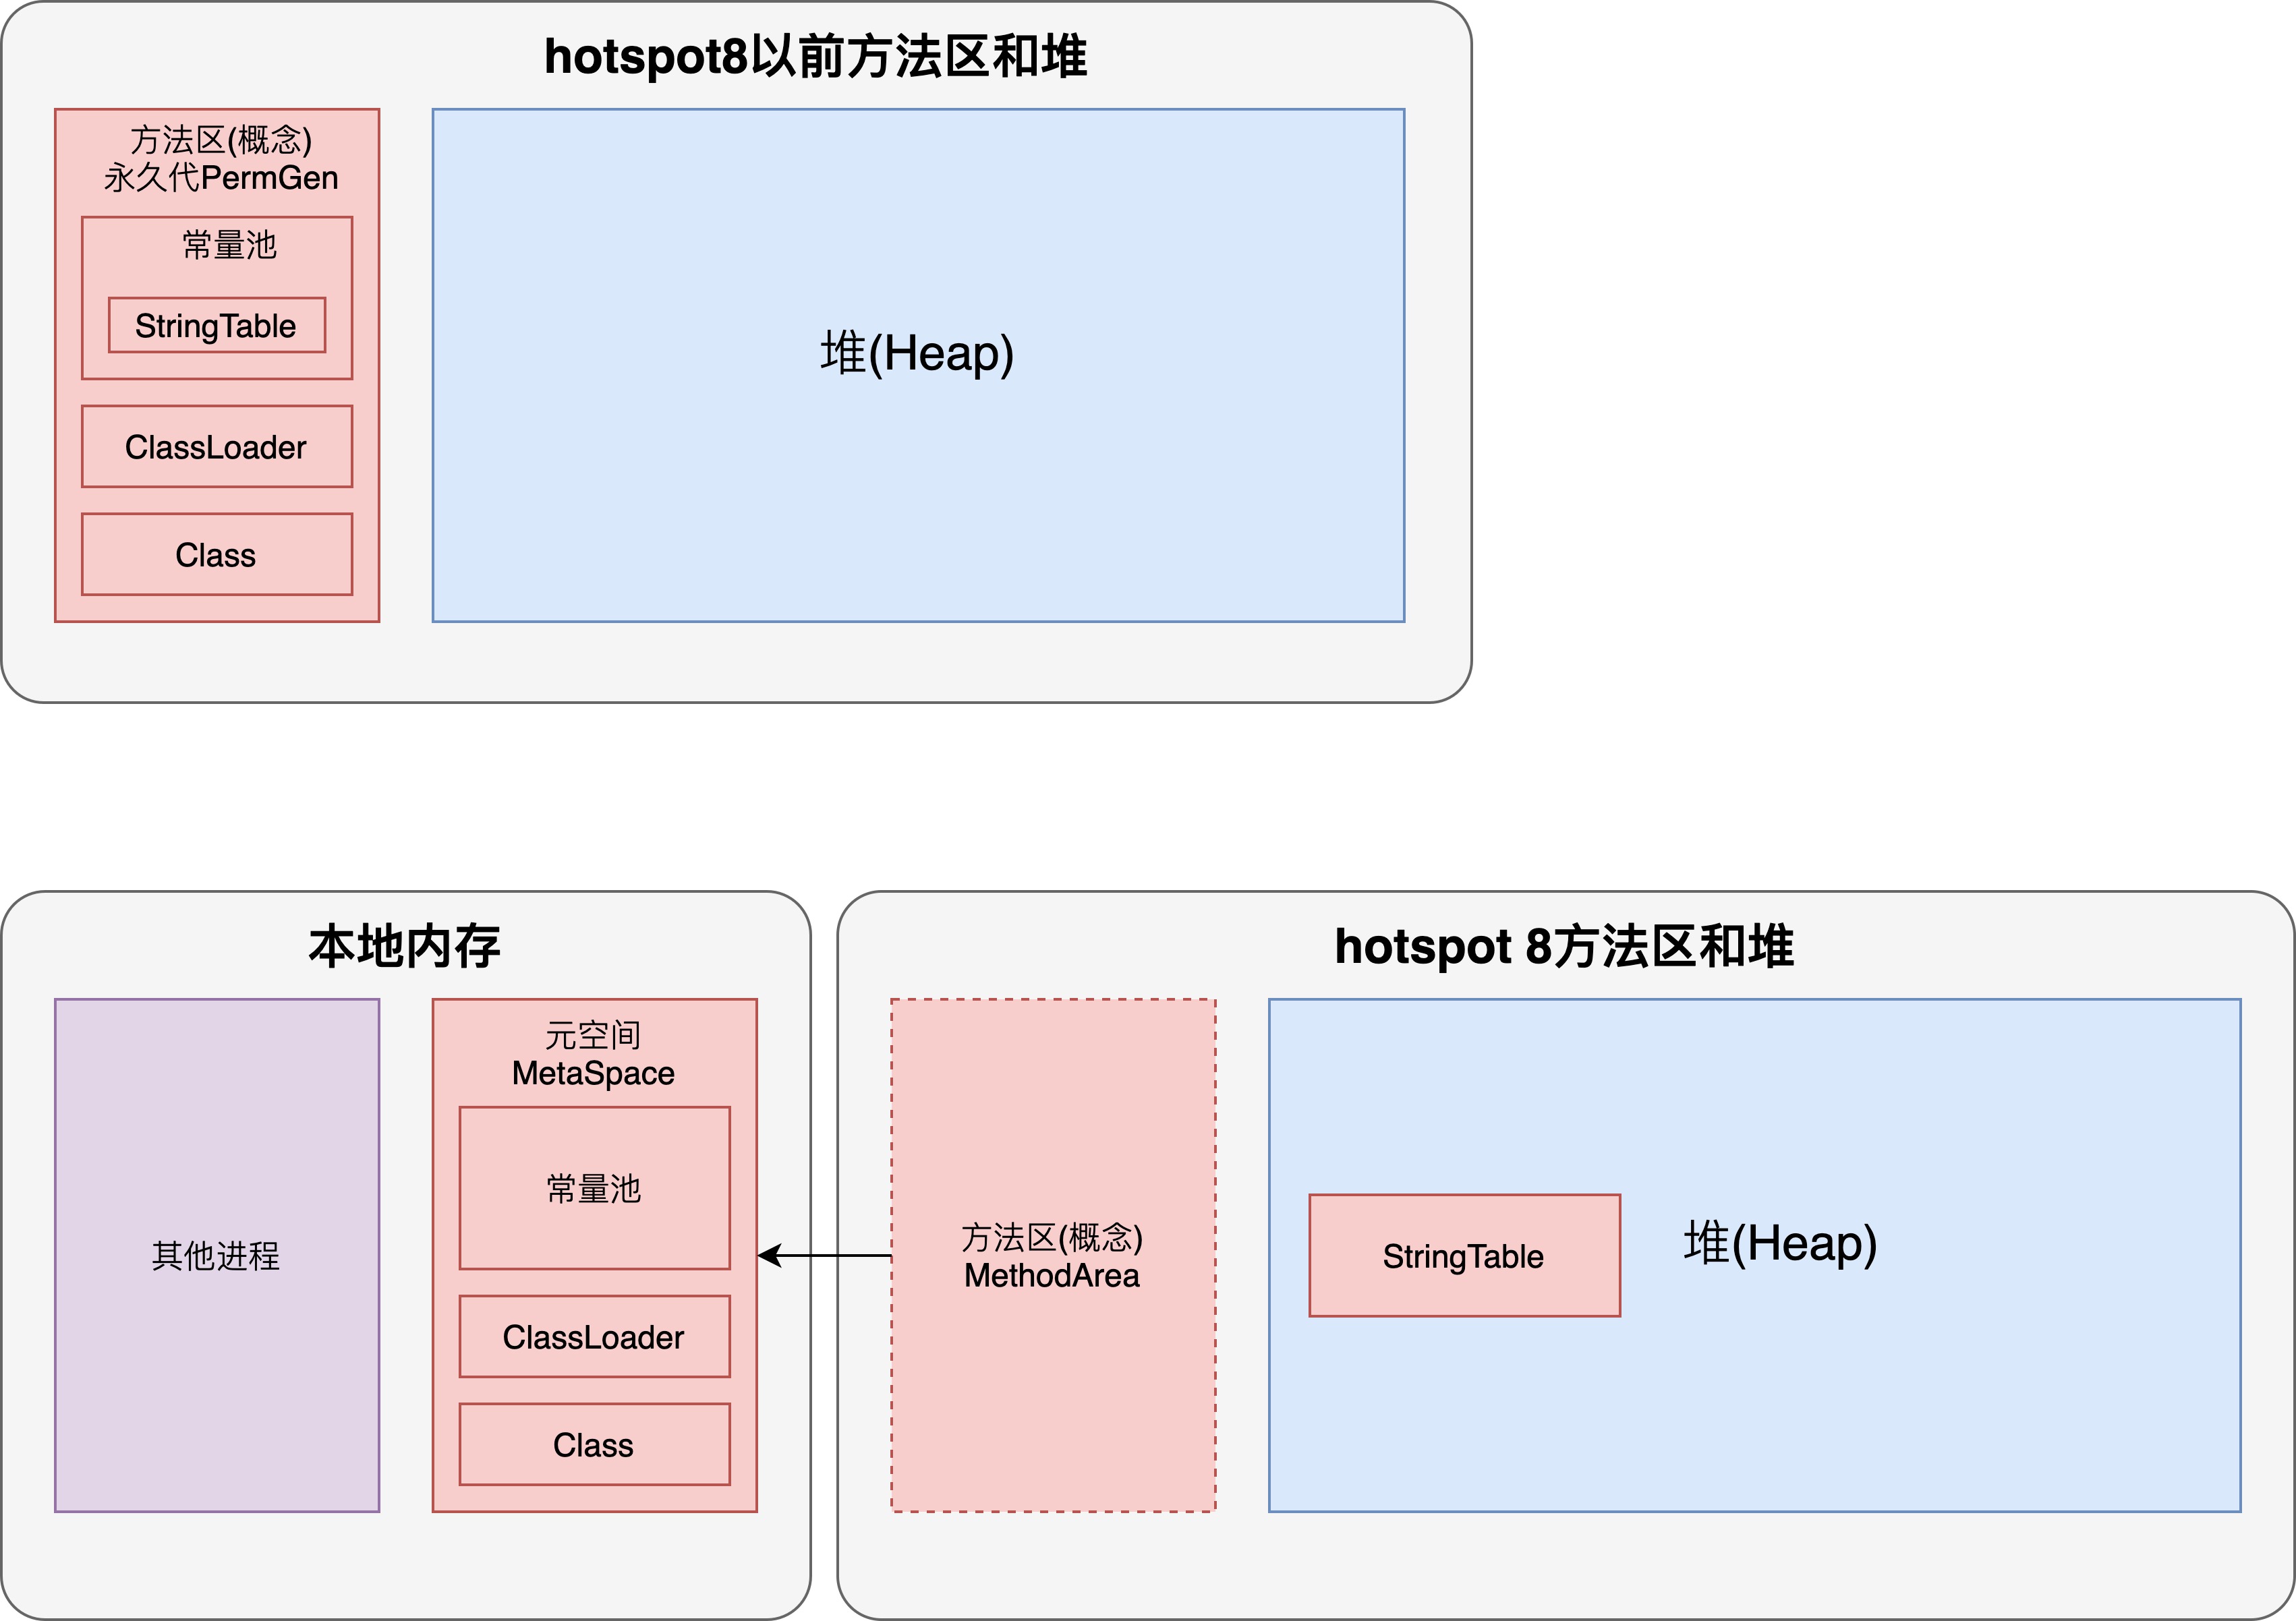
- The method area is the specification, and the permanent generation or meta space is its implementation, hotspot1 8 used to be the permanent generation, and the meta space used after 1.8
- The permanent generation is in heap memory, and the meta space is in local memory
Comparison of hotspot8 and previous methods
out of memory
jdk1.8 test the memory overflow of meta space. Create a large number of classes through dynamic proxy technology, and set the meta space size to 10m:-XX:MaxMetaspaceSize=10m
package com.company;

import jdk.internal.org.objectweb.asm.ClassWriter;
import jdk.internal.org.objectweb.asm.Opcodes;

/**
 * Create memory overflow of meta space through
 * VM args -XX:MaxMetaspaceSize=10m
 *
 * @author ct
 * @date 2021/10/22
 */
public class MethodAreaOOMTest1 extends ClassLoader{
  public static void main(String[] args) {
    MethodAreaOOMTest1 test = new MethodAreaOOMTest1();
    ClassWriter cw = new ClassWriter(0);
    for (int i = 0; i < 10000; i++) {
      //jdk version, modifier, class name, package name, parent class
      cw.visit(Opcodes.V1_8,Opcodes.ACC_PUBLIC,"Class"+i, null, "java/lang/Object", null);
      byte[] code = cw.toByteArray();
      test.defineClass("Class"+i,code,0,code.length);
    }
  }
}
The results are as follows
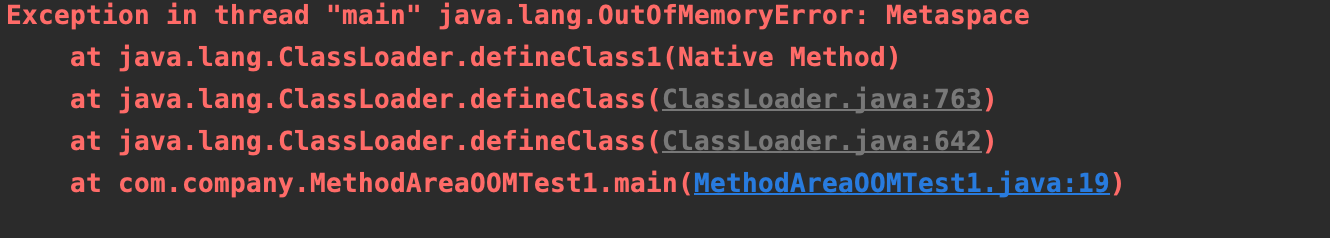 {:height 107, :width 554}
Runtime Constant Pool
- The constant pool is the literal and symbol reference information in the compiled bytecode file. When a class is loaded by the jvm, the data in the constant pool will be loaded into the memory of the method area and become the runtime constant pool
- Direct references translated by symbolic references are also stored in the runtime constant pool
String pool
Test questions
(if you know the output results of the following program, you can skip this lecture)
package stringtable;

/**
 * stringtable.StringTableTest
 *
 * @author ct
 * @date 2021/10/23
 */
public class StringTableTest {
  public static void main(String[] args) {
    String s1 = "a";
    String s2 = "b";
    String s3 = "a"+"b";
    String s4 = s1 + s2;
    String s5 = "ab";
    String s6 = s4.intern();
    System.out.println(s3 == s4);//
    System.out.println(s3 == s5);//
    System.out.println(s3 == s6);//

    String x1 = new String("c") + new String("d");
    String x3 = x1.intern();
    String x2 = "cd";

    //If you change the position of lines 22 and 23, or in jdk1 6 what about running
    System.out.println(x1==x3);//
    System.out.println(x2==x3);//
  }
}
Run the relationship between constant pool and string pool
The information of the constant pool is loaded into the runtime constant pool, and the string pool is part of the runtime constant pool
String pool properties
- The string in the constant pool is only a symbol and becomes an object when it is used for the first time
- The string pool mechanism is used to avoid repeated creation of string objects
- String variables are spliced through StringBuilder
- String constant splicing principle is optimized by compiler
- You can use the intern() method to actively put string objects that are not in the string pool into the string pool
- String pool is a bottom layer. It uses hashTable and can be used
Variable splicing
As follows, s1+s2 will be converted to new stringbuilder() append("a"). append("b"). toString()
String s1 = "a";
String s2 = "b";
String s3 = s1 + s2;
You can verify by looking at the bytecode.
[the external chain picture transfer fails. The source station may have an anti-theft chain mechanism. It is recommended to save the picture and upload it directly (img-5yu354ou-1639841933549) (/ users / fan / documents / soft / logseq0 / assets picgo / 1image_1635341062790_0. PNG)]
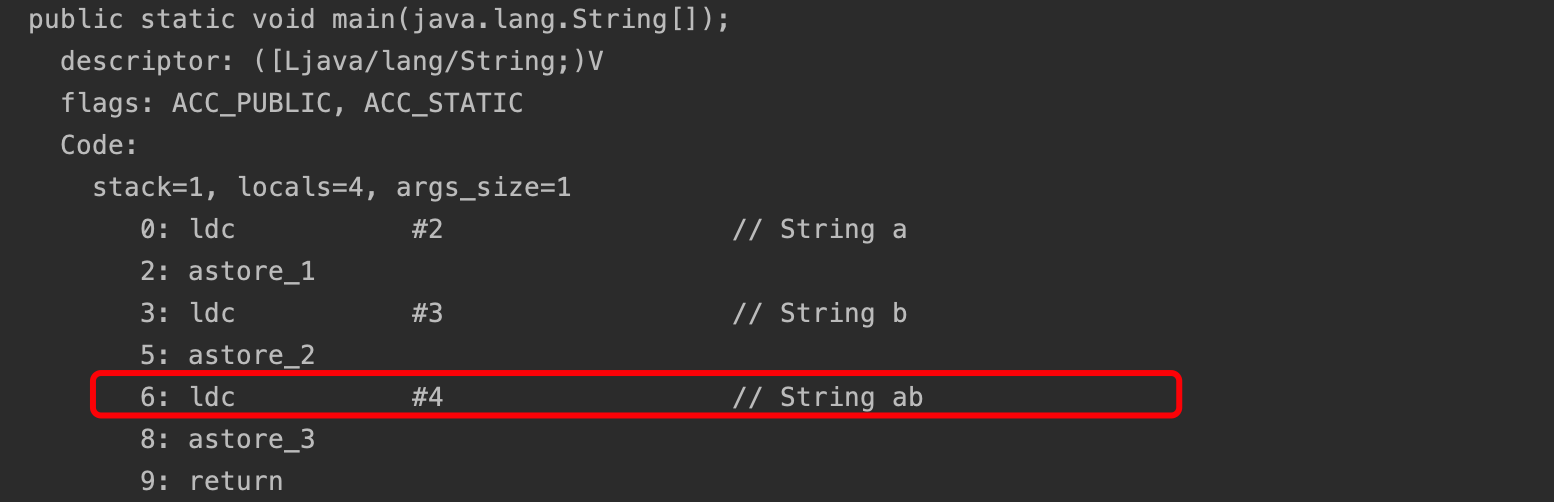
Constant splicing
For the direct addition of two string constants, it can be directly optimized into one string constant at compile time through javac
String s1 = "a";
String s2 = "b";
String s3 = "a" + "b";
Analysis of bytecode instructions shows that s3 is directly compiled into ab
Validation of delayed loading of string constants
Through the following code and the debug function of idea, let's verify the delayed loading process of string constants
package stringtable;

/**
 * stringtable.StringTableTest
 *
 * @author ct
 * @date 2021/10/23
 */
public class StringTableTest2 {
  public static void main(String[] args) {
    System.out.println();
    System.out.println("0");
    System.out.println("1");
    System.out.println("2");
    System.out.println("3");
    System.out.println("4");
    System.out.println("5");
    System.out.println("6");
    System.out.println("7");
    System.out.println("8");
    System.out.println("9");
    System.out.println();
  }
}
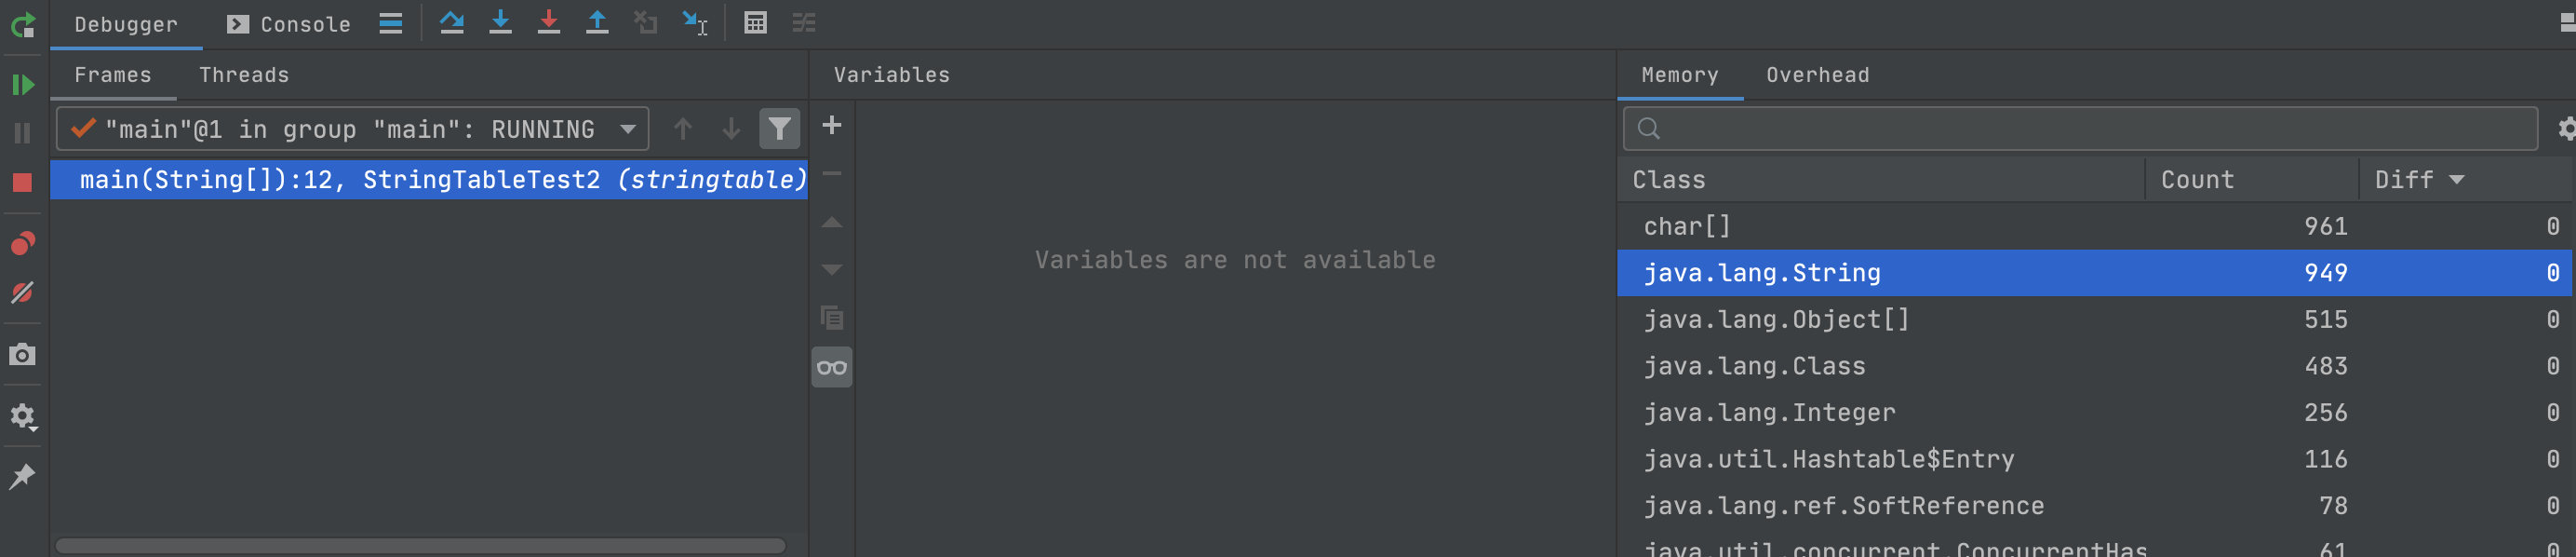
Break to lines 12, 22 and 32. When the code is executed to line 11, we can see that the number of instances of string class is 949 on the right side of the debug tool interface
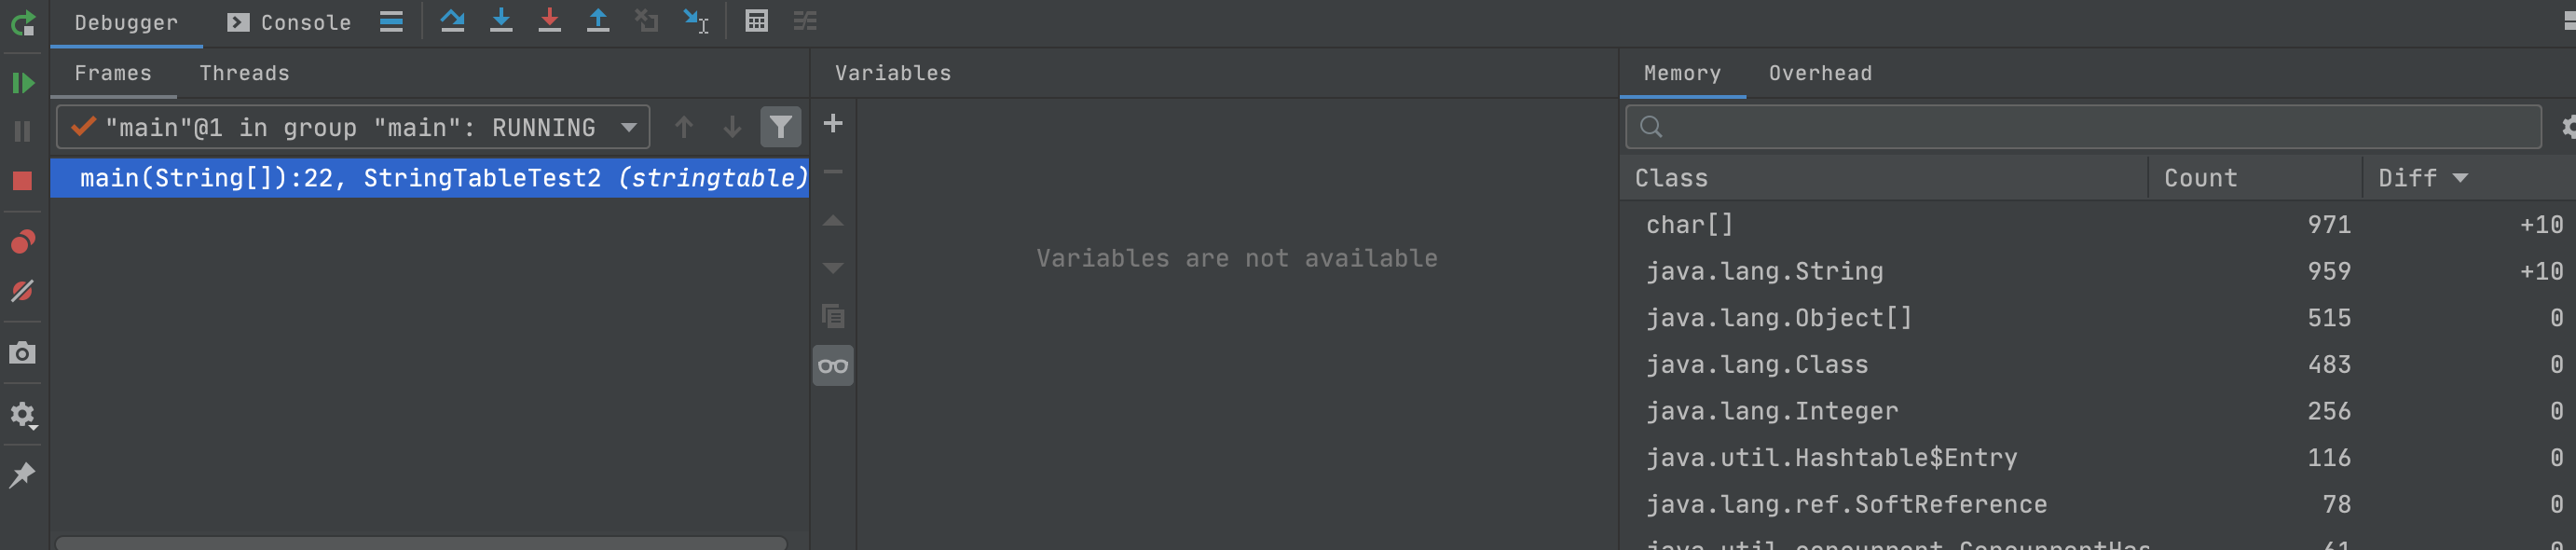
When the breakpoint is executed to the end of line 22, you can see that the number of instances becomes 959
However, at the end of line 32, the number of instances is still 959
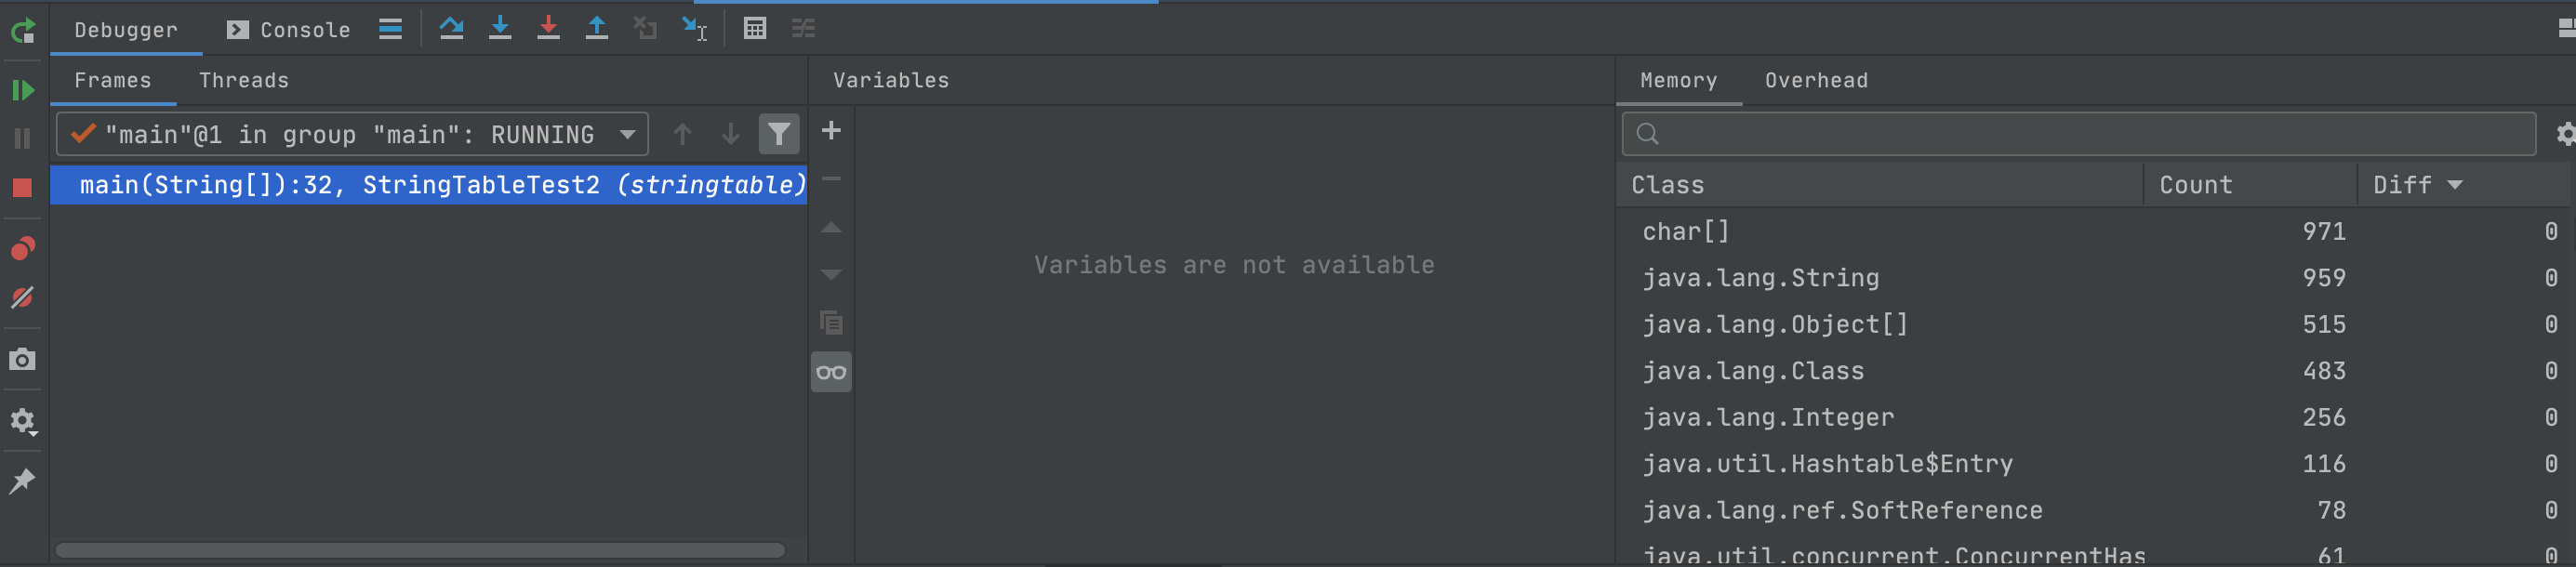
It can be seen from the above execution results that the string "0", "1", "2"... "9" does not exist in the string pool at first. During execution, create a string object, add it to the string pool and return its reference, and then execute it again. Because it already exists in the string pool, no new object will be created
intern() method
intern literally means detention and house arrest. It sounds quite in line with the function of this method. Put a string constant into the string pool in jdk1 8 and jdk1 6, there is a slight difference:
- 1.8 try to put the string into the string pool, if yes, do not put it, if not, put it into the string pool, and return an object reference
- 1.6 try to put the string into the string pool. If there is one, do not put it. If there is no one, copy it into the string pool and return an object reference
Location of string pool
-
Let's start with the conclusion
- jdk1.6 permanent generation existing in the method area
- jdk1.8 exists in the heap. Because the recovery efficiency of the permanent generation is not high, and the string belongs to the object used more frequently, the string pool is transferred to the heap in the 1.8 virtual machine
-
verification
The following code keeps writing data to the string constant pool, resulting in memory overflow
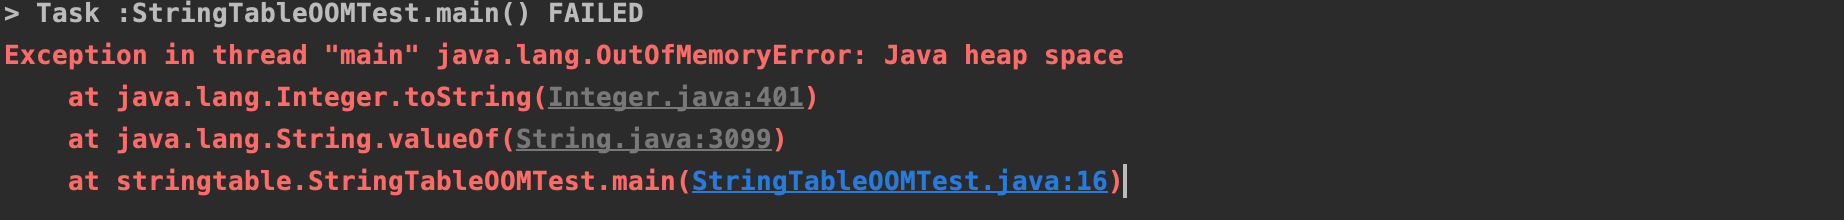
package stringtable;

import java.util.ArrayList;
import java.util.List;

/**
 * Test jdk1 8. Heap memory overflow caused by too large string pool. Before running, you need to modify the heap size to - Xmx=10m
 * VM args: -Xmx10m
 * @author ct
 * @date 2021/10/27
*/
public class StringTableOOMTest {
  public static void main(String[] args) {
    List<String> list = new ArrayList<>();
    for (int i = 0; i < 1000000; i++) {
      list.add(String.valueOf(i).intern());
    }
  }
}
After execution, it is found that an exception is thrown, but the exception prompt is GC overhead limit exceeded. According to the official Oracle document, it means that by default, if the Java process takes more than 98% of the time to execute GC and less than 2% of the heap is recovered each time, the JVM throws this error.
Exception in thread "main" java.lang.OutOfMemoryError: GC overhead limit exceeded
  at java.lang.Integer.toString(Integer.java:401)
  at java.lang.String.valueOf(String.java:3099)
  at stringtable.StringTableOOMTest.main(StringTableOOMTest.java:16)
You can use the - XX:-UseGCOverheadLimit parameter to make the virtual machine throw an exception directly when memory overflows. As can be seen from the printed information, a heap memory overflow exception was thrown.
Garbage collection in string pool
The string constant pool will also be garbage collected. Through the - XX:+PrintStringTableStatistics parameter, we can print the details of the string pool when the jvm exits
public class StringTableGCTest {
  public static void main(String[] args) {
    for (int i = 0; i < 100; i++) {
      String.valueOf(i).intern();
    }
  }
}
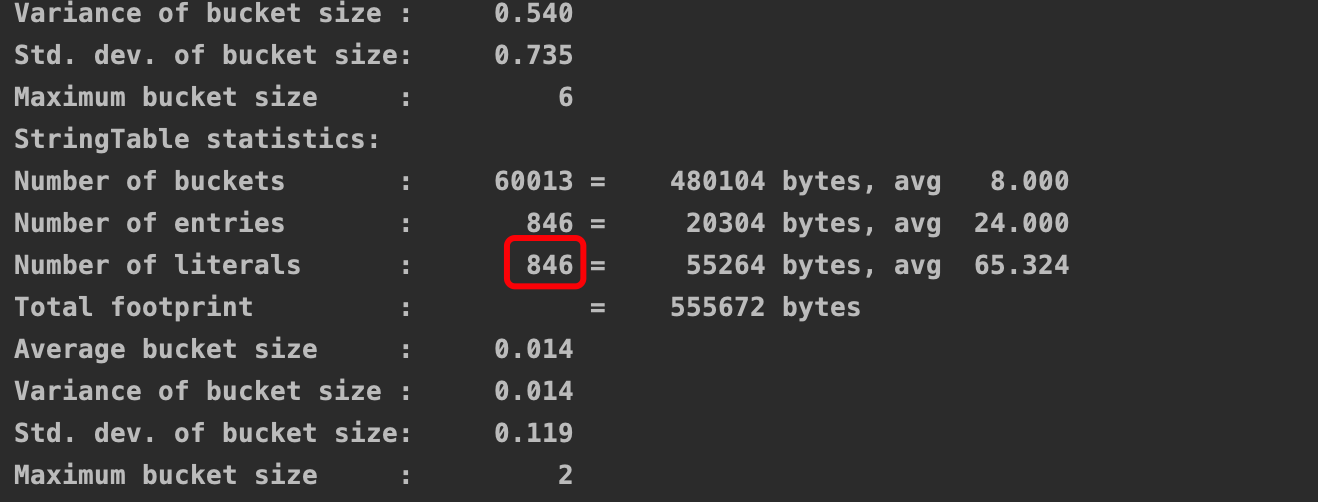
It can be seen from the print information that there are 846 strings in the string pool
We also add the string of 100 numbers from 100 to 199 to the string pool, and then run:
public class StringTableGCTest {
  public static void main(String[] args) {
    for (int i = 0; i < 200; i++) {
      String.valueOf(i).intern();
    }
  }
}
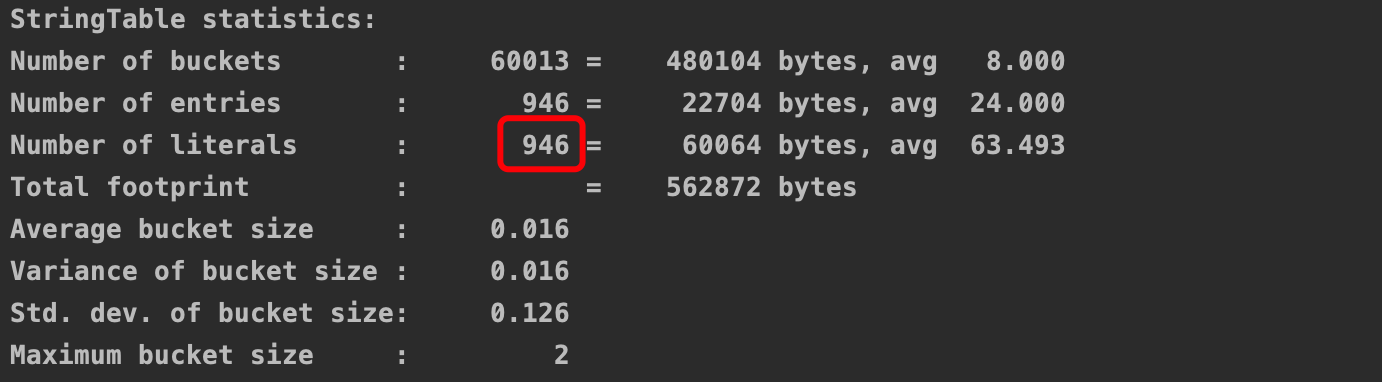
You can see that the number of strings increases to 946, and there is no memory overflow at this time
Then we increase the number of strings to 100000, set the maximum heap memory to - Xmx10m, and add the - XX:+PrintGCDetails parameter to view the gc log
public class StringTableGCTest {
  public static void main(String[] args) {
    for (int i = 0; i < 100000; i++) {
      String.valueOf(i).intern();
    }
  }
}
You can see that the number of strings in the string pool is only more than 30000
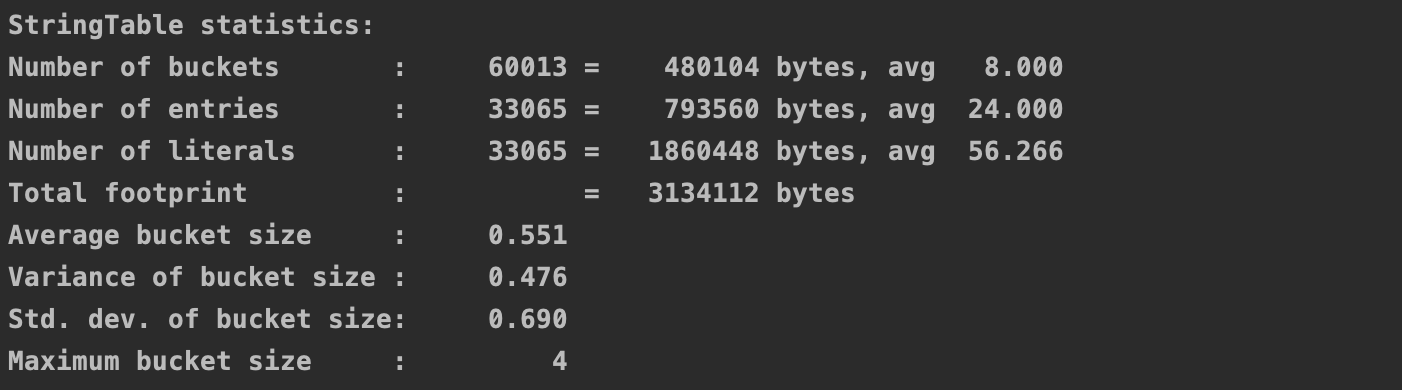
Looking at the log, we can see that the new generation of garbage collection has occurred, which shows that the string pool exists in the heap.

performance tuning
Set bucket size
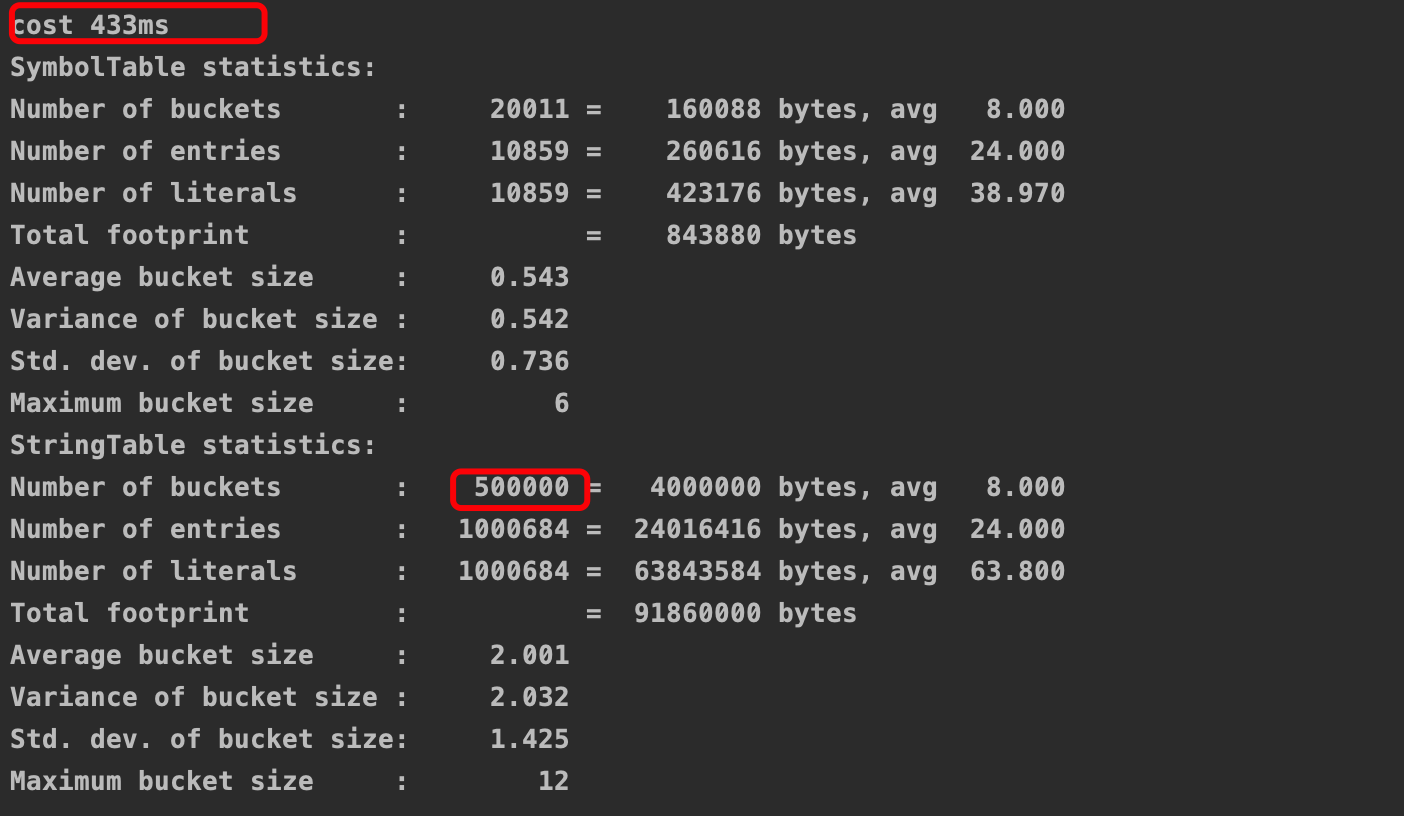
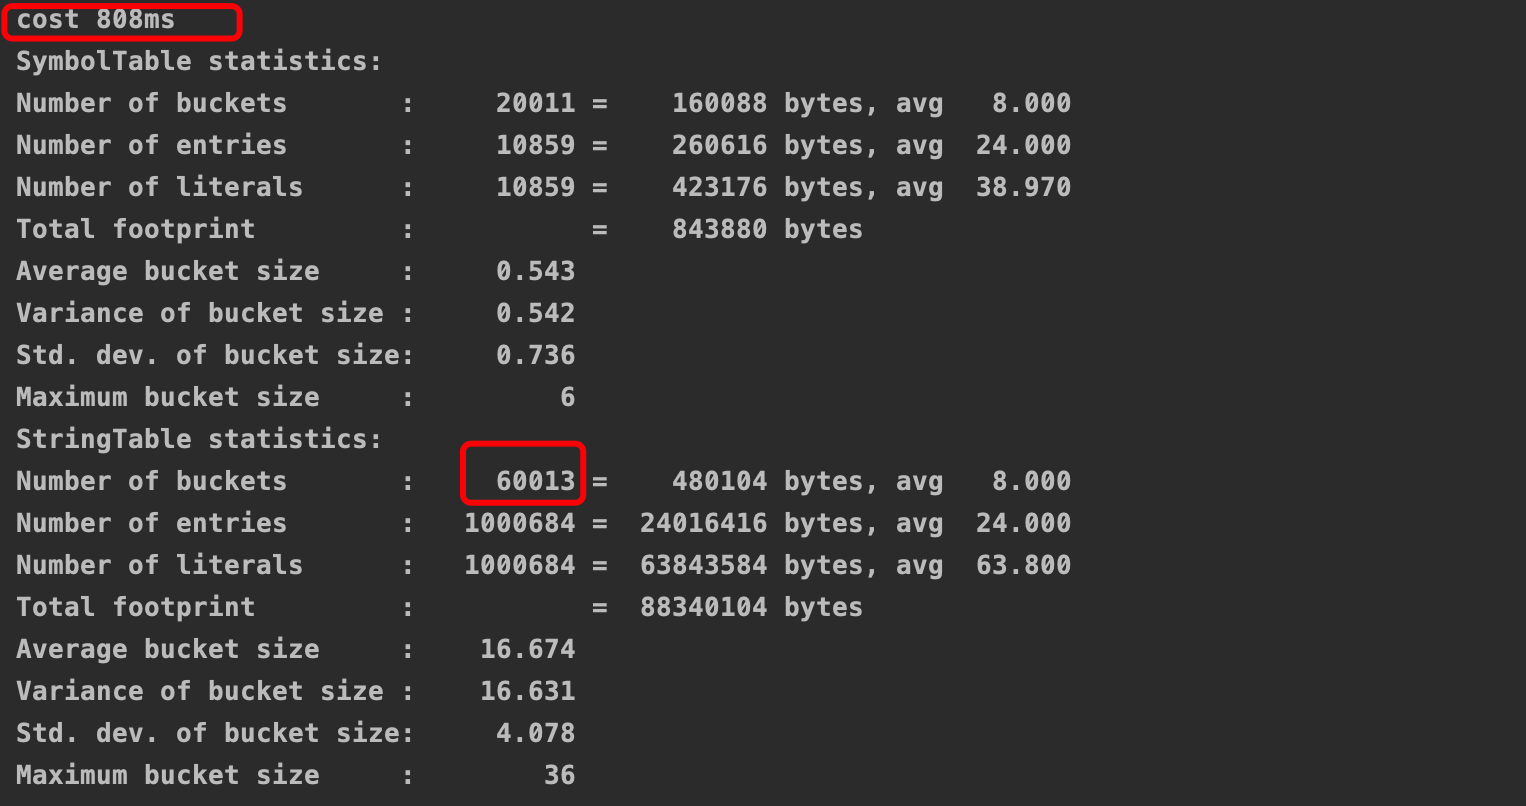
Because StringTable is a hash table, the larger the number of buckets, the less likely hash conflicts will occur and the higher the efficiency will be. We can increase the number of buckets through the jvm parameter - XX:StringTableSize. Take an example. First, we do not modify the StringTableSize(60013 by default), execute the following code and write a string to the string pool:
package stringtable;

import java.util.Random;

/**
 * Increase the number of buckets of StringTable to improve the efficiency of intern()
 * VM Args: -XX:StringTableSize=500000 -XX:+PrintStringTableStatistics
 * @author ct
 * @date 2021/10/23
 */
public class StringTableSizeTest {
  public static void main(String[] args) {
    Random random = new Random(1);
    long start = System.currentTimeMillis();
    for (int i = 0; i < 1000000; i++) {
      String.valueOf(random.nextInt()).intern();
    }
    System.out.println("cost "+(System.currentTimeMillis() - start));

  }
}
You can see that the execution time is 800ms
Then change the StringTableSize to 500000
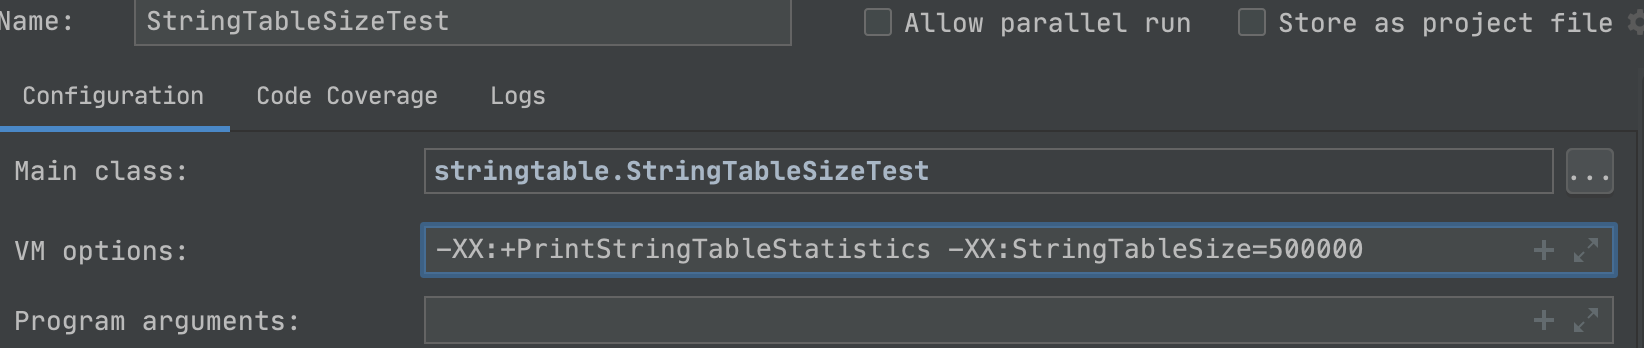
We can see that the efficiency has nearly doubled