From: https://www.cnblogs.com/ityouknow/p/5714703.html
Using the command of JVM can help us locate the problem easily in production monitoring and printing the log information of stack. Although there are many mature tools for JVM tuning: jconsole, famous Visual VM, IBM's Memory Analyzer and so on, when problems arise in the production environment, on the one hand, the use of tools will be limited, on the other hand, we like to install X, always like to enter some commands at the terminal to solve problems. Almost all tools rely on jdk interfaces and the underlying commands. Studying the use of these commands also gives us a better understanding of the composition and characteristics of jvm.
Sun JDK monitoring and fault handling commands are described below in jps jstat jmap jhat jstack jinfo
jps
JVM Process Status Tool, which displays all HotSpot virtual machine processes in the specified system.
Command format
jps [options] [hostid]
option parameter
- - l: Output main class full name or jar path
- - q: Output LVMID only
- - m: Output parameters passed to main() at JVM startup
- - v: Display the specified JVM parameters when the output JVM starts
The [option], [hostid] parameters can also be left out.
Example
$ jps -l -m
  28920 org.apache.catalina.startup.Bootstrap start
  11589 org.apache.catalina.startup.Bootstrap start
  25816 sun.tools.jps.Jps -l -m
jstat
jstat(JVM statistics Monitoring) is a command used to monitor the running state information of the virtual machine. It can display the class loading, memory, garbage collection, JIT compilation and other running data in the process of the virtual machine.
Command format
jstat [option] LVMID [interval] [count]
parameter
- [option]: Operational parameters
- LVMID: Local Virtual Machine Process ID
- [interval]: Time interval for continuous output
- [count]: Number of consecutive outputs
Overview of option parameters
| Option | Displays... |
|---|---|
| class | Classloader behavior statistics. Statistics on the behavior of the class loader. |
| compiler | HotSpt JIT compiler behavior statistics. Statistics of the behavior of the HotSpot Just-in-Time compiler. |
| gc | Behavior statistics of garbage collection dumps. Statistics of the behavior of the garbage collected heap. |
| gccapacity | Each generation capacity (young,old,perm) and their corresponding spatial statistics. Statistics of the capacities of the generations and their corresponding spaces. |
| gcutil | Overview of garbage collection statistics. Summary of garbage collection statistics. |
| gccause | Garbage collection statistics overview (same as - gcutil), plus the reasons for the last two garbage collection incidents. Summary of garbage collection statistics (same as -gcutil), with the cause of the last and |
| gcnew | Cenozoic Behavior Statistics. Statistics of the behavior of the new generation. |
| gcnewcapacity | Cenozoic and its corresponding memory space statistics. Statistics of the sizes of the new generations and its corresponding spaces. |
| gcold | Behavior statistics of the old and the immortal generations. Statistics of the behavior of the old and permanent generations. |
| gcoldcapacity | Behavior statistics of the elderly. Statistics of the sizes of the old generation. |
| gcpermcapacity | Eternal Behavior Statistics. Statistics of the sizes of the permanent generation. |
| printcompilation | HotSpot compilation method statistics. HotSpot compilation method statistics. |
Detailed explanation of option parameters
-class
Monitor class loading, unloading number, total space, and time consumed
$ jstat -class 11589
 Loaded  Bytes  Unloaded  Bytes     Time
  7035  14506.3     0     0.0       3.67
- Loaded: Number of class es loaded
- Bytes: class byte size
- Unloaded: Number of unloaded class es
- Bytes: Bytes size of unloaded class es
- Time: Load time
-compiler
Output JIT compiled method number time-consuming, etc.
$ jstat -compiler 1262
Compiled Failed Invalid   Time   FailedType FailedMethod
2573 1 0 47.60 1 org/apache/catalina/loader/WebappClassLoader findResourceInternal - Compiled: Number of Compiles
- Failed: Number of compilation failures
- Invalid: Invalid number
- Time: Compilation time-consuming
- Failed Type: Failed Type
- Failed Method: Fully qualified name of the failed method
-gc
Behavior statistics of garbage collection heaps, common commands
$ jstat -gc 1262
 S0C    S1C     S0U     S1U   EC       EU        OC         OU        PC       PU         YGC    YGCT    FGC    FGCT     GCT
26112.0 24064.0 6562.5  0.0   564224.0 76274.5   434176.0   388518.3  524288.0 42724.7    320    6.417   1      0.398    6.815
C is the total capacity of Capacity, U is the capacity used by Used.
- S0C: Total capacity of survivor 0 zone
- S1C: Total capacity of survivor 1
- S0U: Capacity already in use in survivor 0
- S1C: Capacity used in survivor1 area
- EC: Total capacity of Eden area
- EU: Capacity used in Eden area
- OC: Total capacity of Old area
- OU: Old area used capacity
- Current perm Capacity (KB) of PC
- Use of PU perm (KB)
- YGC: New Generation Waste Recycling Number
- YGCT: New Generation Garbage Recycling Time
- FGC: Number of garbage recycling in the elderly
- FGCT: Older Garbage Recycling Time
- GCT: Total Waste Recovery Time
$ jstat -gc 1262 2000 20
This command means output 1262 gc cases every 2000 ms, a total of 20 times
-gccapacity
Same as - gc, but it also outputs the maximum and minimum space used by each area of the Java heap
$ jstat -gccapacity 1262
 NGCMN    NGCMX     NGC    S0C   S1C       EC         OGCMN      OGCMX      OGC        OC       PGCMN    PGCMX     PGC      PC         YGC    FGC
614400.0 614400.0 614400.0 26112.0 24064.0 564224.0   434176.0   434176.0   434176.0   434176.0 524288.0 1048576.0 524288.0 524288.0    320     1
- NGCMN: The Minimum Space Occupied by the Cenozoic Era
- NGCMX: The largest space occupied by the Cenozoic
- OGCMN: The Minimum Space Occupied by Older Generations
- OGCMX: The Largest Space Occupied by Older Generations
- OGC: Current capacity of older generations (KB)
- OC: Space for the Aged (KB)
- PGCMN: Minimum space occupied by perm
- PGCMX: Maximum space occupied by perm
-gcutil
Same as - gc, but the output is the percentage of used space in total space
$ jstat -gcutil 28920
  S0     S1     E      O      P     YGC     YGCT    FGC    FGCT     GCT
 12.45   0.00  33.85   0.00   4.44  4       0.242     0    0.000    0.242
-gccause
Overview of garbage collection statistics (same as - gcutil), plus the reasons for the last two garbage collection incidents
$ jstat -gccause 28920
  S0     S1     E      O      P       YGC     YGCT    FGC    FGCT     GCT    LGCC                 GCC
 12.45   0.00  33.85   0.00   4.44      4    0.242     0    0.000    0.242   Allocation Failure   No GC
- LGCC: Reasons for Recent Waste Recycling
- GCC: Reasons for Current Garbage Recycling
-gcnew
Statistical Cenozoic Behavior
$ jstat -gcnew 28920
 S0C      S1C      S0U        S1U  TT  MTT  DSS      EC        EU         YGC     YGCT
 419392.0 419392.0 52231.8    0.0  6   6    209696.0 3355520.0 1172246.0  4       0.242
- TT: Tenuring threshold
- MTT: Maximum tenuring threshold
- DSS: survivor region size (KB)
-gcnewcapacity
Statistics of Cenozoic and its corresponding memory space
$ jstat -gcnewcapacity 28920
  NGCMN      NGCMX       NGC      S0CMX     S0C     S1CMX     S1C       ECMX        EC        YGC   FGC
 4194304.0  4194304.0  4194304.0 419392.0 419392.0 419392.0 419392.0  3355520.0  3355520.0     4     0
- NGC: Current Young Generation Capacity (KB)
- S0CMX: Maximum S0 Space (KB)
- S0C: Current S0 Space (KB)
- ECMX: Maximum eden space (KB)
- EC: Current eden space (KB)
-gcold
Statistical Behavior of the Old Generation
$ jstat -gcold 28920
   PC       PU        OC           OU       YGC    FGC    FGCT     GCT
1048576.0  46561.7   6291456.0     0.0      4      0      0.000    0.242
-gcoldcapacity
Statistics of the size and space of the Paleozoic
$ jstat -gcoldcapacity 28920
   OGCMN       OGCMX        OGC         OC         YGC   FGC    FGCT     GCT
  6291456.0   6291456.0   6291456.0   6291456.0     4     0    0.000    0.242
-gcpermcapacity
Eternal Behavior Statistics
$ jstat -gcpermcapacity 28920
    PGCMN      PGCMX       PGC         PC      YGC   FGC    FGCT     GCT
 1048576.0  2097152.0  1048576.0  1048576.0     4     0    0.000    0.242
-printcompilation
hotspot compilation statistics
$ jstat -printcompilation 28920
    Compiled  Size  Type Method
1291 78 1 java/util/ArrayList indexOf- Compiled: Number of compiled tasks performed
- Size: The number of bytes in the method bytecode
- Type: Compile type
- Method: The class name and method name of the compiled method. The class name uses "/" instead of "." as the space separator. The method name is the method name given to the class. The format is consistent with the HotSpot-XX:+PrintComplation option.
jmap
The jmap(JVM Memory Map) command is used to generate heap dump files. If you don't use this command, you can also use the - XX:+HeapDumpOnOutOfMemoryError parameter to automatically generate dump files when OOM appears on the virtual machine.
jmap not only generates dump files, but also queries finalize execution queues, Java heap, and permanent generation details, such as current usage, which collector is currently in use, and so on.
Command format
jmap [option] LVMID
option parameter
- dump : Generate heap dump snapshots
- finalizerinfo : Displayed in F-Queue Queue waiting Finalizer Thread execution finalizer Objects of methods
- heap : display Java Heap details
- histo : Display the statistical information of objects in the heap
- permstat : to print permanent generation statistics
- F : When-dump When there is no response, force generation dump snapshot
Example
-dump
Common format
-dump::live,format=b,file=<filename> pid dump heaps into files, format specifies the output format, live specifies the live object, and file specifies the file name.
$ jmap -dump:live,format=b,file=dump.hprof 28920
  Dumping heap to /home/xxx/dump.hprof ...
  Heap dump file created
The suffix dump.hprof is for subsequent opening directly with MAT(Memory Anlysis Tool).
-finalizerinfo
Print information about objects waiting to be recycled
$ jmap -finalizerinfo 28920
  Attaching to process ID 28920, please wait...
  Debugger attached successfully.
  Server compiler detected.
  JVM version is 24.71-b01
  Number of objects pending for finalization: 0
You can see that there are no objects in the current F-QUEUE queue waiting for Finalizer threads to execute finalizer methods.
-heap
Print the summary information of heap, the algorithm used by GC, the configuration of heap and the usage of wise heap, which can be used to judge the current usage of memory and garbage collection.
$ jmap -heap 28920
  Attaching to process ID 28920, please wait...
  Debugger attached successfully.
  Server compiler detected.
  JVM version is 24.71-b01

  using thread-local object allocation.
  Parallel GC with 4 thread(s)//GC mode

  Heap Configuration: //Heap memory initialization configuration
     MinHeapFreeRatio = 0 //Set the JVM heap minimum idle ratio (default 40) corresponding to the JVM startup parameter - XX:MinHeapFreeRatio
     MaxHeapFreeRatio = 100 //Set the JVM heap maximum idle ratio (default 70) corresponding to the JVM startup parameter - XX:MaxHeapFreeRatio
     MaxHeapSize      = 2082471936 (1986.0MB) //The corresponding JVM startup parameter - XX:MaxHeapSize = Sets the maximum size of the JVM heap
     NewSize          = 1310720 (1.25MB)//Corresponding to the JVM startup parameter - XX:NewSize = Set the default size of the'Cenozoic'of the JVM heap
     MaxNewSize       = 17592186044415 MB//Corresponding to the JVM startup parameter - XX:MaxNewSize = Setting the maximum size of the'Cenozoic'of the JVM heap
     OldSize          = 5439488 (5.1875MB)//Corresponding to the JVM startup parameter - XX: OldSize= < value >: Setting the size of the'Old Generation'of the JVM heap
     NewRatio         = 2 //Corresponding to the jvm startup parameter - XX:NewRatio=:'Cenozoic'and'Old Generation' size ratio
     SurvivorRatio    = 8 //The corresponding jvm startup parameter - XX:SurvivorRatio = Sets the size ratio of Eden area to Survivor area in the younger generation
     PermSize         = 21757952 (20.75MB)  //Corresponding to the JVM startup parameter - XX: PermSize = < value >: Setting the initial size of the'immortal'of the JVM heap
     MaxPermSize      = 85983232 (82.0MB)//Corresponding to the JVM startup parameter - XX: MaxPermSize=<value>: Set the maximum size of the'immortal'of the JVM heap
     G1HeapRegionSize = 0 (0.0MB)

  Heap Usage://Heap memory usage
  PS Young Generation
  Eden Space://Existence Distribution in Eden Area
     capacity = 33030144 (31.5MB)//Eden area total capacity
     used     = 1524040 (1.4534378051757812MB)  //Eden area is in use
     free     = 31506104 (30.04656219482422MB)  //Eden Area Residual Capacity
     4.614088270399305% used //Eden area utilization ratio
  From Space:  //Memory distribution in one of the Survivor areas
     capacity = 5242880 (5.0MB)
     used     = 0 (0.0MB)
     free     = 5242880 (5.0MB)
     0.0% used
  To Space:  //Memory distribution in another Survivor area
     capacity = 5242880 (5.0MB)
     used     = 0 (0.0MB)
     free     = 5242880 (5.0MB)
     0.0% used
  PS Old Generation //Current memory distribution in Old region
     capacity = 86507520 (82.5MB)
     used     = 0 (0.0MB)
     free     = 86507520 (82.5MB)
     0.0% used
  PS Perm Generation//Current "Eternal" memory distribution
     capacity = 22020096 (21.0MB)
     used     = 2496528 (2.3808746337890625MB)
     free     = 19523568 (18.619125366210938MB)
     11.337498256138392% used

  670 interned Strings occupying 43720 bytes.
It's clear what's going on in each area of the Java heap.
-histo
Object statistics of print heap, including number of objects, memory size and so on (because full gc is performed before dump:live, only live objects are counted if live is brought, so the heap size without live is larger than that with live heap).
$ jmap -histo:live 28920 | more
 num     #instances         #bytes  class name
----------------------------------------------
   1:         83613       12012248  <constMethodKlass>
   2:         23868       11450280  [B
   3:         83613       10716064  <methodKlass>
   4:         76287       10412128  [C
   5:          8227        9021176  <constantPoolKlass>
   6:          8227        5830256  <instanceKlassKlass>
   7:          7031        5156480  <constantPoolCacheKlass>
   8:         73627        1767048  java.lang.String
   9:          2260        1348848  <methodDataKlass>
  10:          8856         849296  java.lang.Class
  ....
Only the first 10 lines were printed.
xml class name is the object type, as follows:
B  byte
C  char
D  double
F  float
I  int
J  long
Z  boolean
[  Arrays, such as[I Express int[]
[L+Class Name Other Objects
-permstat
Print the smart statistics of the class loader for the permanent storage area of Java heap memory. For each class loader, its name, activity, address, parent class loader, the number and size of classes it loads are printed. In addition, the number and size of the included strings will also be printed.
$ jmap -permstat 28920
  Attaching to process ID 28920, please wait...
  Debugger attached successfully.
  Server compiler detected.
  JVM version is 24.71-b01
  finding class loader instances ..done.
  computing per loader stat ..done.
  please wait.. computing liveness.liveness analysis may be inaccurate ...

  class_loader            classes bytes   parent_loader           alive?  type
  <bootstrap>             3111    18154296          null          live    <internal>
  0x0000000600905cf8      1       1888    0x0000000600087f08      dead    sun/reflect/DelegatingClassLoader@0x00000007800500a0
  0x00000006008fcb48      1       1888    0x0000000600087f08      dead    sun/reflect/DelegatingClassLoader@0x00000007800500a0
  0x00000006016db798      0       0       0x00000006008d3fc0      dead    java/util/ResourceBundle$RBClassLoader@0x0000000780626ec0
  0x00000006008d6810      1       3056      null          dead    sun/reflect/DelegatingClassLoader@0x00000007800500a0
-F
Compulsory mode. If the specified pid does not respond, use the jmap-dump or jmap-histo options. live sub-option is not supported in this mode.
jhat
jhat(JVM Heap Analysis Tool) command is used in conjunction with jmap to analyze dump generated by jmap. jhat has built-in a miniature HTTP/HTML server. After generating dump analysis results, it can be viewed in the browser. It should be noted here that the analysis is not usually done directly on the server, because jhat is a time-consuming and hardware-consuming process, and dump files generated by the server are generally copied to local or other machines for analysis.
Command format
jhat [dumpfile]
parameter
- -stack false|true
Close the tracking object allocation call stack. If the allocation location information is not available in the heap dump, this flag must be set to false. The default value is true. > - -refs false|true
Close tracking of references to objects. The default value is true. By default, the returned pointer refers to objects that are directed to other specific objects, such as backlinks or incoming references, and counts / calculates all objects in the heap. > - -port port-number
Set the port number of jhat HTTP server. Default value 7000. > - -exclude exclude-file
Data member list file (a file that lists data members that should be excluded from the reachable objects query) that needs to be excluded when specifying object queries. For example, if the file column lists java.lang.String.value, references involving java.lang.String.value are excluded when calculating the list of reachable objects from a particular object Object o. > - -baseline exclude-file
Specify a baseline heap dump. Objects with the same object ID in two heap dumps are marked as not being new. Other objects are marked as new. It is useful to compare two different heap dumps. > - -debug int
Setting debug level. 0 means no debugging information is output. The larger the value, the more detailed debug information is output. - -version
Exit when only version information is displayed after startup - -J< flag >
Because the jhat command actually starts a JVM to execute, some startup parameters can be passed in through - J when starting the JVM. For example, - J-Xmx512m specifies that the maximum heap memory used by the Java virtual machine running jhat is 512 MB. If multiple JVM startup parameters are required, multiple - Jxxxxxx xx can be passed in.
Example
$ jhat -J-Xmx512m dump.hprof
  eading from dump.hprof...
  Dump file created Fri Mar 11 17:13:42 CST 2016
  Snapshot read, resolving...
  Resolving 271678 objects...
  Chasing references, expect 54 dots......................................................
  Eliminating duplicate references......................................................
  Snapshot resolved.
  Started HTTP server on port 7000
  Server is ready.
The intermediate-J-Xmx512m allocates 512M memory to start the HTTP server when the dump snapshot is large. After running, the browser can open Http://localhost:7000 for snapshot analysis.
The heap snapshot analysis is mainly in Heap Histogram at the end, which lists all surviving objects at dump time according to class.
Analyzing the same dump snapshot, MAT needs much less extra memory than jhat, so it is recommended to use MAT for analysis, depending on personal preferences, of course.
Analysis
Open the browser Http://localhost:7000, which provides several query functions for use:
All classes including platform
Show all members of the rootset
Show instance counts for all classes (including platform)
Show instance counts for all classes (excluding platform)
Show heap histogram
Show finalizer summary
Execute Object Query Language (OQL) query
In general, heap exceptions can be viewed in two parts:
Show instance counts for all classes (excluding platform), all object information outside the platform. As follows: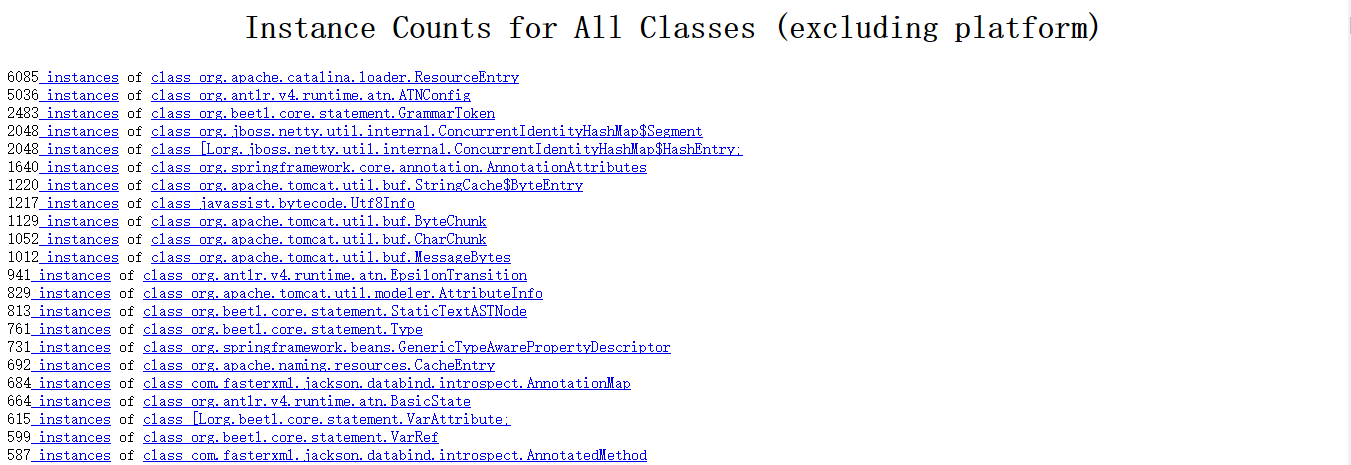
Show heap histogram shows the heap situation in a tree-like format. As follows: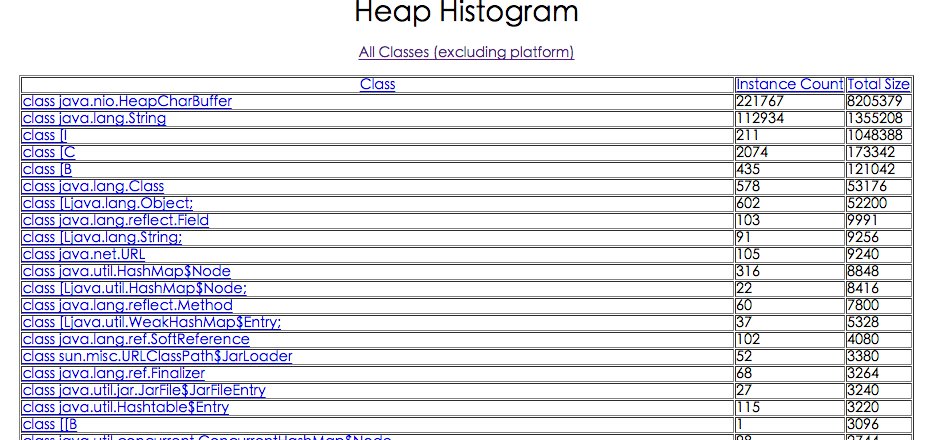
Specific checks need to be combined with code to see whether a large number of objects should be recycled have been referenced or whether there are objects that occupy too much memory can not be recycled.
In general, it will be down loaded to the client and analyzed with tools.
jstack
Jstack is used to generate thread snapshots of the current time of the Java virtual machine. Thread snapshots are a collection of method stacks that are being executed by each thread in the current Java virtual machine. The main purpose of generating thread snapshots is to locate the causes of long thread pauses, such as deadlocks between threads, deadlocks, long waiting caused by requesting external resources, etc. When a thread pauses, it can look through the call stack of each thread through jstack to see what the unresponsive thread is doing in the background or waiting for what resources. If a java program crashes to generate a core file, the jstack tool can be used to obtain information about the java stack and native stack of the core file, so that it can easily know how the Java program crashes and where the problem occurs. In addition, the jstack tool can also be attached to the running Java program, and see the information of the java stack and native stack of the running Java program at that time. jstack is very useful if the running Java program is hung.
Command format
jstack [option] LVMID
option parameter
- - F: Force the output thread stack when the normal output request is not responded to
- - l: Display additional information about locks in addition to stacks
- - m: If you call a local method, you can display the C/C++ stack
Example
$ jstack -l 11494|more
2016-07-28 13:40:04
Full thread dump Java HotSpot(TM) 64-Bit Server VM (24.71-b01 mixed mode):

"Attach Listener" daemon prio=10 tid=0x00007febb0002000 nid=0x6b6f waiting on condition [0x0000000000000000]
   java.lang.Thread.State: RUNNABLE

   Locked ownable synchronizers:
        - None

"http-bio-8005-exec-2" daemon prio=10 tid=0x00007feb94028000 nid=0x7b8c waiting on condition [0x00007fea8f56e000]
   java.lang.Thread.State: WAITING (parking)
        at sun.misc.Unsafe.park(Native Method)
        - parking to wait for  <0x00000000cae09b80> (a java.util.concurrent.locks.AbstractQueuedSynchronizer$ConditionObject)
        at java.util.concurrent.locks.LockSupport.park(LockSupport.java:186)
        at java.util.concurrent.locks.AbstractQueuedSynchronizer$ConditionObject.await(AbstractQueuedSynchronizer.java:2043)
        at java.util.concurrent.LinkedBlockingQueue.take(LinkedBlockingQueue.java:442)
        at org.apache.tomcat.util.threads.TaskQueue.take(TaskQueue.java:104)
        at org.apache.tomcat.util.threads.TaskQueue.take(TaskQueue.java:32)
        at java.util.concurrent.ThreadPoolExecutor.getTask(ThreadPoolExecutor.java:1068)
        at java.util.concurrent.ThreadPoolExecutor.runWorker(ThreadPoolExecutor.java:1130)
        at java.util.concurrent.ThreadPoolExecutor$Worker.run(ThreadPoolExecutor.java:615)
        at org.apache.tomcat.util.threads.TaskThread$WrappingRunnable.run(TaskThread.java:61)
        at java.lang.Thread.run(Thread.java:745)

   Locked ownable synchronizers:
        - None
      .....
Analysis
Here's an article that explains it well.
Analysis of printed documents
jinfo
The command jinfo(JVM Configuration info) is used to view and adjust virtual machine running parameters in real time.
Previous jps-v passwords can only view the specified parameters. If you want to see the values of the parameters that are not displayed, you need to use the jinfo password.
Command format
jinfo [option] [args] LVMID
option parameter
- - flag: Output the value of the specified args parameter
- - flags: Output all JVM parameters without args parameters
- - sysprops: Output system properties, equivalent to System.getProperties()
Example
$ jinfo -flag 11494
-XX:CMSInitiatingOccupancyFraction=80