1, Overview of tuning
1.1 purpose of tuning
- Prevent the occurrence of OOM, and carry out JVM planning and pre tuning
- Solve various OOM problems in program operation
- Reduce the frequency of Full GC and solve the problems of slow operation and jamming
2, Problems of production environment
2.1 heap overflow
reason:
1. There may be large object assignments in the code
2. There may be a memory leak, resulting in the failure to find a large enough memory to hold the current object after multiple GC s.
resolvent:
1. Check whether there is allocation of large objects, most likely large array allocation
2. dump the heap memory through the jmap command, analyze it with tools such as MAT, and check whether there is a memory leak
3. If no obvious memory leak is found, use - Xmx to add a lot of memory
4. Another point is easy to be ignored. Check whether there are a large number of customized Finalizable objects, which may also be provided within the framework. Consider the necessity of their existence
Case:
 	/**
     * Case 1: simulating online environment OOM
     * Parameter setting:
     * -XX:+PrintGCDetails -XX:MetaspaceSize=64m
     * -XX:+HeapDumpOnOutOfNemoryError -XX:HeapDumpPath=heap/heapdump.hprof
     * -XX:+PrintGCDateStamps -Xms30M -Xmx30M -Xloggc:log/gc-oomHeap.log
     *
     */
    @RequestMapping("/oomTest")
    public void addObject(){
        System.err.println("oomTest"+peopleSevice);
        ArrayList<People> people = new ArrayList<>();
        while (true){
            people.add(new People());
        }
    }
2.2 overflow of meta space
reason:
1. A large number of proxy classes are generated during operation, resulting in the explosion of the method area and unable to unload
2. The application runs for a long time without restarting
3. The meta space memory setting is too small
resolvent:
1. A large number of proxy classes are generated during operation, resulting in the explosion of the method area and unable to unload
2. The application runs for a long time without restarting
3. The meta space memory setting is too small
Case:
	/**
     * Case 2: analog meta space OOM overflow
     *Parameter setting:
     * -XX:+PrintGCDetails -XX:MetaspaceSize=60m -XX:MaxMetaspaceSize=60m-XSS512K -XX:+HeapDumponOutOfMemoryErrorl
     * -XX:HeapDumpPath=heap/heapdumpMeta.hprof -xx:SurvivorRatio=8
     * -XX:+TraceClassLoading -XX:+TraceClassUnloading -XX:+PrintGCDateStamps-Xms60M -Xmx60M -Xloggc:log/gc-oomMeta.log
     */
    @RequestMapping("/metaSpaceOom")
    public void metaSpaceOom(){
        ClassLoadingMXBean classLoadingMXBean = ManagementFactory.getClassLoadingMXBean();
        while (true){
            Enhancer enhancer = new Enhancer();
            enhancer.setSuperclass(People.class);
            enhancer.setUseCache(false);
            //enhancer.setUseCache(true);
            enhancer.setCallback((MethodInterceptor) (o, method, objects, methodProxy) -> {
                System.out.println("I am an enhanced class, output print Previous reinforcement methods");
                return methodProxy.invokeSuper(o,objects);
            });
            People people = (People)enhancer.create();
            people.print();
            System.out.println(people.getClass());
            System.out.println("totalClass:" + classLoadingMXBean.getTotalLoadedClassCount());
            System.out.println("activeClass:" + classLoadingMXBean.getLoadedClassCount());
            System.out.println("unloadedClass:" + classLoadingMXBean.getUnloadedClassCount());
        }
    }
2.3,GC overhead limit exceeded
reason:
This is a new error type added to DK6. Generally, it is caused by too small heap. Sun's official definition: this exception will be thrown when more than 98% of the time is spent on GC and less than 2% of the heap memory is recycled. It is essentially a pre judgment exception. When this exception is thrown, the system does not have a real memory overflow
solve:
1. Check whether there are a large number of dead loops or code using large memory in the project, and optimize the code.
2. Add the parameter - XX:-UseGCOverheadLimit to disable this check. In fact, this parameter can not solve the memory problem, but delay the error information, and finally Java lang.OutOfMemoryError: Java heap
space.
3. dump memory. Check whether there is memory leakage. If not, increase the memory.
Test:
	/**
     *
     * Test GC overhead limit exceeded
     * Parameter setting:
     * -XX:+PrintGCDetails -XX:+HeapDumpOnOutOfMemoryError
     * -XX:HeapDumpPath=heap/dumpExceeded.hprof
     * -XX:+PrintGCDateStamps -Xms10M -Xmx1OM-xloggc:log/gc-oomExceeded.log
     */
    public static void main(String[] args) {
        test1();

//        test2();
    }

    public static void test1() {
        int i = 0;
        List<String> list = new ArrayList<>();
        try {
            while (true) {
                list.add(UUID.randomUUID().toString().intern());
                i++;
            }
        } catch (Throwable e) {
            System.out.println("************i: " + i);
            e.printStackTrace();
            throw e;
        }
    }


	//The recovery efficiency is greater than 2%, so there will only be insufficient heap space
	public static void test2() {
        String str = "";
        Integer i = 1;
        try {
            while (true) {
                i++;
                str += UUID.randomUUID();
            }
        } catch (Throwable e) {
            System.out.println("************i: " + i);
            e.printStackTrace();
            throw e;
        }
    }
2.4 thread overflow
Note: windos can't be tried out. If it goes online beyond windos, it will restart
Thread creation formula:
(MaxProcessMemory - JVMMemory - ReservedOsMemory) / (ThreadStackSize) = Numberof threads
MaxProcessMemory refers to the maximum addressable space of a process
VMMemory JVM memory
ReservedOsMemory reserved operating system memory
Threadsacksize the size of the thread stack
Note: under the 32-bit operating system, the value of MaxProcessMemory (maximum addressing space) followed by the current formula under the 64 bit operating system is close to infinity, so threadsacksize does not affect the value of the formula
Number of Linux viewing threads:
cat /proc/sys/kernel/pid_max system maximum PID value, which can be appropriately increased in large systems
Cat / proc / sys / kernel / threads Max maximum number of threads allowed by the system
maxuserprocess (ulimit -u) the system limits the maximum number of processes or threads that can run under a user
cat /proc/sys/vm/max_map_count
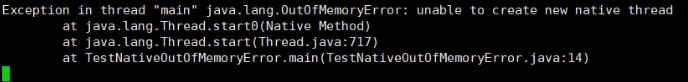
program
public class TestNativeOutOfMemoryError {
    public static void main(String[] args) {
        for (int i = 0; ; i++) {
            System.out.println("i = " + i);
            new Thread(new HoldThread()).start();
        }
    }
}

class HoldThread extends Thread {
    CountDownLatch cdl = new CountDownLatch(1);

    @Override
    public void run() {
        try {
            cdl.await();
        } catch (InterruptedException e) {
        }
    }
}
3, Performance optimization
3.1 performance monitoring
An activity that collects or views application operational performance data in a non forced or intrusive manner.
Before monitoring, set the collector combination, select the CPU (the higher the dominant frequency is, the better), set the age ratio, and set the log parameters (usually there is not only one log file in the production environment). For example:
-Xloggc:/opt/xxx/logs/xxx-xxx-gc-%t.log
-XX:+UseGCLogFileRotation
-XX:NumberOfGCLogFiles=5
-XX:GCLogFileSize=20M
-XX:+PrintGCDetails
-XX:+PrintGCDateStamps
-XX:+PrintGcCause
Question:
- GC frequent
- cpu load too high
- OOM
- Memory leak
- deadlock
- Program response time too long
3.2 performance analysis
- Print log through GCviewer http://gceasy.io To analyze log information
- Flexible use of command-line tools, jstack, jmap, jinfo, etc
- dump the heap file, and use the memory analysis tool to analyze the file (jconsole / jvisualvm / jpprofiler)
- Use Alibaba Arthas, jconsole, and JVisualVM to view the JVM status in real time
- jstack view stack information
3.3 performance tuning
- Appropriately increase the memory and select the garbage collector according to the business background
- Optimize code and control memory usage
- Increase the machine and disperse the node pressure
- Reasonably set the number of threads in the thread pool
- Use middleware to improve program efficiency, such as cache, message queue, etc
4, Optimization case
4.1 adjust heap memory size to improve performance
Test parameter setting:
setenv. Write in SH file (the size can be modified according to your own situation): setenv The contents are as follows:
export CATALINA_OPTS="$CATALINA_OPTS -Xms30m"
export CATALINA_OPTS="$CATALINA_OPTS -XX:SurvivorRatio=8"
export CATALINA_OPTS="$CATALINA_OPTS-Xmx30m"
export CATALINA_OPTS="$CATALINA_OPTS -XX:+UseParallelGC"
export CATALINA_OPTS="$CATALINA_OPTS -XX:+PrintGCDetails"
export CATALINA_OPTS="$CATALINA_OPTS -XX:MetaspaceSize=64m"
export CATALINA_OPTS="$CATALINA_OPTS -XX:+PrintGCDateStamps"
export CATALINA_OPTS="$CATALINA_OPTS -Xloggc:/opt/tomcat8.5/logs/gc.log"
Print information
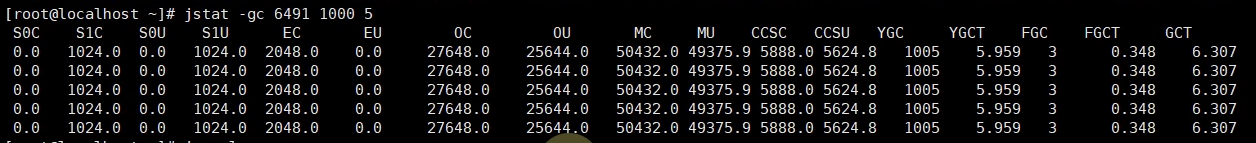
//View running process id
jps
//View operation information
jstat -gc process id Number of intervals (MS)
for example jstat -gc 5397 1000 5
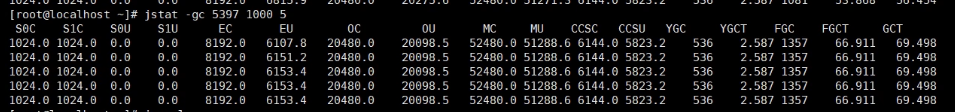
Optimization parameters (memory adjustment)
export CATALINA_OPTS="$CATALINA_OPTS -xms120m"
export CATALINA_OPTS="$CATALINA_OPTS -XX:SurvivorRatio=8"
export CATALINA_OPTS="$CATALINA_OPTS -Xmx120m"
export CATALINA_OPTS="$CATALINA_OPTS -XX:+UseParallelGC"
export CATALINA_OPTS="$CATALINA_OPTS -XX:+PrintGCDetails"
export CATALINA_OPTS="$CATALINA_OPTS -XX:MetaspaceSize=64m"
export CATALINA_OPTS="$CATALINA_OPTS -XX:+PrintGCDateStamps"
export CATALINA_OPTS="$CATALINA_OPTS -Xloggc:/opt/tomcat8.5/logs/gc.log"
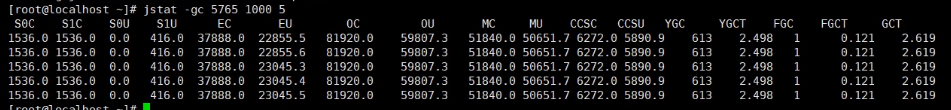
Results: the number of FullGC decreased significantly
4.2 optimization of JIT compiler
- Escape analysis: the new object in the current method is used outside the current method
- On stack allocation
- Convert heap allocation to stack allocation. If it is found after escape analysis that an object has no escape method, it may be optimized to be allocated on the stack. This eliminates the need to allocate memory on the heap and garbage collection. It can reduce garbage collection time and times.
- According to the results of escape analysis during compilation, JIT compiler finds that if an object does not escape from the method, it may be optimized to be allocated on the stack. After the allocation is completed, it continues to execute in the call stack. Finally, the thread ends, the stack space is recycled, and the local variable object is also recycled. This eliminates the need for garbage collection.
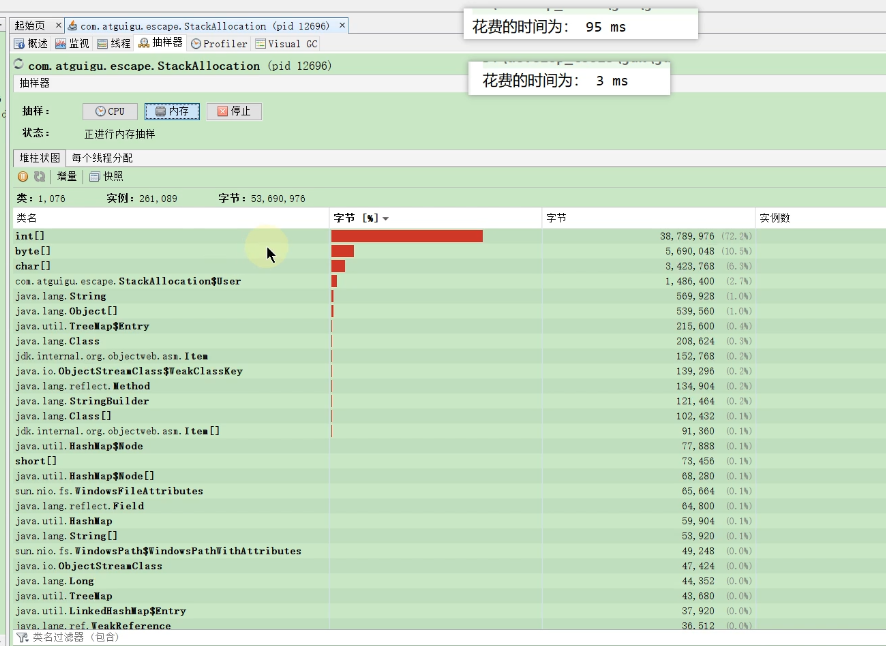
4.2.1 allocation test on the stack (instead of allocating objects, it is reflected by variable replacement)
/**
 * On stack allocation test
 * -Xmx1G -Xms1G -XX:-DoEscapeAnalysis -XX:+PrintGCDetails
 *
 * As long as escape analysis is enabled, it will judge whether the variables in the method have escaped. If no escape occurs, on stack allocation is used
 */
public class StackAllocation {
    public static void main(String[] args) {
        long start = System.currentTimeMillis();

        for (int i = 0; i < 10000000; i++) {
            alloc();
        }
        // View execution time
        long end = System.currentTimeMillis();
        System.out.println("Time spent: " + (end - start) + " ms");
        // To view the number of objects in heap memory, thread sleep
        try {
            Thread.sleep(1000000);
        } catch (InterruptedException e1) {
            e1.printStackTrace();
        }
    }

    private static void alloc() {
        User user = new User();//Did you escape? No,
    }

    static class User {

    }
}
After jdk6, the allocation on the stack is enabled by default, and the test needs to be closed
-XX:-DoEscapeAnalysis
Turn off the on stack allocation test (objects will be allocated in heap memory)
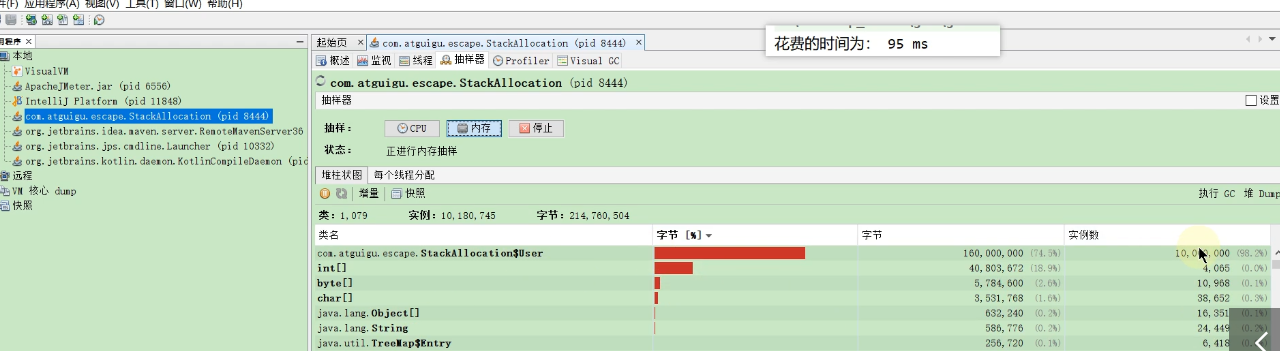
Enable on stack allocation test
4.2.2 synchronous elimination
Synchronous elimination. If an object is found to be accessible only from one thread, synchronization may not be considered for the operation of this object.
- The cost of thread synchronization is quite high, and the consequence of synchronization is to reduce concurrency and performance.
- When dynamically compiling a synchronization block, the JIT compiler can use escape analysis to determine whether the lock object used by the synchronization block can only be accessed by one thread and not published to other threads. If not, the JIT compiler will cancel the synchronization of this part of the code when compiling the synchronization block. This can greatly improve concurrency and performance. The process of canceling synchronization is called synchronization omission, also known as lock elimination.
public class SynchronizedTest {
    public void f() {
        /*
        * The hollis object is locked in the code, but the life cycle of the hollis object is only in the f() method,
        * It will not be accessed by other threads, so it will be optimized during JIT compilation.
        *
        * Question: will hollis be removed from bytecode files?
        * No, because only the interpreter, not the JIT compiler
        * */
        Object hollis = new Object();
        synchronized(hollis) {
            System.out.println(hollis);
        }

        /*
        * After optimization;
        * Object hollis = new Object();
        * System.out.println(hollis);
        * */
    }
}
4.2.3 scalar substitution
Scalar refers to data that cannot be decomposed into smaller data. The original data type in Java is scalar
In contrast, the data that can be decomposed is called aggregate. The object in Java is aggregate because it can be decomposed into other aggregates and scalars.
In the JIT stage, if it is found that an object will not be accessed by the outside world through escape analysis, then after JIT optimization, the object will be disassembled into several member variables. This process is scalar substitution.
Parameter setting (on by default): true
-XX:+EliminateAllocations:
Code embodiment:
public static void main (string [ ] args){
	alloc ( ) ;
}
private static void alloc (){
	Point point = new Point ( 1,2);
	system.out.println ( "point.x="+point.x+"; point.y="+point.y);
}
class Point {
	private int x;
	private int y;
	After scalar replacement, the above code will become:private static void alloc() {
	int x = l;I
	int y = 2;
	System.out.println ( "point.x="+x+"; point.y="+y);
}
Test code
/**
 * Scalar substitution test
 *  -Xmx100m -Xms100m -XX:+DoEscapeAnalysis -XX:+PrintGCDetails -XX:-EliminateAllocations
 *
 *  In fact, the conclusion of optimizing the allocation of scalar objects in the Java stack lies in the analysis of scalar escape points.
 *
 * @author shkstart  shkstart@126.com
 * @create 2021  12:01
 */
public class ScalarReplace {
    public static class User {
        public int id;
        public String name;
    }

    public static void alloc() {
        User u = new User();//No escape occurred
        u.id = 5;
        u.name = "www.atguigu.com";
    }

    public static void main(String[] args) {
        long start = System.currentTimeMillis();
        for (int i = 0; i < 10000000; i++) {
            alloc();
        }
        long end = System.currentTimeMillis();
        System.out.println("Time spent: " + (end - start) + " ms");

    }
}
Summary of escape analysis:
- The paper on escape analysis was published in 1999, but it was not realized until DK 1.6, and this technology is not very mature until now.
- The fundamental reason is that the performance consumption of non escape analysis can not be guaranteed to be higher than its consumption. Although after escape analysis, scalar substitution, on stack allocation, and lock elimination can be done. However, escape analysis itself also needs a series of complex analysis, which is actually a relatively time-consuming process.
- An extreme example is that after escape analysis, it is found that no object does not escape. Then the process of escape analysis is wasted.
- Although this technology is not very mature, it is also a very important means of real-time compiler optimization technology.
- Note that there are some views that the JVM will allocate those objects that will not escape on the stack through escape analysis, which is theoretically feasible, but it depends on the choice of the JVM designer.
- At present, many books are still based on previous versions of JDK7. Great changes have taken place in JDK, including inter string caching and static variables
- They were once assigned to the permanent generation, which has been replaced by the metadata area. However, the intern string cache and static variables are not transferred to the metadata area, but allocated directly on the heap, so this is also consistent with the previous conclusion: object instances are allocated on the heap.
4.3 rational allocation of heap memory
4.3.1 parameter setting
- For the whole heap size of Java, Xmx and Xms are set to 3-4 times of the surviving objects of the older generation, that is, 3-4 times of the memory occupied by the older generation after FullGC.
- The method area (PermSize and MaxPermSize of permanent generation or MetaspaceSize and MaxMetaspaceSize of meta space) is set to 1.2-1.5 times of the surviving objects of the elderly generation.
- The setting of Xmn in the younger generation is 1-1.5 times that of the surviving objects in the older generation.
4.3.2 calculation of survival size in old age
- Add a GC log to the JVM parameters. The GC log will record the memory size of each generation after each FullGC, and observe the space size of the older generation after GC. The memory condition after FullGC can be observed for a period of time (e.g. 2 days), and the surviving object size of the old age after FullGC can be estimated according to the space size data of the old age after multiple fullgcs (the average value can be taken according to the memory size after multiple fullgcs)
Method of forcibly triggering Full GC
1,jmap -dump:live,format=b,file=heap.bin dumps the current surviving object to a file, and FullGc will be triggered
2. jmap -histo:live print the number of instances of each class, memory usage, and full class name information When the live sub parameter is added, only the number of live objects is counted FullGd is triggered
3. In the performance test environment, you can trigger FullGC through Java monitoring tools, such as using VisualVM and 3console. VisualVM integrates JConsole. There is a button to trigger GC on VisualVM or JConsole.
Estimate GC frequency
For example, if a piece of data from the database takes 128 bytes and 1000 pieces of data need to be obtained, the size of the memory read at one time is 128 B/1024 Kb/1024M) * 1000 = 0.122M, then our program may need to read concurrently. For example, if we read 100 times per second, the memory usage is 0.122100 = 12.2M. If the heap memory is set to 1 G, the size of the younger generation is about 333M, Then 333M80%/12.2M =21.84s, that is, our program performs youngGC almost twice or three times per minute.
4.4 adjust ParallelGC proportion
ParallelGC defaults to 6:1:1
Adjust parameter settings
- -XX:+SusvivorRatio:8
- -20: + useadaptive policy
Note: for external systems with large flow and low delay, it is not recommended to enable this parameter. It is recommended to turn it off.
4.5 troubleshooting scheme for high CPU consumption
1. ps aux / grep java checks the cpu, memory and disk usage of the current java process, and obtains the processes with abnormal usage
2. top -Hp process pid check the pid of the currently used exception thread
3. Change the thread pid to hexadecimal, such as 31695 - "7bcf", and then get Ox7bcf
4. View information (2 ways)
- 1. The pid l grep -A20 Ox7bcf of jstack + process gets the code of the relevant process
- 2. Print the information into the file jstack PID > file name
4.6impact of the number of concurrent execution threads of G1 thread on Performance
Test parameter setting
export CATALINA_OPTS="$CATALINA_OPTS -XX:+UseG1GC"
export CATALINA_OPTS="$CATALINA_OPTS -xms 30m"
export CATALINA_OPTS="$CATALINA_OPTS -xm×30m"
export CATALINA_OPTS="$CATALINA_OPTS -XX:+PrintGCDetails"
export CATALINA_OPTS="$CATALINA_OPTS -XX:MetaspaceSize=64m"
export CATALINA_OPTS="$CATALINA_OPTS -XX:+PrintGCDateStamps"
export CATALINA_OPTS="$CATALINA_OPTS -Xloggc :/opt/tomcat8.5/logs/gc.log"
export CATALINA_OPTS="$CATALINA_OPTS-XX:ConcGCThreads=1"
Increasing the number of threads will increase the throughput (- XX:ConcGCThreads is set to 2, which has the same effect as 4,8, because it is up to 1 / 4 of parallel garbage collection)
export CATALINA_OPTS="$CATALINA_OPTS -XX:+UseG1GC"
export CATALINA_OPTS="$CATALINA_OPTS -xms 30m"
export CATALINA_OPTS="$CATALINA_OPTS -xm×30m"
export CATALINA_OPTS="$CATALINA_OPTS -XX:+PrintGCDetails"
export CATALINA_OPTS="$CATALINA_OPTS -XX:MetaspaceSize=64m"
export CATALINA_OPTS="$CATALINA_OPTS -XX:+PrintGCDateStamps"
export CATALINA_OPTS="$CATALINA_OPTS -Xloggc :/opt/tomcat8.5/logs/gc.log"
export CATALINA_OPTS="$CATALINA_OPTS -XX:ConcGCThreads=2"
4.7 impact of adjusting garbage collector on improving server performance
Use the garbage collector reasonably according to the cpu and performance of the server
How to set JVM parameters for a 4.8 million level trading system
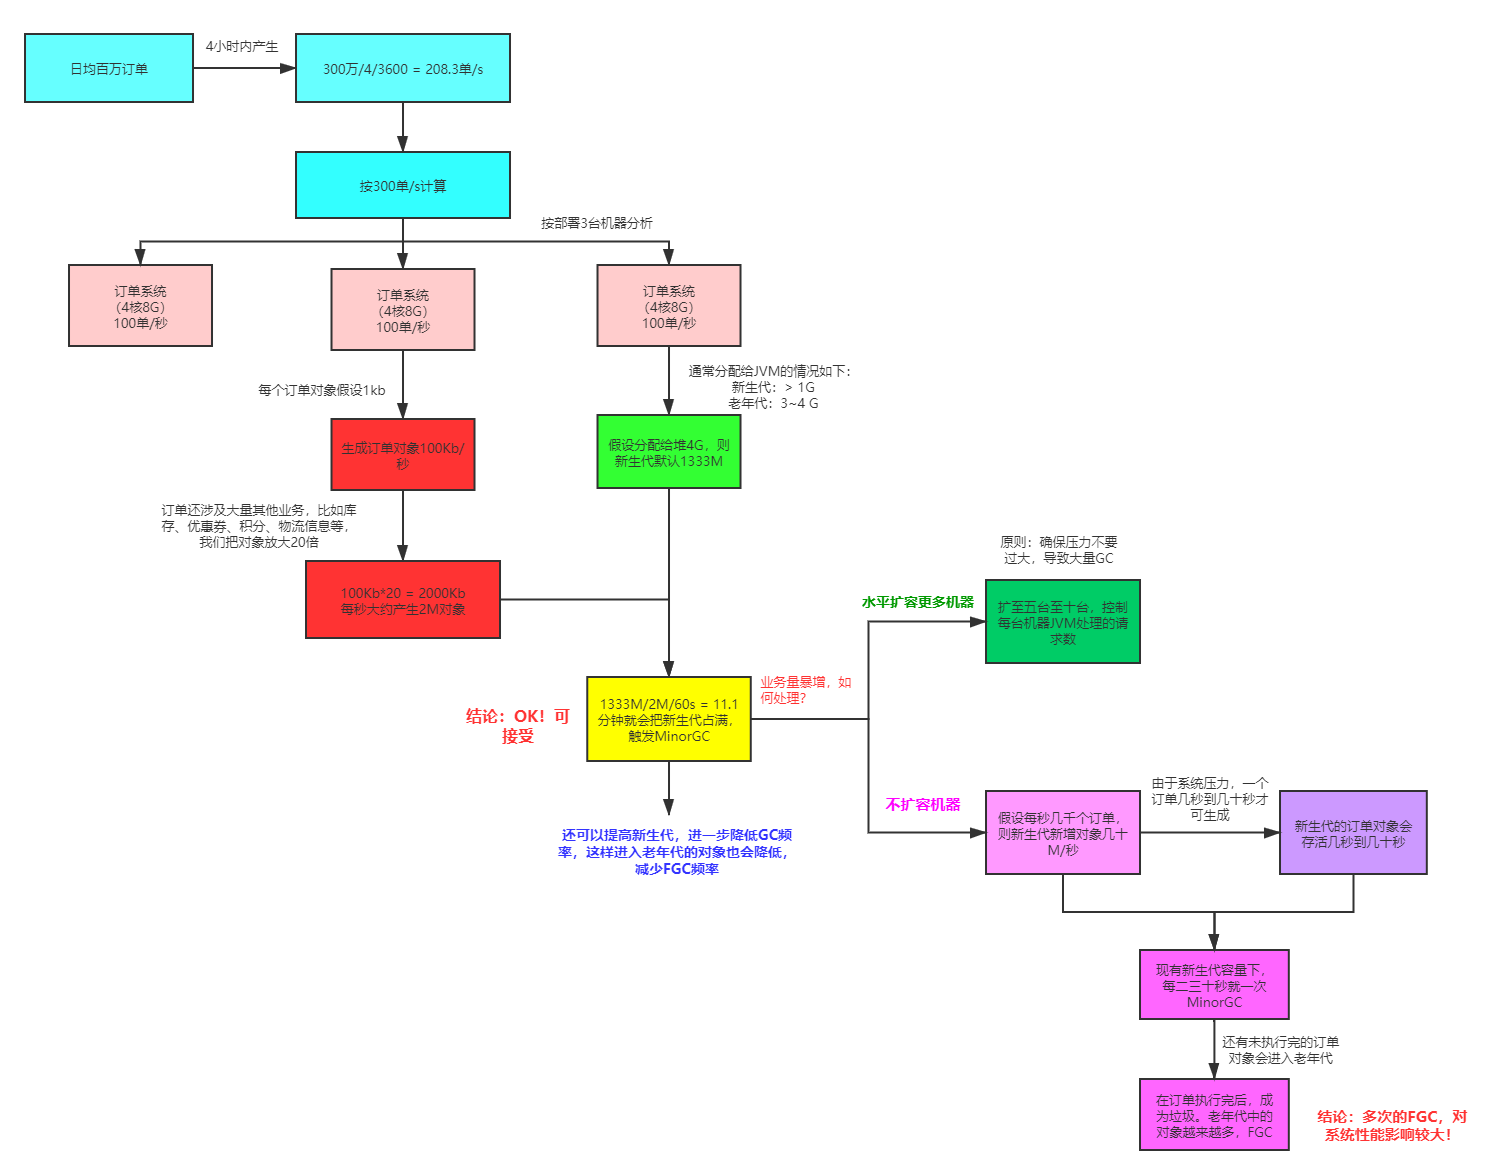
How to ensure that the response time is controlled within 100ms?
Pressure measurement control delay time