JVM01 - JVM Memory Structure
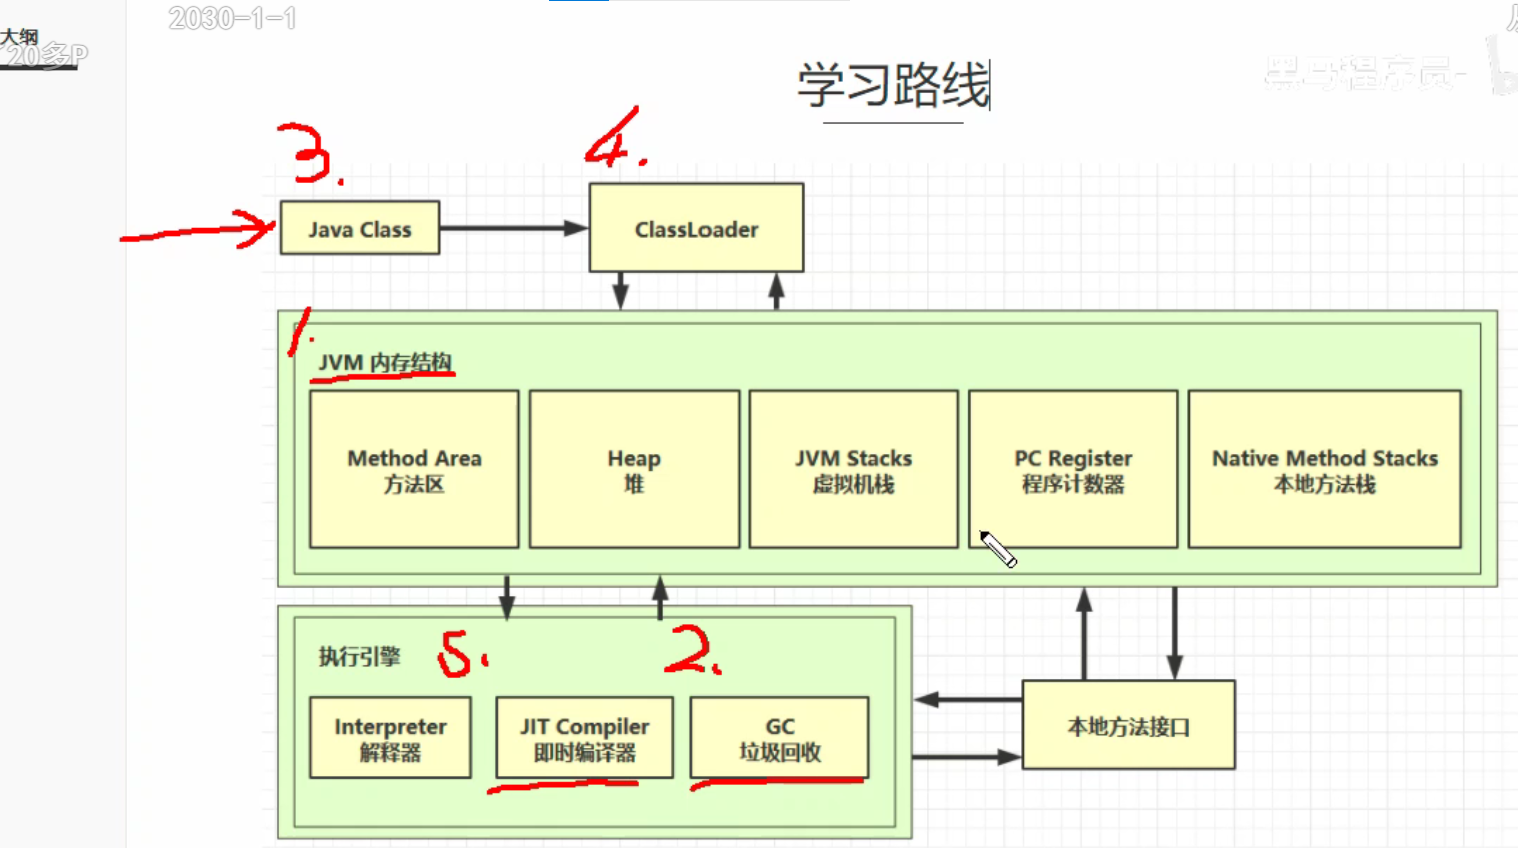
1.JVM Learning Route
2. Program counters
Effect:
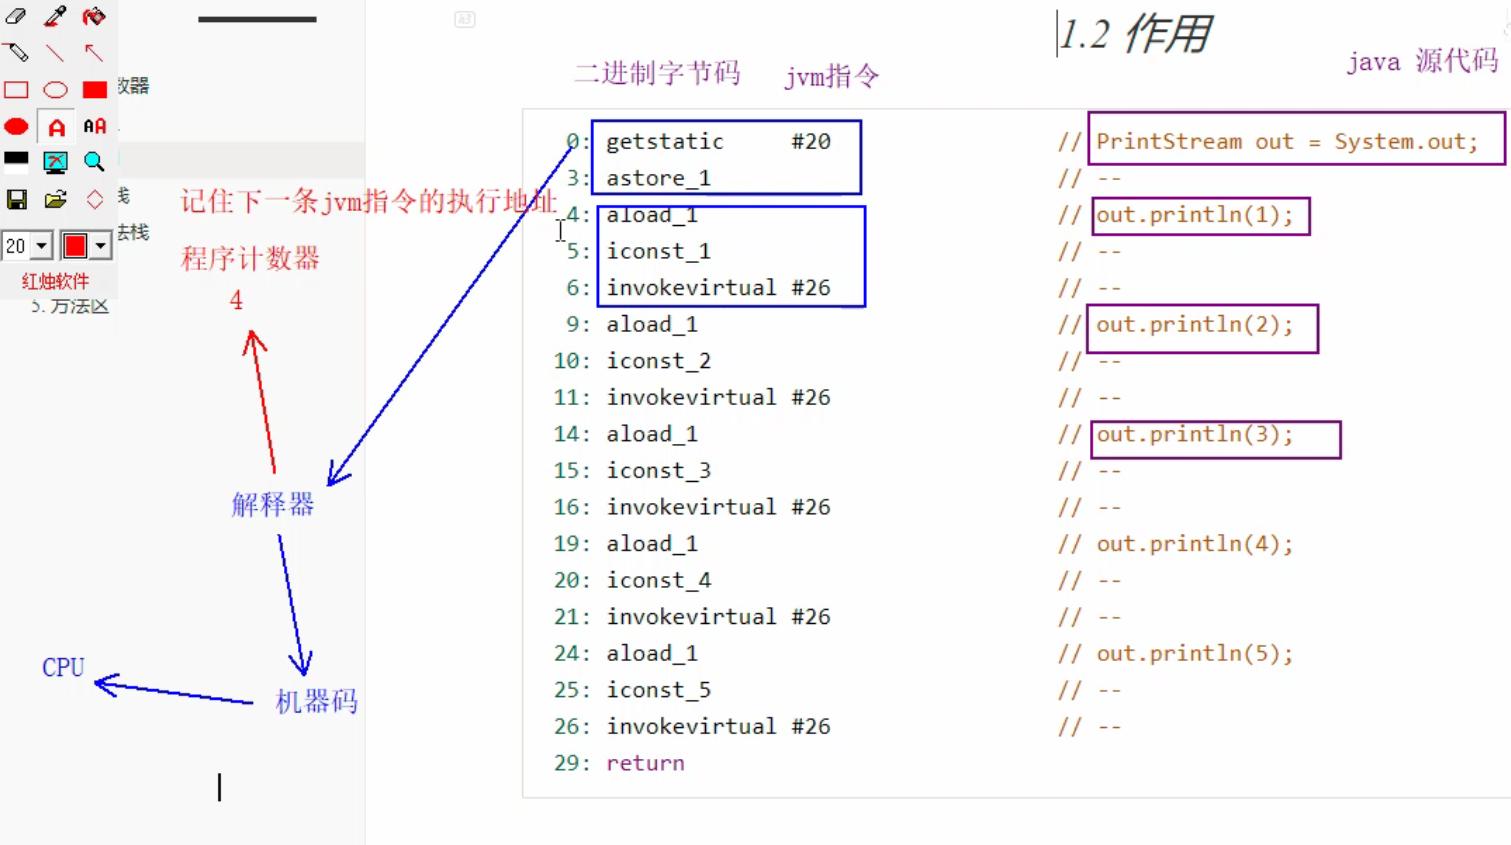
The process from the java code in the computer to the execution is: source code to byte code, binary byte code to jvm instruction, handed to the interpreter, the interpreter to machine code, executed by the CPU. Just like this, the jvm instruction is executed one by one, but java is multi-threaded. If the thread loses the cpu, how does the interpreter know the next instruction to execute after retrieving the cpu?After the jvm instructions are delivered to the interpreter, jvm does one more thing: it moves the program counter to the next instruction to be executed. The function of the program counter is to remember the address of the next jvm instruction to be executed so that the interpreter knows where the next instruction to be taken is.
Characteristic:
Threads are private, and each thread has its own program counter.
There will be no memory overflow.
3. Stack
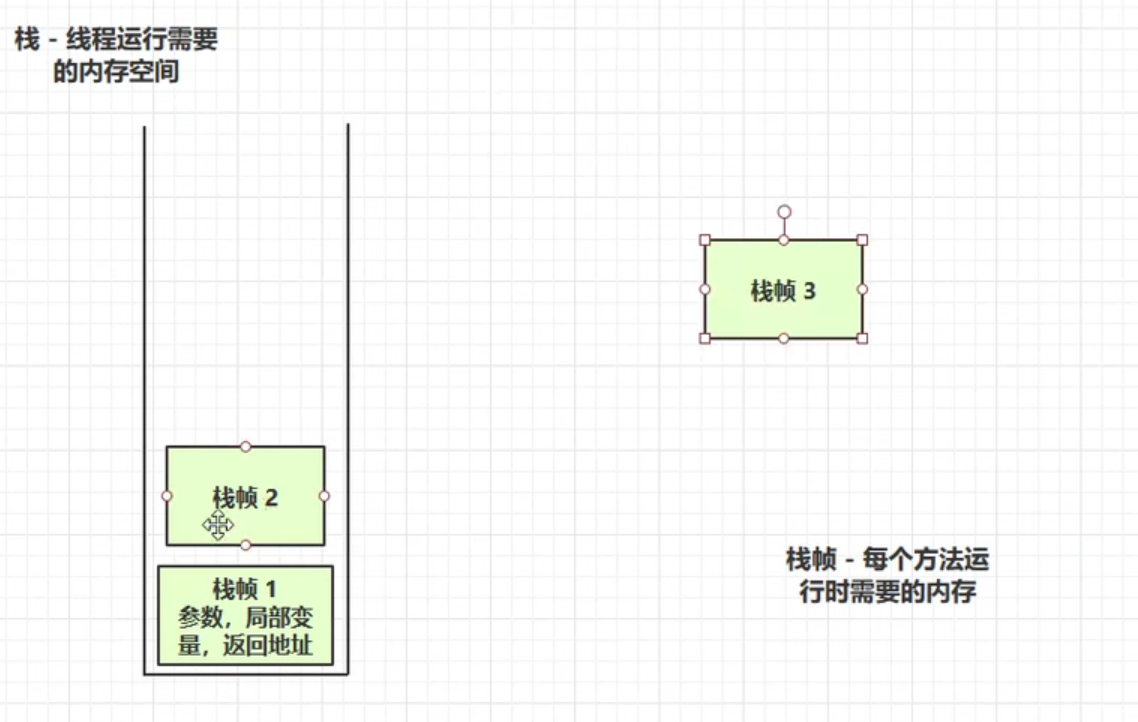
Stack: The memory space required by a thread to run, stack frame: The memory required by each method to run. Only one active stack frame per thread can correspond to the currently executing method.
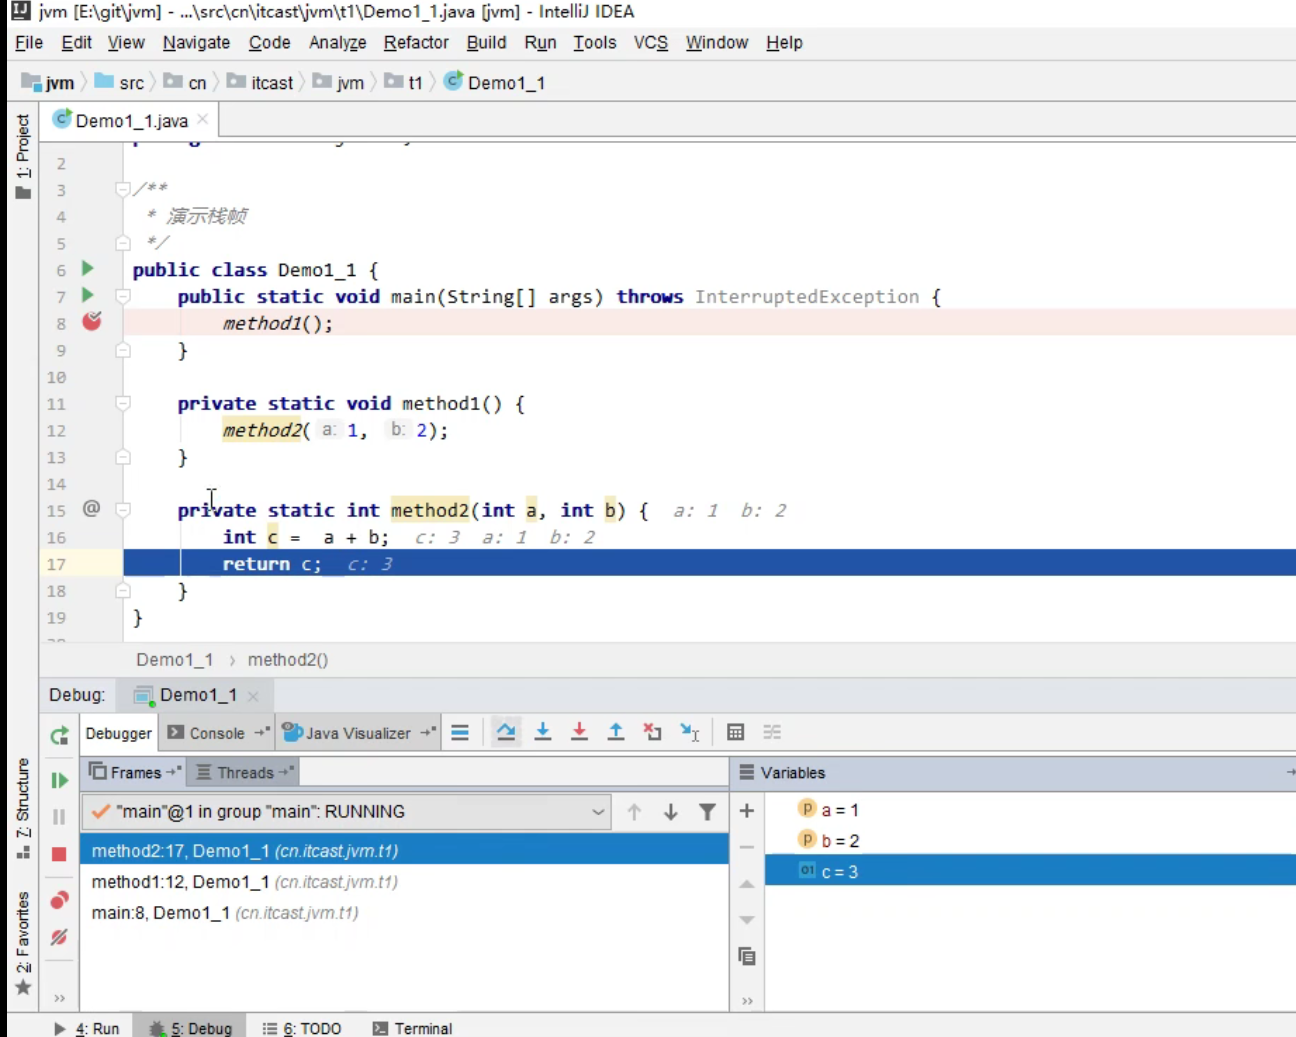
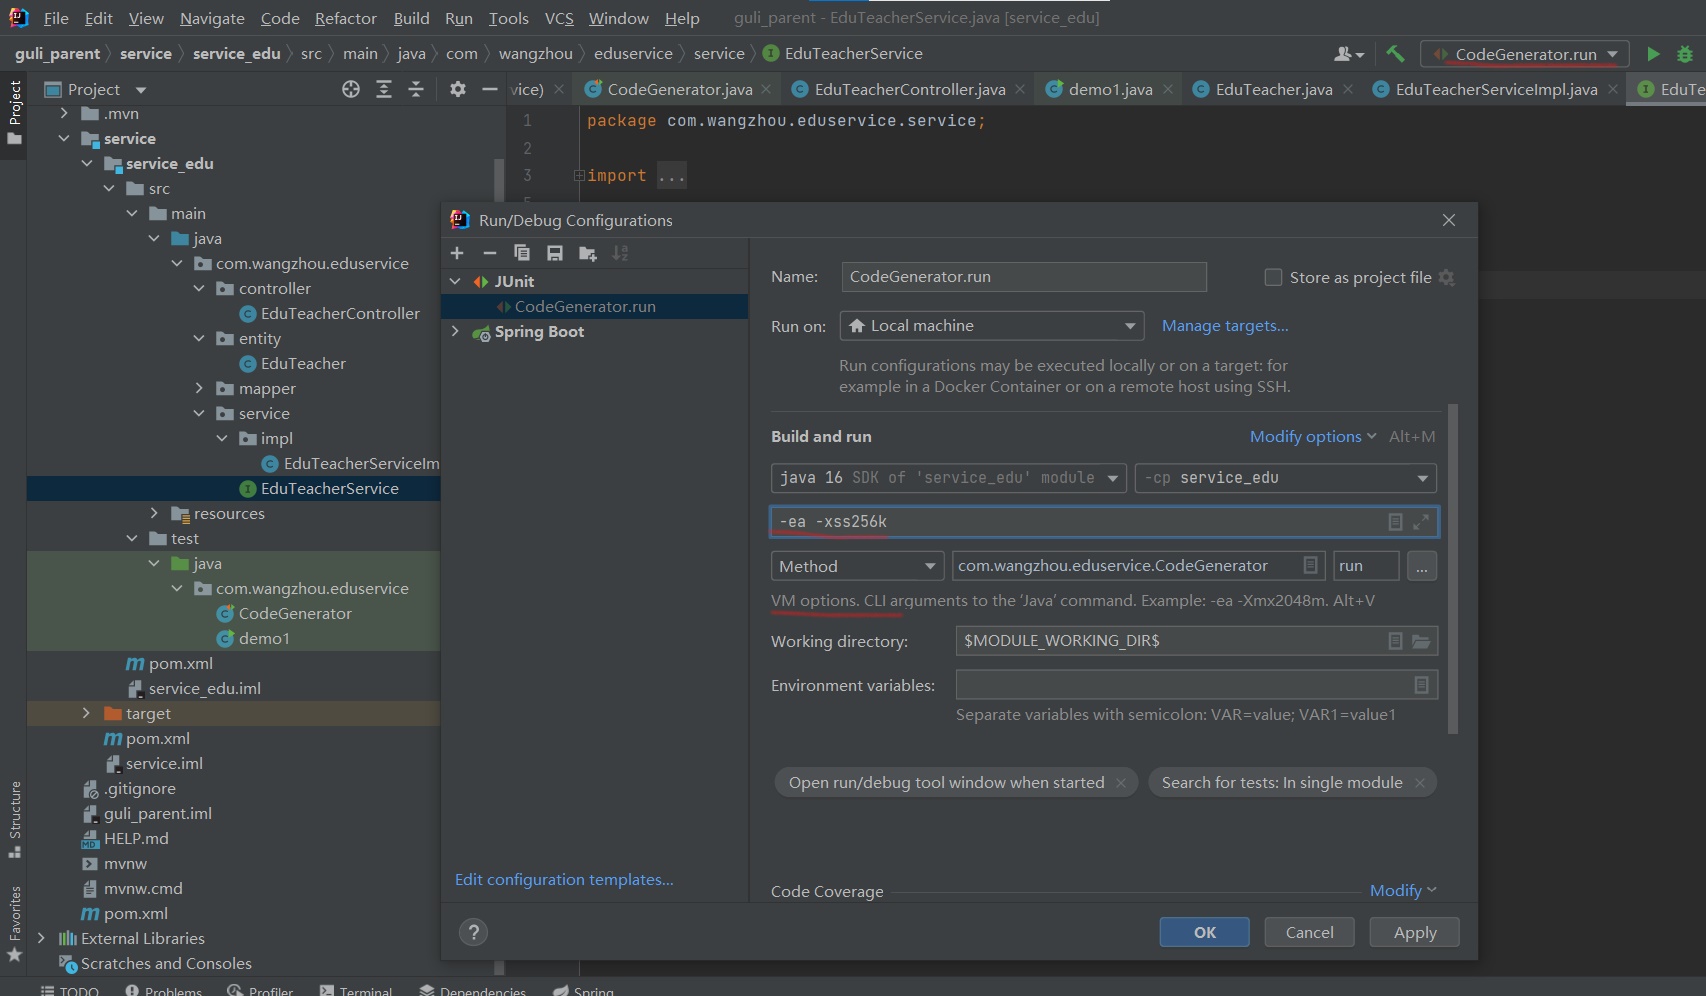
Use idea to debug for virtual machine stack information.
Garbage collection does not involve stack memory, because the stack frame of the stack goes on the stack with method calls and exits the stack with the end of the method without garbage collection.
The size of the stack can be set, and the larger the thread stack, the more method levels that can be nested calls, but it needs to be within a reasonable range, not the larger. Because the physical memory of the computer is limited, the larger the stack size in a thread, the fewer threads can be accommodated (each thread has its own stack).
Local variables are private variables in the method stack. Are local variables within a method necessarily thread-safe?
-
Local variables within a method are safe if they do not escape the scope of the method.
-
It is safe if it is a basic data type.
-
Threads are insecure if object type data is present and methods are escaped. Reference code demo1, addresses stored in variables in different thread stacks do not interfere with each other, but the value of the same address can be modified by different threads.
public class demo1 {
    public static void main(String[] args) {
        StringBuilder sb = new StringBuilder();
        new Thread(()->
                m2(sb)
        ).start();
        sb.append(1);
        sb.append(2);
    }

    public static StringBuilder m2(StringBuilder sb) {
        sb.append(1);
        sb.append(2);
        return sb;
    }
}
Causes stack memory overflow:
- Too many stacked frames, such as too many method recursions.
- The stack frame is too large, which rarely occurs.
It is worth noting that sometimes it is not the code we write that causes the stack to overflow, but the misuse of code from third-party libraries that causes the overflow.
cpu occupies a lot.
The following is an analysis of two stack-related cases.
-
cpu usage is too high
top can be used under linux to show how the CPU is occupied by the process. After locating a process that occupies too much cpu, use PS H-eo PID TID%cpu | grep XXXX (process id) to see which thread is causing the problem. Finally use jstack XXX (process id)Look at the ID corresponding to all threads in the process and the number of lines of source code causing the problem. Note that using the second step, the thread number is decimal, and the thread number in the jstack is 16, requiring the necessary binary conversion.
-
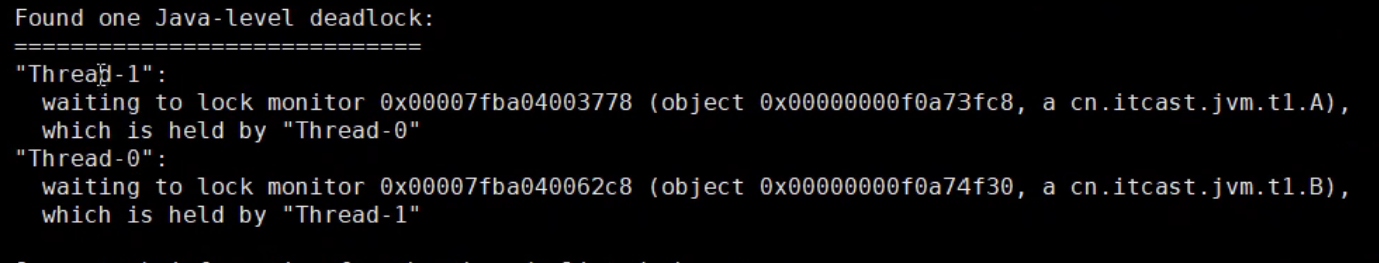
Threads delayed getting results
Still using jstack to locate the problem, you can locate information similar to the one shown below.
Local methods refer to methods written in non-java languages that interact with the underlying functionality of the operating system. Local method stacks are used to provide memory space for local methods.
4. Heap
Features of 4.1 Heap
Objects created with the new keyword use the heap.
Characteristic:
- Thread sharing, objects in the heap need to consider thread security issues.
- It has a garbage collection mechanism.
4.2 Memory Overflow
public class MemoryOverFlow {
    public static void main(String[] args) {
        int i = 0;
        String a = "hello";
        List list = new ArrayList();
        try {
            while (true) {
                list.add(a);
                a = a + a;
                i++;
            }
        } catch (Throwable e) { //With Throwable, if Error cannot be packaged with Exception, i cannot be printed
           e.printStackTrace();
           System.out.println(i);
        }

    }
}
OutOfMemoryError appears
java.lang.OutOfMemoryError: Overflow: String length out of range
        at java.base/java.lang.StringConcatHelper.checkOverflow(StringConcatHelper.java:57)
        at java.base/java.lang.StringConcatHelper.mix(StringConcatHelper.java:138)
        at java.base/java.lang.StringConcatHelper.simpleConcat(StringConcatHelper.java:420)
        at MemoryOverFlow.main(MemoryOverFlow.java:12)
28
Additionally, the parameter-Xmx can set the jvm memory size, which can be set to a smaller size (such as 8m) when troubleshooting heap memory problems, making it easier to expose memory overflow problems.
4.3 Heap Memory Problem Diagnosis
1.jps See what java processes are on the system
2.jmap View heap memory usage at a given time
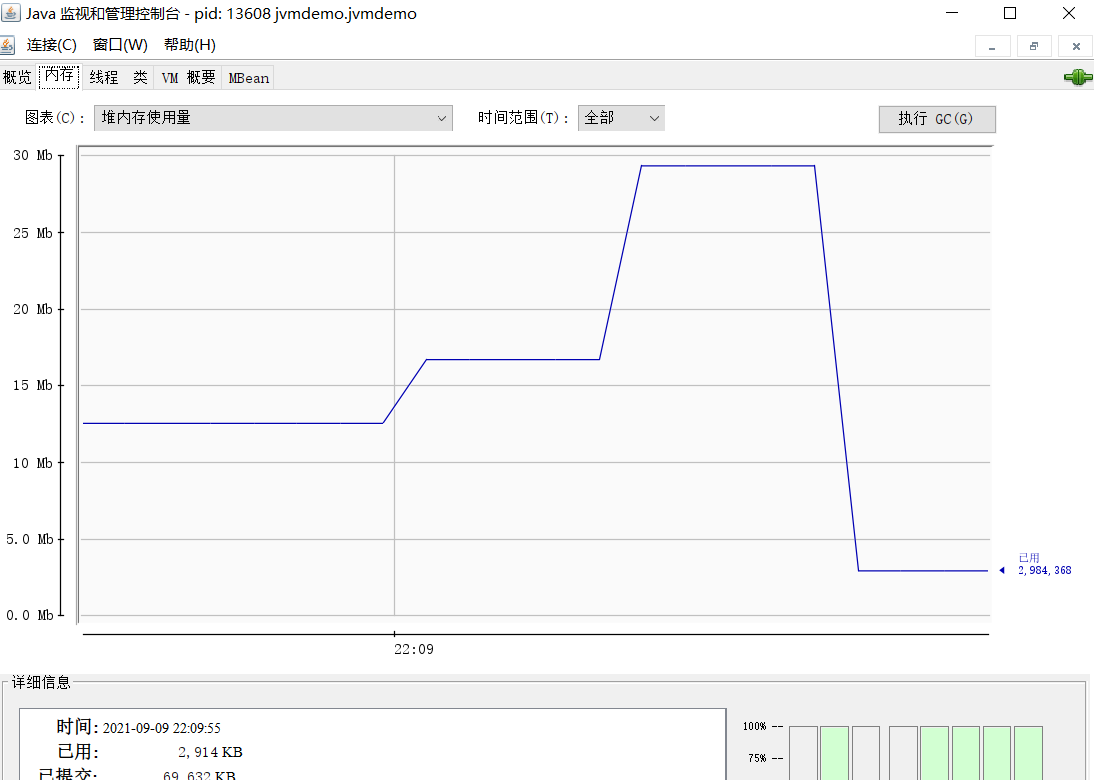
3.jconsole Multifunctional Real-Time Monitoring Tool
demo below to demonstrate heap problem diagnosis.
public class jvmdemo {
	public static void main(String[] args) throws InterruptedException {
        System.out.println("1....."); //Output prompt for Heap Dump
        Thread.sleep(60000); //Give 30s time to Heap Dump
        byte [] arr = new byte[1024 * 1024 * 10];
        System.out.println("2.......");
        Thread.sleep(60000);
        arr = null;
        System.gc();
        System.out.println("3......");
        Thread.sleep(100000L);
	}

}
When output 1..., first execute jps to see the corresponding PID of jvmdemo, then execute jmap-heap XXX (pid) to see the heap memory usage at this time. Error reported.
Error: -heap option used
Cannot connect to core dump or remote debug server. Use jhsdb jmap instead
The jmap-heap XXX (pid) command that preceded the version after jdk8 is no longer available. Use the command jhsdb jmap --heap --pid xxx. After prompting for information output, three operations are performed to get the following results.
Heap Usage:
G1 Heap:
   regions  = 2034
   capacity = 8531214336 (8136.0MB)
   used     = 0 (0.0MB)
   free     = 8531214336 (8136.0MB)
   0.0% used
G1 Young Generation:
Eden Space:
   regions  = 0
   capacity = 29360128 (28.0MB)
   used     = 0 (0.0MB)
   free     = 29360128 (28.0MB)
   0.0% used
Survivor Space:
   regions  = 0
   capacity = 0 (0.0MB)
   used     = 0 (0.0MB)
   free     = 0 (0.0MB)
   0.0% used
G1 Old Generation:
   regions  = 0
   capacity = 507510784 (484.0MB)
   used     = 0 (0.0MB)
   free     = 507510784 (484.0MB)
   0.0% used
Heap Usage:
G1 Heap:
   regions  = 2034
   capacity = 8531214336 (8136.0MB)
   used     = 12582912 (12.0MB)
   free     = 8518631424 (8124.0MB)
   0.14749262536873156% used
G1 Young Generation:
Eden Space:
   regions  = 0
   capacity = 29360128 (28.0MB)
   used     = 0 (0.0MB)
   free     = 29360128 (28.0MB)
   0.0% used
Survivor Space:
   regions  = 0
   capacity = 0 (0.0MB)
   used     = 0 (0.0MB)
   free     = 0 (0.0MB)
   0.0% used
G1 Old Generation:
   regions  = 3
   capacity = 507510784 (484.0MB)
   used     = 12582912 (12.0MB)
   free     = 494927872 (472.0MB)
   2.479338842975207% used
Heap Usage:
G1 Heap:
   regions  = 2034
   capacity = 8531214336 (8136.0MB)
   used     = 673872 (0.6426544189453125MB)
   free     = 8530540464 (8135.357345581055MB)
   0.007898898954588403% used
G1 Young Generation:
Eden Space:
   regions  = 0
   capacity = 8388608 (8.0MB)
   used     = 0 (0.0MB)
   free     = 8388608 (8.0MB)
   0.0% used
Survivor Space:
   regions  = 0
   capacity = 0 (0.0MB)
   used     = 0 (0.0MB)
   free     = 0 (0.0MB)
   0.0% used
G1 Old Generation:
   regions  = 1
   capacity = 8388608 (8.0MB)
   used     = 673872 (0.6426544189453125MB)
   free     = 7714736 (7.3573455810546875MB)
   8.033180236816406% used
Focus on the uesd item, where the JVM version is 16.0.2+7-67 and may vary slightly between versions.
jconsole allows real-time observations of data.
Case study: Memory usage is still high after multiple garbage collections.
jvisualvm is also a visualization tool that works better than jconsole. It is no longer automatically integrated in higher versions of JDK (version 1.8 or later updates). Refer to the blog to download a stand-alone version: JDK High Version No VisualVM_Eastern Custody Blog-CSDN Blog.
Now the GC is executed using jvisualvm, but memory is not much reduced.
Make Heap Dump and sort the class es by the size of memory they occupy.
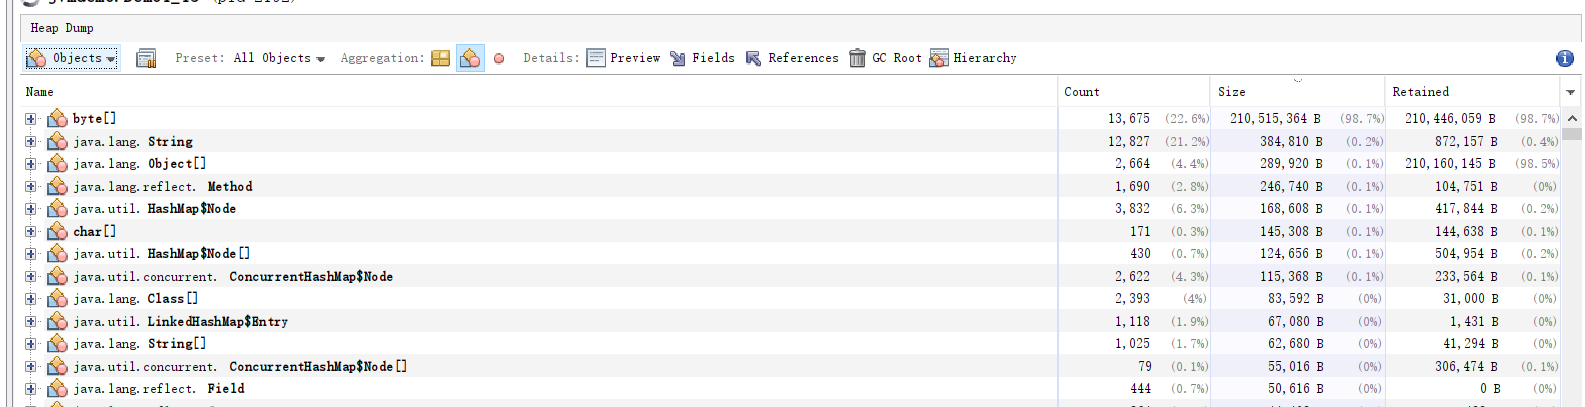
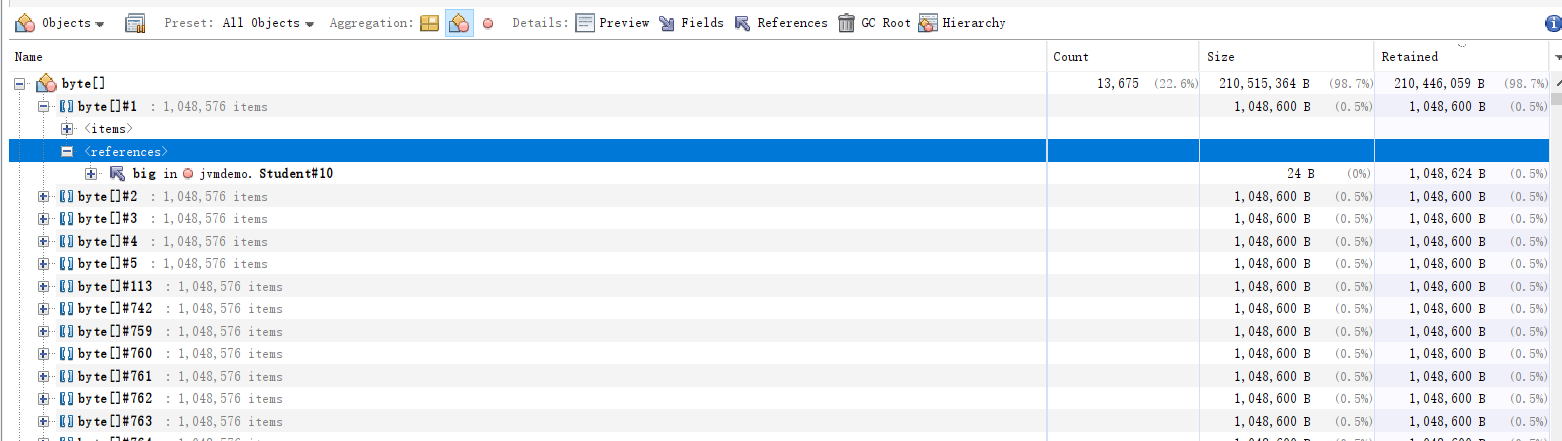
A pot of byte [] class was found, which accounts for 210 M of memory. Point in. A particularly large number of byte [] instances (13675) were found, resulting in a particularly large memory footprint (210M). You can also see that this byte [] field is referenced by objects of the Student class and the variable name is big.
Then locate the corresponding source code.
/**
 * Demonstrate viewing object count heap dump
 */
public class Demo1_13 {

    public static void main(String[] args) throws InterruptedException {
        List<Student> students = new ArrayList<>();
        for (int i = 0; i < 200; i++) {
            students.add(new Student());
//            Student student = new Student();
        }
        Thread.sleep(1000000000L);
    }
}
class Student {
    private byte[] big = new byte[1024*1024];
}
Sure enough, we have 200 Student objects and 200 big instances with a memory footprint of 1M.
5. Method Area
5.1 Definition
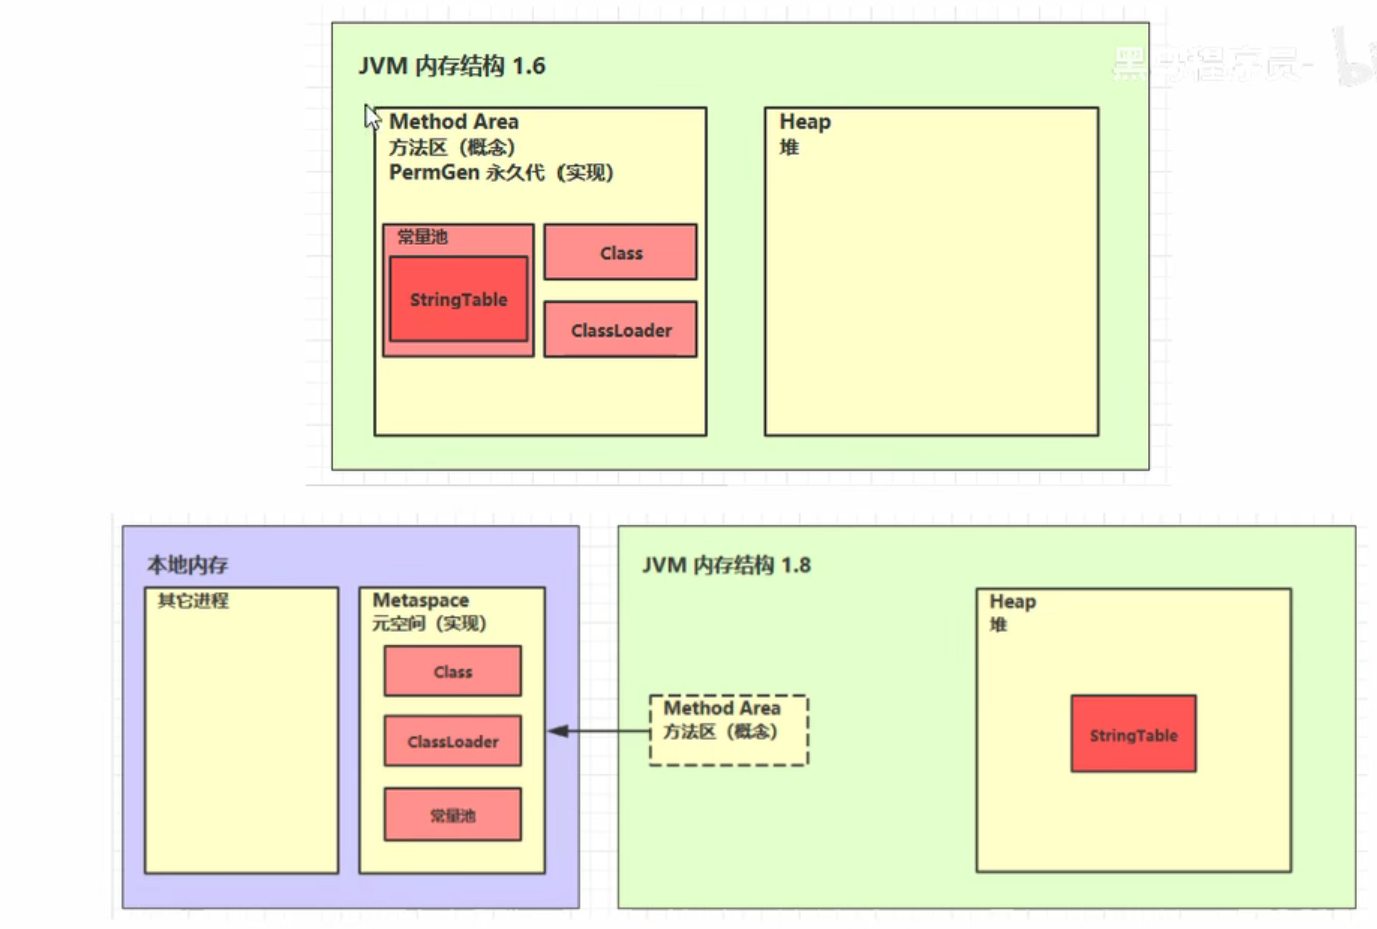
Shared area, the organizational structure (member variables, methods, constructor code), constant pool, class loader that primarily stores classes. Method area is created at virtual machine startup. Logically belongs to heap (specific manufacturer implementations do not necessarily fall into heaps)Prior to jdk1.8, the method area was in the permanent generation of the jvm, and strings were stored in the constant pool. After jdk1.8, the method area was in the Metaspace of local memory, and strings were in the heap. Refer to the figure below.
5.2 Method Area Memory Overflow
The code below demonstrates memory overflow within a method area.
public class Demo1_8 extends ClassLoader { // Binary byte codes that can be used to load classes
    public static void main(String[] args) {
        int j = 0;
        try {
            Demo1_8 test = new Demo1_8();
            for (int i = 0; i < 10000; i++, j++) {
                // ClassWriter functions as a binary byte code for generating classes
                ClassWriter cw = new ClassWriter(0);
                // Version number, public, class name, package name, parent class, interface
                cw.visit(Opcodes.V1_8, Opcodes.ACC_PUBLIC, "Class" + i, null, "java/lang/Object", null);
                // Return byte[]
                byte[] code = cw.toByteArray();
                // Class loading performed
                test.defineClass("Class" + i, code, 0, code.length); // Class object
            }
        } finally {
            System.out.println(j);
        }
    }
}
Prior to jdk1.8, the permanent generation was set to 8m: -XX:MaxPermSize=10m. After jdk1.8, setting the Metaspace to 8m:-XX:MaxMetaspaceSize=8m will report OutOfMemoryError.
In the actual work scenario, frames such as spring and mybatis all use cglib to generate class es dynamically, so improper use of the framework may lead to memory overflow in the method area. However, after jdk1.8, the method area moved to metaspace, which has a lot of space, is also garbage collected from metaspace, and memory overflow may be reduced.
5.3 Constant Pool
Here is the code for a helloworld.
// Binary byte code (class base information, constant pool, class method definition, including virtual machine instructions)
public class HelloWorld {
    public static void main(String[] args) {
        System.out.println("hello world");
    }
}
The computer will eventually convert this code into binary code, which contains the basic class information, class method definitions (including instructions), and constant pools. We switch to the directory where the corresponding class file is located in the out path and use the decompile command javap-v xxx.class to explore the contents of the binary code into readable code.
Classfile /F:/Data Decryption JVM/Code/jvm/out/production/jvm/cn/itcast/jvm/t5/helloworld.class
  Last modified 2021 9 September; size 567 bytes
  SHA-256 checksum 37204bf6e654f64ae56660a1e8becfaa98b3ae7592b81b4b6e331de92a460b96
  Compiled from "HelloWorld.java"
public class cn.itcast.jvm.t5.HelloWorld
  minor version: 0
  major version: 52
  flags: (0x0021) ACC_PUBLIC, ACC_SUPER
  this_class: #5                          // cn/itcast/jvm/t5/HelloWorld
  super_class: #6                         // java/lang/Object
  interfaces: 0, fields: 0, methods: 2, attributes: 1
Constant pool:
   #1 = Methodref          #6.#20         // java/lang/Object."<init>":()V
   #2 = Fieldref           #21.#22        // java/lang/System.out:Ljava/io/PrintStream;
   #3 = String             #23            // hello world
   #4 = Methodref          #24.#25        // java/io/PrintStream.println:(Ljava/lang/String;)V
   #5 = Class              #26            // cn/itcast/jvm/t5/HelloWorld
   #6 = Class              #27            // java/lang/Object
   #7 = Utf8               <init>
   #8 = Utf8               ()V
   #9 = Utf8               Code
  #10 = Utf8               LineNumberTable
  #11 = Utf8               LocalVariableTable
  #12 = Utf8               this
  #13 = Utf8               Lcn/itcast/jvm/t5/HelloWorld;
  #14 = Utf8               main
  #15 = Utf8               ([Ljava/lang/String;)V
  #16 = Utf8               args
  #17 = Utf8               [Ljava/lang/String;
  #18 = Utf8               SourceFile
  #19 = Utf8               HelloWorld.java
  #20 = NameAndType        #7:#8          // "<init>":()V
  #21 = Class              #28            // java/lang/System
  #22 = NameAndType        #29:#30        // out:Ljava/io/PrintStream;
  #23 = Utf8               hello world
  #24 = Class              #31            // java/io/PrintStream
  #25 = NameAndType        #32:#33        // println:(Ljava/lang/String;)V
  #26 = Utf8               cn/itcast/jvm/t5/HelloWorld
  #27 = Utf8               java/lang/Object
  #28 = Utf8               java/lang/System
  #29 = Utf8               out
  #30 = Utf8               Ljava/io/PrintStream;
  #31 = Utf8               java/io/PrintStream
  #32 = Utf8               println
  #33 = Utf8               (Ljava/lang/String;)V
{
  public cn.itcast.jvm.t5.HelloWorld();
    descriptor: ()V
    flags: (0x0001) ACC_PUBLIC
    Code:
      stack=1, locals=1, args_size=1
         0: aload_0
         1: invokespecial #1                  // Method java/lang/Object."<init>":()V
         4: return
      LineNumberTable:
        line 4: 0
      LocalVariableTable:
        Start  Length  Slot  Name   Signature
            0       5     0  this   Lcn/itcast/jvm/t5/HelloWorld;

  public static void main(java.lang.String[]);
    descriptor: ([Ljava/lang/String;)V
    flags: (0x0009) ACC_PUBLIC, ACC_STATIC
    Code:
      stack=2, locals=1, args_size=1
         0: getstatic     #2                  // Field java/lang/System.out:Ljava/io/PrintStream;
         3: ldc           #3                  // String hello world
         5: invokevirtual #4                  // Method java/io/PrintStream.println:(Ljava/lang/String;)V
         8: return
      LineNumberTable:
        line 6: 0
        line 7: 8
      LocalVariableTable:
        Start  Length  Slot  Name   Signature
            0       9     0  args   [Ljava/lang/String;
}
SourceFile: "HelloWorld.java"
As mentioned above, a constant pool is a constant table. Notice that the method definition part, such as #2, corresponds to the constant of the Constant pool.
The constant pool is in the.Class file, and when the class is loaded, the contents of the constant pool are put into the runtime constant pool, where the symbolic address becomes the real address.
5.4 String table
Let's look at an interview question.
String s1 = "a";
String s2 = "b";
String s3 = "ab";
String s4 = s1 + s2;
String s5 = "a" + "b";

System.out.println(s3 == s4);
System.out.println(s3 == s4);
To answer this question, you need to understand the string table, first of all, decompile the following code.
public class Demo1_22 {
    public static void main(String[] args) {
        String s1 = "a"; // Lazy
        String s2 = "b";
        String s3 = "ab";
    }
}
Intercept part. You can see that the jvm takes String a from #2 and stores it in lot1 of the LocalVariableTable, similar to other strings.
 public static void main(java.lang.String[]);
    descriptor: ([Ljava/lang/String;)V
    flags: (0x0009) ACC_PUBLIC, ACC_STATIC
    Code:
      stack=1, locals=4, args_size=1
         0: ldc           #2                  // String a
         2: astore_1
         3: ldc           #3                  // String b
         5: astore_2
         6: ldc           #4                  // String ab
         8: astore_3
         9: return
      LineNumberTable:
        line 11: 0
        line 12: 3
        line 13: 6
        line 21: 9
      LocalVariableTable:
        Start  Length  Slot  Name   Signature
            0      10     0  args   [Ljava/lang/String;
            3       7     1    s1   Ljava/lang/String;
            6       4     2    s2   Ljava/lang/String;
            9       1     3    s3   Ljava/lang/String;
When the jvm starts, the contents of the constant pool are loaded into the runtime constant pool, but at this time a, b and a b are just symbols, not string objects. The string object "a" is created only when specific instructions are executed, such as 0: ldc #2. At the same time, the jvm goes to the String table[] to find out if there is "a"Note: String table[] is actually a hashtable structure and cannot be expanded.
Add s4 to your java code and decompile it.
String s4 = s1 + s2;
The decompilation results are as follows.
9: new           #5    // class java/lang/StringBuilder
12: dup
13: invokespecial #6   // Method java/lang/StringBuilder."<init>":()V
16: aload_1
17: invokevirtual #7   // Method java/lang/StringBuilder.append(Ljava/lang/String;)Ljava/lang/StringBuilder;
20: aload_2
21: invokevirtual #7   // Method java/lang/StringBuilder.append(Ljava/lang/String;)Ljava/lang/StringBuilder;
24: invokevirtual #8   // Method java/lang/StringBuilder.toString:()Ljava/lang/String;
27: astore        4
The above operations are equivalent.
new StringBuilder().append("a").append("b").toString()
The toString() method is implemented as new String("ab"), so s3 == s4 results in fasle.
System.out.println(s3 == s4); //false
Then we add s5 to the code.
String s5 = "a" + "b";
The decompilation results are as follows.
29: ldc           #4                  // String ab
31: astore        5
Originally, javac was compiled to help us optimize. It thought "a" and "b" were constants and the result could not be changed, so the result was determined to be ab directly at compile time. Moreover, since "ab" already exists in String table, no new string object will be created.
System.out.println(s3 == s4); //true
The intern() method can put string objects in the heap into a string, referring to the code below.
public class Demo1_23 {

    // String table["ab", "a", "b"]
    public static void main(String[] args) {

        String x = "ab";
        String s = new String("a") + new String("b");     // Heap new String ("a"), new String ("b") new String ("a b")
        String s2 = s.intern();//Attempts to put this string object into the string pool, if any it will not, if not, it will return the object in the string pool
        System.out.println( s2 == x);  //true, s2 and x are objects in the string pool
        System.out.println( s == x ); //false, s is an object in the heap, different from the object in the string pool
    }

}
In this case, x2 can successfully join the string pool, so the result is true.
String x2 = new String("c") + new String("d"); // new String("cd")
x2.intern();
String x1 = "cd";
System.out.println(x1 == x2);  //true
However, calling the intern() method in jdk1.6 will try to put the string into the string pool, if there is one, it will not, if not, copy a copy into the string pool, so the object in the string pool is not the same object as the object in the heap. The same code above returns false in jdk1.6 with x1 == x2.
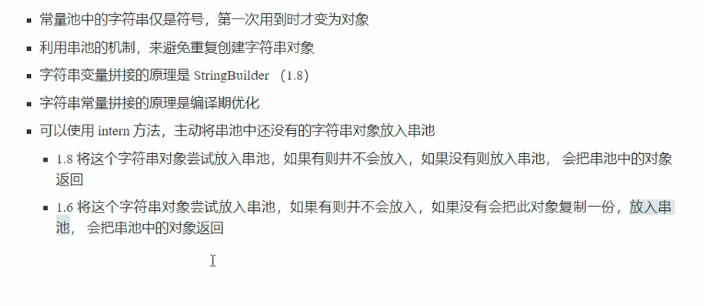
The characteristics of string pools are summarized below.
Location of 5.5 String table
At jdk1.6, string tables are placed in the constant pool, which is in the method area of the permanent generation. The permanent generation only recycles when full gc is triggered, which results in inefficient recycling of string tables. jdk1.7 moves string tables to the heap.
5.6 String table garbage collection
Refer to the following code configuration parameters and run.
/**
 * Demonstrate StringTable garbage collection
 * -Xmx10m -XX:+PrintStringTableStatistics -XX:+PrintGCDetails -verbose:gc
 */
public class Demo1_7 {
    public static void main(String[] args) throws InterruptedException {
        int i = 0;
        try {
            for (int j = 0; j < 100000; j++) { // j=100, j=10000
                String.valueOf(j).intern();
                i++;
            }
        } catch (Throwable e) {
            e.printStackTrace();
        } finally {
            System.out.println(i);
        }

    }
}
Print information as follows
[GC (Allocation Failure) [PSYoungGen: 2048K->488K(2560K)] 2048K->875K(9728K), 0.0028226 secs] [Times: user=0.02 sys=0.00, real=0.01 secs]
[GC (Allocation Failure) [PSYoungGen: 2536K->512K(2560K)] 2923K->958K(9728K), 0.0039494 secs] [Times: user=0.00 sys=0.00, real=0.00 secs]
[GC (Allocation Failure) [PSYoungGen: 2560K->512K(2560K)] 3006K->1006K(9728K), 0.0020900 secs] [Times: user=0.00 sys=0.00, real=0.00 secs]
...
StringTable statistics:
Number of buckets       :     60013 =    480104 bytes, avg   8.000
Number of entries       :     26231 =    629544 bytes, avg  24.000
Number of literals      :     26231 =   1548152 bytes, avg  59.020
Total footprint         :           =   2657800 bytes
Average bucket size     :     0.437
Variance of bucket size :     0.418
Std. dev. of bucket size:     0.646
Maximum bucket size     :         4
At the bottom of the string table is hashtable, which stores data in the form of an array plus a chain table. You can see that the number of buckets storing strings is 60013 and the number of strings is 26231. The number of strings we actually created is 10,000, so why doesn't the number printed match? According to the printing information, the GC operation was triggered.
5.7 String table tuning
The essence of string table is hashtable, and the performance of hashtable is closely related to the number of buckets. To optimize string table is to adjust the number of buckets of hashtable.
/**
 * Demonstrate the impact of string pool size on Performance
 *  -XX:+PrintStringTableStatistics
 */
public class Demo1_24 {

    public static void main(String[] args) throws IOException {
        try (BufferedReader reader = new BufferedReader(new InputStreamReader(new FileInputStream("linux.words"), "utf-8"))) {
            String line = null;
            long start = System.nanoTime();
            while (true) {
                line = reader.readLine();
                if (line == null) {
                    break;
                }
                line.intern();
            }
            System.out.println("cost:" + (System.nanoTime() - start) / 1000000);
        }


    }
}
Configure and run the above code with the following printed information.
cost:439
SymbolTable statistics:
Number of buckets       :     20011 =    160088 bytes, avg   8.000
Number of entries       :     13697 =    328728 bytes, avg  24.000
Number of literals      :     13697 =    609024 bytes, avg  44.464
Total footprint         :           =   1097840 bytes
Average bucket size     :     0.684
Variance of bucket size :     0.684
Std. dev. of bucket size:     0.827
Maximum bucket size     :         6
StringTable statistics:
Number of buckets       :     60013 =    480104 bytes, avg   8.000
Number of entries       :    481494 =  11555856 bytes, avg  24.000
Number of literals      :    481494 =  29750344 bytes, avg  61.788
Total footprint         :           =  41786304 bytes
Average bucket size     :     8.023
Variance of bucket size :     8.084
Std. dev. of bucket size:     2.843
Maximum bucket size     :        23
Configuration parameter -XX:StringTableSize=200000, print information below.
cost:393
SymbolTable statistics:
Number of buckets       :     20011 =    160088 bytes, avg   8.000
Number of entries       :     13697 =    328728 bytes, avg  24.000
Number of literals      :     13697 =    609024 bytes, avg  44.464
Total footprint         :           =   1097840 bytes
Average bucket size     :     0.684
Variance of bucket size :     0.684
Std. dev. of bucket size:     0.827
Maximum bucket size     :         6
StringTable statistics:
Number of buckets       :    200000 =   1600000 bytes, avg   8.000
Number of entries       :    481494 =  11555856 bytes, avg  24.000
Number of literals      :    481494 =  29750344 bytes, avg  61.788
Total footprint         :           =  42906200 bytes
Average bucket size     :     2.407
Variance of bucket size :     2.420
Std. dev. of bucket size:     1.556
Maximum bucket size     :        12
Configuration parameter -XX:StringTableSize=1009, print information below.
cost:4870
SymbolTable statistics:
Number of buckets       :     20011 =    160088 bytes, avg   8.000
Number of entries       :     16327 =    391848 bytes, avg  24.000
Number of literals      :     16327 =    698456 bytes, avg  42.779
Total footprint         :           =   1250392 bytes
Average bucket size     :     0.816
Variance of bucket size :     0.811
Std. dev. of bucket size:     0.901
Maximum bucket size     :         6
StringTable statistics:
Number of buckets       :      1009 =      8072 bytes, avg   8.000
Number of entries       :    482764 =  11586336 bytes, avg  24.000
Number of literals      :    482764 =  29845512 bytes, avg  61.822
Total footprint         :           =  41439920 bytes
Average bucket size     :   478.458
Variance of bucket size :   432.042
Std. dev. of bucket size:    20.786
Maximum bucket size     :       547
You can see that when there are more buckets, there is less chance of hash conflicts and less time to pool.
Why use string tables to store strings? This saves space and avoids duplicate creation of string objects. Storing user information on streaming twitters across the network includes address items, unless strings are usedTables require about 30G of memory, but these addresses may contain a large number of duplicate addresses. M any users may come from Zhongguancun, Beijing. So twitter pools the address information and creates storage by string tables, reducing the memory space to tens of millimeters.
Feel the process through the example below.
/**
 * Demonstrate intern to reduce memory usage
 * -XX:StringTableSize=200000 -XX:+PrintStringTableStatistics
 * -Xsx500m -Xmx500m -XX:+PrintStringTableStatistics -XX:StringTableSize=200000
 */
public class Demo1_25 {

    public static void main(String[] args) throws IOException {

        List<String> address = new ArrayList<>();
        System.in.read();
        for (int i = 0; i < 10; i++) {
            try (BufferedReader reader = new BufferedReader(new InputStreamReader(new FileInputStream("linux.words"), "utf-8"))) {
                String line = null;
                long start = System.nanoTime();
                while (true) {
                    line = reader.readLine();
                    if(line == null) {
                        break;
                    }
                    address.add(line);
                }
                System.out.println("cost:" +(System.nanoTime()-start)/1000000);
            }
        }
        System.in.read();


    }
}
Before keyboard typing, there is no reading for data reading, and after typing, the data is read and saved in address. sampler in jvisualvm is used to sample the two time nodes. The results are as follows.
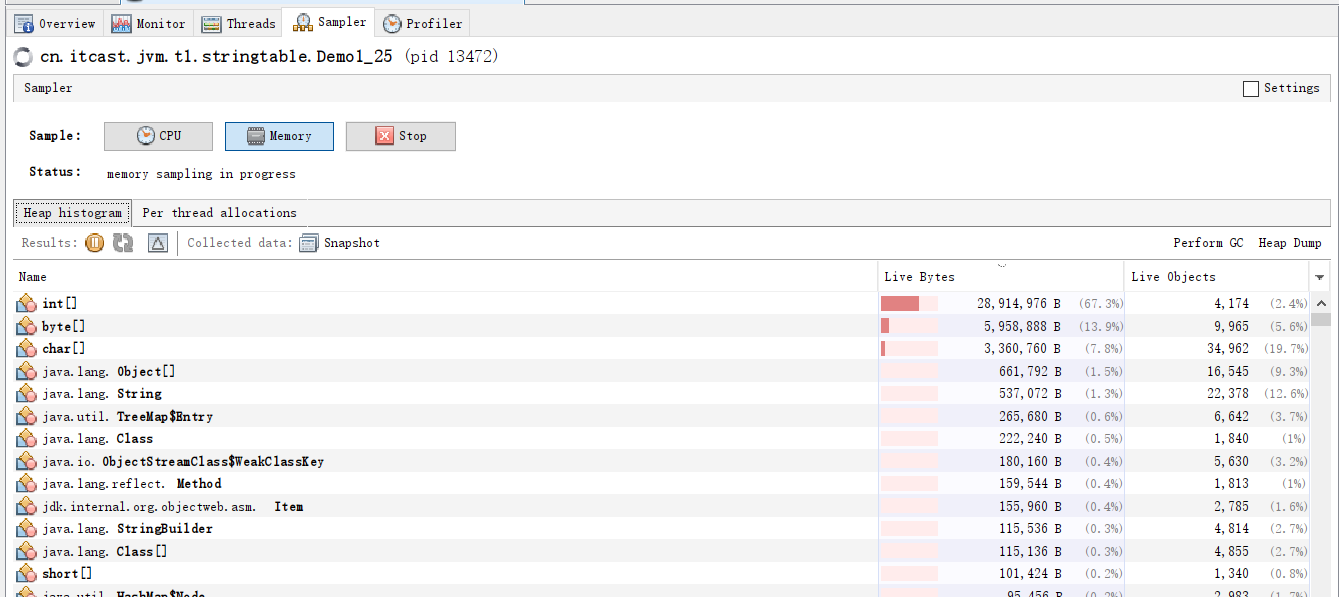
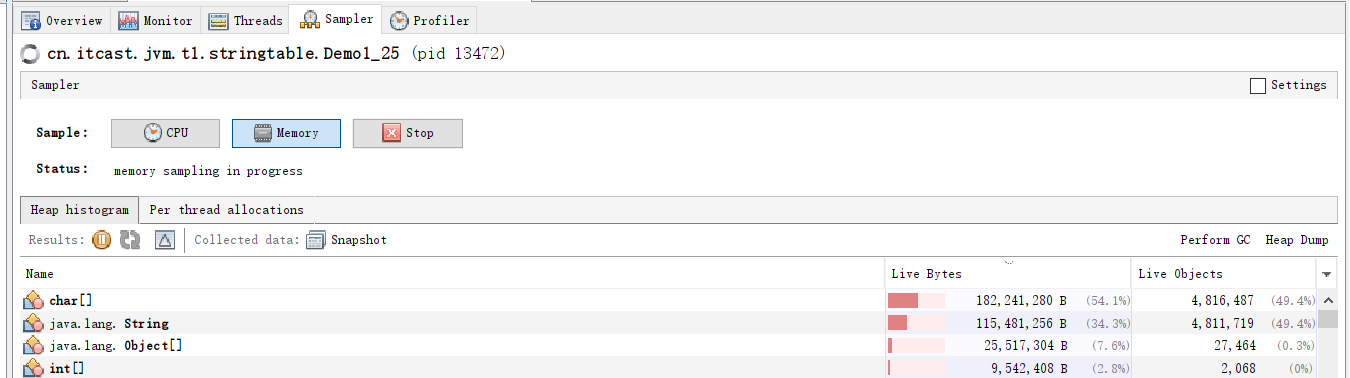
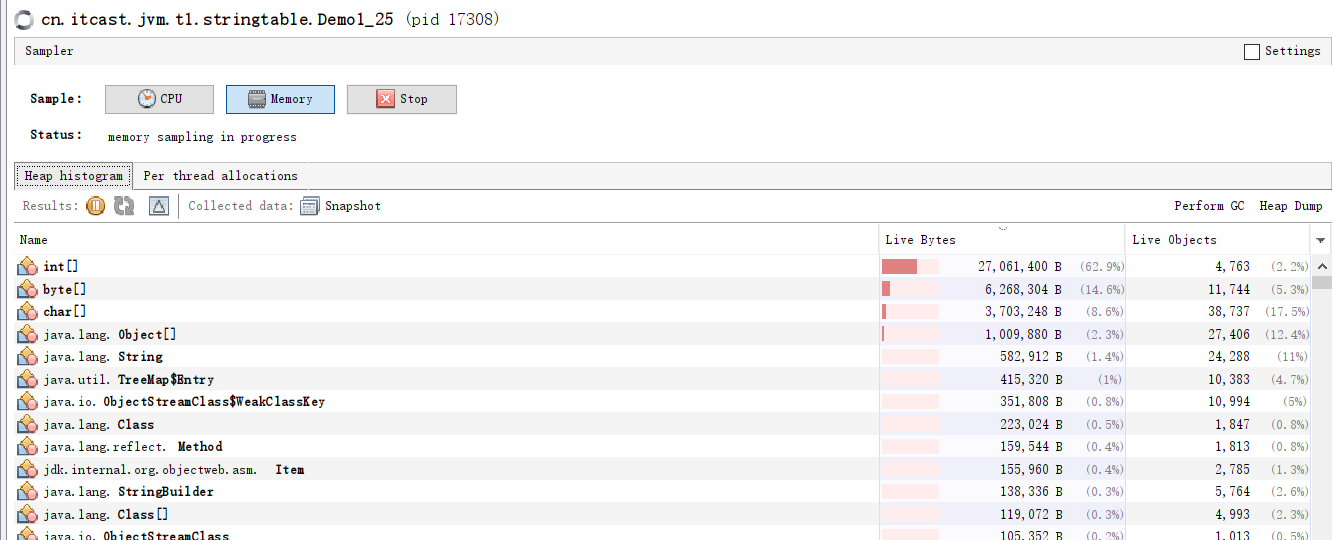
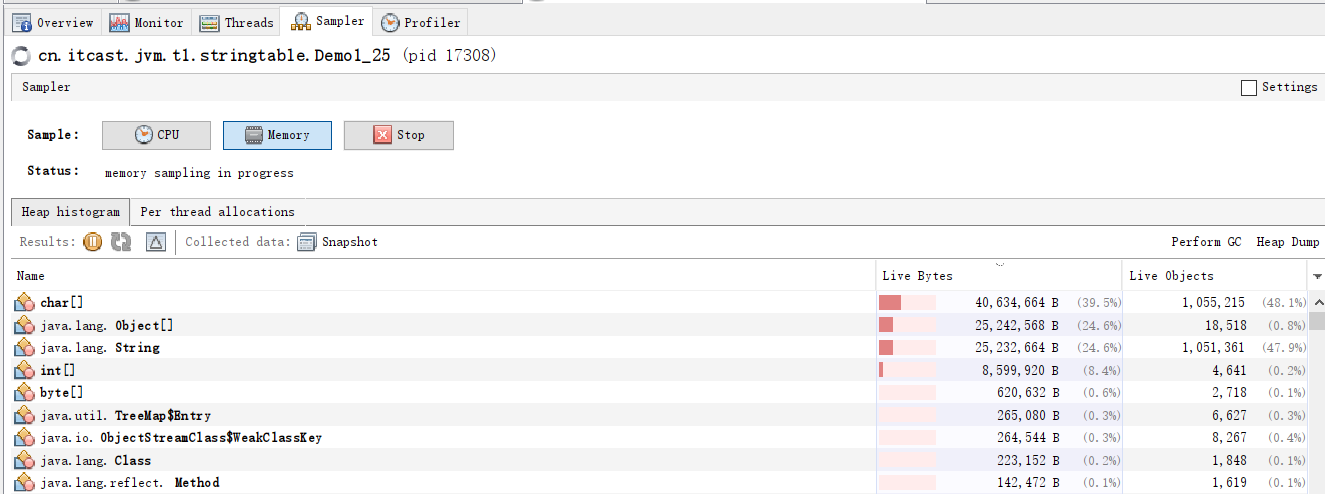
Modify the code address.add()
address.add(line.intern());
5.8 Direct Memory
Direct memory is managed by the operating system. Common in NIO for data buffering, high read and write performance, and high allocation and recycling costs.
Use the following code to compare the differences between read-write using traditional methods and read-write using NIO. Note that the first startup read-write performance will be poor, requiring several more runs to calculate the average.
/**
 * Demonstrating ByteBuffer's role
 */
public class Demo1_9 {
    static final String FROM = "F:\\Blog\\Practice Program of Grain Academy.md";
    static final String TO = "F:\\Practice Program of Grain Academy.md";
    static final int _1Mb = 1024 * 1024;

    public static void main(String[] args) {
        io(); // io time: 1535.586957 1766.963399 1359.240226
        directBuffer(); // directBuffer time: 479.295165 702.291454 562.56592
    }

    private static void directBuffer() {
        long start = System.nanoTime();
        try (FileChannel from = new FileInputStream(FROM).getChannel();
             FileChannel to = new FileOutputStream(TO).getChannel();
        ) {
            ByteBuffer bb = ByteBuffer.allocateDirect(_1Mb);
            while (true) {
                int len = from.read(bb);
                if (len == -1) {
                    break;
                }
                bb.flip();
                to.write(bb);
                bb.clear();
            }
        } catch (IOException e) {
            e.printStackTrace();
        }
        long end = System.nanoTime();
        System.out.println("directBuffer Time consumed:" + (end - start) / 1000_000.0);
    }

    private static void io() {
        long start = System.nanoTime();
        try (FileInputStream from = new FileInputStream(FROM);
             FileOutputStream to = new FileOutputStream(TO);
        ) {
            byte[] buf = new byte[_1Mb];
            while (true) {
                int len = from.read(buf);
                if (len == -1) {
                    break;
                }
                to.write(buf, 0, len);
            }
        } catch (IOException e) {
            e.printStackTrace();
        }
        long end = System.nanoTime();
        System.out.println("io Time consumed:" + (end - start) / 1000_000.0);
    }
}
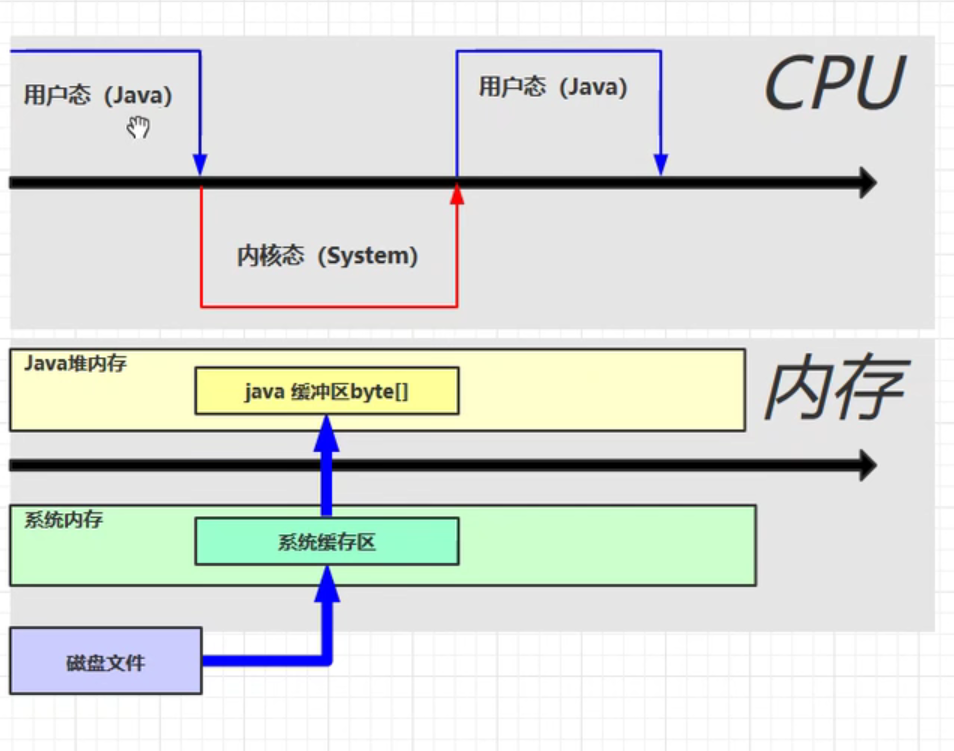
Why is direct memory read-write efficient? The changes in cpu and memory using blocking io are illustrated below. Clearly, copying files from the system cache to the java cache is a time-consuming and unnecessary copy.
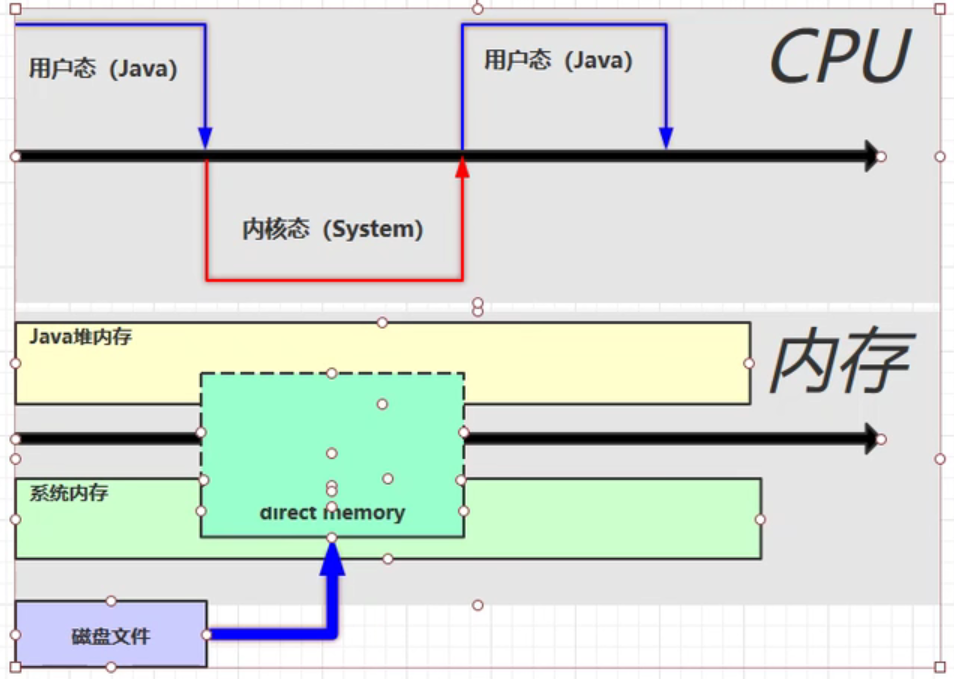
The changes in cpu and memory using Nio are illustrated below. The operating system allocates a block of direct memory that can be accessed by both the java code and the system when the allocateDirect() method is executed.
5.9 Memory overflow in direct memory
direct memory is not garbage collected by the jvm and can cause memory leak problems. Run the following code.
/**
 * Demonstrate direct memory overflow
 */
public class Demo1_10 {
    static int _100Mb = 1024 * 1024 * 100;

    public static void main(String[] args) {
        List<ByteBuffer> list = new ArrayList<>();
        int i = 0;
        try {
            while (true) {
                ByteBuffer byteBuffer = ByteBuffer.allocateDirect(_100Mb);
                list.add(byteBuffer);
                i++;
            }
        } finally {
            System.out.println(i);
        }
        // The method area is the jvm specification, and the implementation of the method area in jdk6 is called the permanent generation
        //                  jdk8's implementation of the method area is called Metaspace
    }
}
Output results.
72
Exception in thread "main" java.lang.OutOfMemoryError: Direct buffer memory
	at java.nio.Bits.reserveMemory(Bits.java:695)
	at java.nio.DirectByteBuffer.<init>(DirectByteBuffer.java:123)
	at java.nio.ByteBuffer.allocateDirect(ByteBuffer.java:311)
	at cn.itcast.jvm.t1.direct.Demo1_10.main(Demo1_10.java:19)
What is the underlying recycling mechanism for direct memory? Run the following code.
/**
 * The effect of disabling explicit recycling on direct memory
 */
public class Demo1_26 {
    static int _1Gb = 1024 * 1024 * 1024;

    /*
     * -XX:+DisableExplicitGC Explicit
     */
    public static void main(String[] args) throws IOException {
        ByteBuffer byteBuffer = ByteBuffer.allocateDirect(_1Gb);
        System.out.println("Allocation completed...");
        System.in.read();
        System.out.println("Start release...");
        byteBuffer = null;
        System.gc(); // Explicit garbage collection, Full GC
        System.in.read();
    }
}
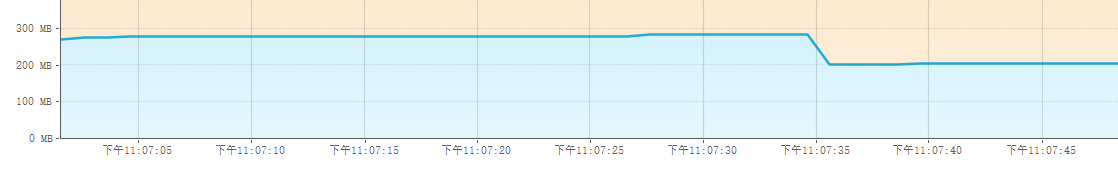
After the console output is allocated, you can see its memory usage from the task manager in the background.
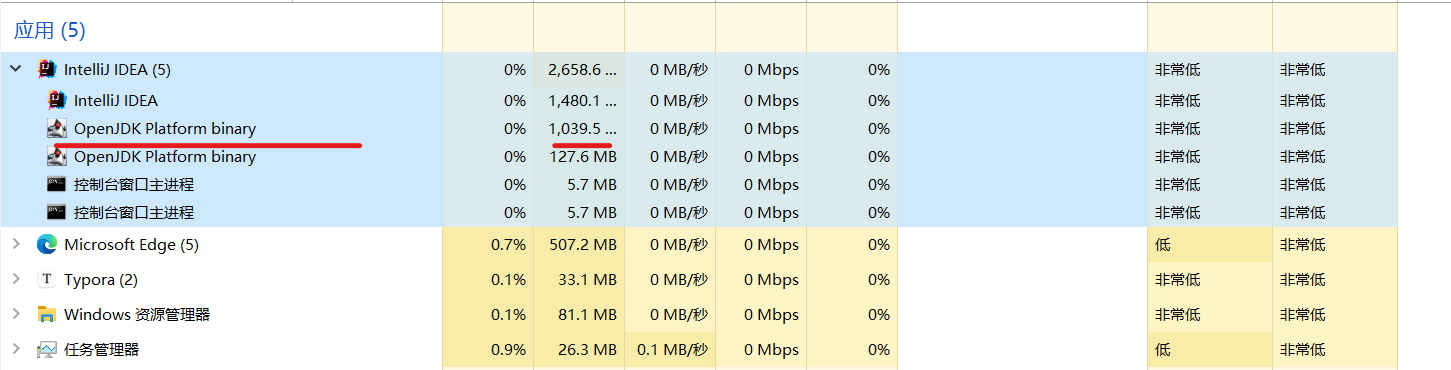
When you enter a carriage return in the console, the output starts to release, and then you enter a carriage return, the process that takes up 1 G of memory is cleaned up. Does that mean that the gc operation of java is working?
Unsafe is a class at the bottom of jdk that is used for memory allocation, memory recycling, etc. Normal programmers do not need it. Here we get Unsafe objects by reflection to demonstrate the underlying principle of direct memory allocation.
/**
 * The underlying principle of direct memory allocation: Unsafe
 */
public class Demo1_27 {
    static int _1Gb = 1024 * 1024 * 1024;

    public static void main(String[] args) throws IOException {
        Unsafe unsafe = getUnsafe();
        // Allocate memory
        long base = unsafe.allocateMemory(_1Gb);
        unsafe.setMemory(base, _1Gb, (byte) 0);
        System.in.read();

        // Release memory
        unsafe.freeMemory(base);
        System.in.read();
    }

    public static Unsafe getUnsafe() {
        try {
            Field f = Unsafe.class.getDeclaredField("theUnsafe");
            f.setAccessible(true);
            Unsafe unsafe = (Unsafe) f.get(null);
            return unsafe;
        } catch (NoSuchFieldException | IllegalAccessException e) {
            throw new RuntimeException(e);
        }
    }
}
Run the code, and after Task Manager observes the jdk process memory usage, it is found that the memory usage increases by 1G after allocateMemory() and recovers after freeMemory(). Therefore, direct memory recycling is not actually done by the jvm virtual machine, but by calling freeMemory() through the Unsafe object.
See the source code for the ByteBuffer class below to verify our point of view.
A DirectByteBuffer object is returned in allocateDirect().
public static ByteBuffer allocateDirect(int capacity) {
      return new DirectByteBuffer(capacity);
}
Call allocateMemory() in Unsafe to request memory and create a new Cleaner object to free memory.
    DirectByteBuffer(int cap) {                   // package-private

        super(-1, 0, cap, cap);
        boolean pa = VM.isDirectMemoryPageAligned();
        int ps = Bits.pageSize();
        long size = Math.max(1L, (long)cap + (pa ? ps : 0));
        Bits.reserveMemory(size, cap);

        long base = 0;
        try {
            base = unsafe.allocateMemory(size);
        } catch (OutOfMemoryError x) {
            Bits.unreserveMemory(size, cap);
            throw x;
        }
        unsafe.setMemory(base, size, (byte) 0);
        if (pa && (base % ps != 0)) {
            // Round up to page boundary
            address = base + ps - (base & (ps - 1));
        } else {
            address = base;
        }
        cleaner = Cleaner.create(this, new Deallocator(base, size, cap));
        att = null;


    }
What is the associated Dilllocator in cleaner? Click in to see that it implements Runnable, is a callback task object, and calls Unsafe's freeMemory in the run method.
  private static class Deallocator
        implements Runnable
    {

        private static Unsafe unsafe = Unsafe.getUnsafe();

        private long address;
        private long size;
        private int capacity;

        private Deallocator(long address, long size, int capacity) {
            assert (address != 0);
            this.address = address;
            this.size = size;
            this.capacity = capacity;
        }

        public void run() {
            if (address == 0) {
                // Paranoia
                return;
            }
            unsafe.freeMemory(address);
            address = 0;
            Bits.unreserveMemory(size, capacity);
        }

    }
So when is the garbage collection task performed? Look at the Cleaner source.
public class Cleaner
    extends PhantomReference<Object> {
    //...
    public void clean() {
        if (!remove(this))
            return;
        try {
            thunk.run();
        } catch (final Throwable x) {
            AccessController.doPrivileged(new PrivilegedAction<Void>() {
                    public Void run() {
                        if (System.err != null)
                            new Error("Cleaner terminated abnormally", x)
                                .printStackTrace();
                        System.exit(1);
                        return null;
                    }});
        }
    }
    //...
    }
Originally Cleaner is a virtual reference type in java, when its bound object is garbage collected, it triggers the clean() method of the virtual reference and executes the callback method run().
Looking back at Cleaner creation in the DirectByteBuffer class below, the process is clear.
cleaner = Cleaner.create(this, new Deallocator(base, size, cap));
Summarizing the process of direct memory allocation and release is to allocate direct memory by calling Unsafe allocateMemory, bind DirectoryByteBuffer to callback tasks by creating a virtual reference object Cleaner object, and automatically execute Cleaner's clean() method when the Directory is garbage collected to call Unsafe's freeMemory() to free memory.
5.10 Effect of disabling explicit garbage collection on direct memory
System.gc() can be used in java to explicitly recommend jvm garbage collection, but this garbage collection method is Full GC, which will do both new generation and older generation recycling. This may affect program performance. To avoid misuse by programmers, use -XX+DisableExplctGC to disable displayed garbage collection.
Run Demo1_26 again when explicit garbage collection is disabled.
/**
 * The effect of disabling explicit recycling on direct memory
 */
public class Demo1_26 {
    static int _1Gb = 1024 * 1024 * 1024;

    /*
     * -XX:+DisableExplicitGC Explicit
     */
    public static void main(String[] args) throws IOException {
        ByteBuffer byteBuffer = ByteBuffer.allocateDirect(_1Gb);
        System.out.println("Allocation completed...");
        System.in.read();
        System.out.println("Start release...");
        byteBuffer = null;
        System.gc(); // Explicit garbage collection, Full GC
        System.in.read();
    }
}
Direct memory for the above code is not recycled because explicit garbage collection fails. bytebuffer s are not garbage collected, which results in direct memory not being freed and are only garbage collected when the program is passive to Full GC. If the program needs to use direct memory frequently, we can receive an Unsafe object to allocate and reclaim memory.