Recently, I was studying Turing textbook by myself< Python Basic course of machine learning ", take some notes in the form of blog on csdn.
k-means clustering is one of the simplest and most commonly used clustering algorithms. It attempts to find cluster centers that represent specific areas of data. The algorithm performs the following two steps alternately: assign each data point to the nearest cluster center, and then set each cluster center to the average of all the assigned data points. If the cluster allocation does not change, the algorithm ends.
K-means clustering algorithm
The following will illustrate the algorithm flow

The first picture is our original data. For this data set, first we need to specify three clusters to find, so the first step will declare three random data points as the cluster center to initialize the algorithm (see Figure 2 above, the cluster center is represented by a triangle). Then start the iterative algorithm. First, each data point will be assigned to the nearest cluster center (see Figure 3 above). Next, modify the cluster center to the average value of the assigned points (see Figure 4 above). Then repeat the above two processes until the data points allocated at the cluster center remain unchanged, and the algorithm ends (in this example, a total of three iterations are carried out, as shown in the figure above). For each new data point, the k-means will assign it to the nearest cluster center.
The following figure shows the boundary learned by the k-means clustering algorithm in the above example:

The application code of k-means clustering of the above data using scikit learn will be given below
from sklearn.datasets import make_blobs
from sklearn.cluster import KMeans
# Generate simulated 2D data
X, y = make_blobs(random_state=1)
# Constructing clustering model
kmeans = KMeans(n_clusters=3)#Set the number of clusters to 3
kmeans.fit(X)
During the operation of the algorithm, each training data point in X is assigned a cluster label. We can go to kmeans labels_ These tags were found in the properties:
print("Cluster memberships:\n{}".format(kmeans.labels_))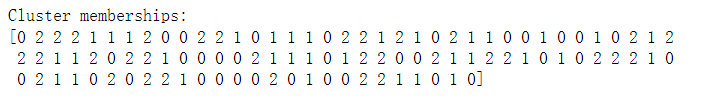
We can also use the predict method to assign cluster labels to new data points. During prediction, the nearest cluster center will be assigned to each new data point, but the existing model will not change. Running predict on the training set will return and labels_ The same result.
It can be seen that the clustering algorithm is somewhat similar to the classification algorithm, and each element has a label. However, there is no real label, so the label itself has no a priori meaning. For the clustering algorithm we just ran on the dataset, this means that we should not give any meaning to the fact that one group's label is 0 and the other group's label is 1. Running the algorithm again may get different cluster numbers because of the random nature of initialization.
Of course, we can also use more or fewer cluster centers:
fig, axes = plt.subplots(1, 2, figsize=(10, 5))
# Use 2 cluster centers:
kmeans = KMeans(n_clusters=2)
kmeans.fit(X)
assignments = kmeans.labels_
mglearn.discrete_scatter(X[:, 0], X[:, 1], assignments, ax=axes[0])
# Use 5 cluster centers:
kmeans = KMeans(n_clusters=5)
kmeans.fit(X)
assignments = kmeans.labels_
mglearn.discrete_scatter(X[:, 0], X[:, 1], assignments, ax=axes[1])

Algorithm disadvantages
For k-means, even given the correct number of clusters, there is no guarantee that the correct clusters can be found. Because each cluster is only defined by its center, it means that each cluster is convex (such as a circle). So the K-means can only find a relatively simple shape. It is assumed that the cluster K always has the same center diameter between all clusters.
For example, the following example:

You might think that the dense area at the lower left is the first cluster, the dense area at the upper right is the second, and the area with lower density in the middle is the third. But in fact, both cluster 0 and cluster 1 contain some points away from other points in the cluster. k-means also assumes that all directions are equally important for each cluster. This makes it unable to process some data, as shown in the following example:
# Generate some randomly grouped data
X, y = make_blobs(random_state=170, n_samples=600)
rng = np.random.RandomState(74)
# Transform the data to lengthen it
transformation = rng.normal(size=(2, 2))
X = np.dot(X, transformation)
# Cluster the data into 3 clusters
kmeans = KMeans(n_clusters=3)
kmeans.fit(X)
y_pred = kmeans.predict(X)
# Draw the cluster allocation and cluster center
plt.scatter(X[:, 0], X[:, 1], c=y_pred, cmap=mglearn.cm3)
plt.scatter(kmeans.cluster_centers_[:, 0], kmeans.cluster_centers_[:, 1],
 marker='^', c=[0, 1, 2], s=100, linewidth=2, cmap=mglearn.cm3)
plt.xlabel("Feature 0")
plt.ylabel("Feature 1")
The figure above shows a two-dimensional data set with three clearly separated parts. Because the k-means only considers the distance from the nearest cluster center, it misclassifies the above data sets, and it cannot process this type of data.
If the shape of the cluster is more complex, such as two_moons (sklearn.datasets) data, the performance of k-means is also very poor:
# Generate simulated two_moons data
from sklearn.datasets import make_moons
X, y = make_moons(n_samples=200, noise=0.05, random_state=0)
# Cluster the data into 2 clusters
kmeans = KMeans(n_clusters=2)
kmeans.fit(X)
y_pred = kmeans.predict(X)
# Draw the cluster allocation and cluster center
plt.scatter(X[:, 0], X[:, 1], c=y_pred, cmap=mglearn.cm2, s=60)
plt.scatter(kmeans.cluster_centers_[:, 0], kmeans.cluster_centers_[:, 1],
 marker='^', c=[mglearn.cm2(0), mglearn.cm2(1)], s=100, linewidth=2)
plt.xlabel("Feature 0")
plt.ylabel("Feature 1")
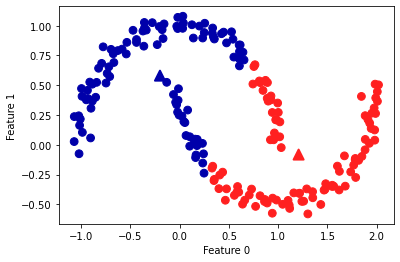
Obviously, the k-means has been misclassified again.
A solution
Although k-means is a clustering algorithm, there are some similarities between k-means and decomposition methods (such as principal component analysis). PCA tries to find the direction with the largest variance in the data, which usually corresponds to the "extreme value" or "part" of the data. PCA attempts to represent data points as the sum of some components. On the contrary, k-means tries to use the cluster center to represent each data point. You can think of it as representing each data point with only one component, which is given by the cluster center. This view regards k-means as a decomposition method, in which each point is represented by a single component. This view is called vector quantization
It doesn't matter if you don't understand the above paragraph. Let's give an example. I'm sure you can understand it right away.
Let's go back to two_moons data. If we use more cluster centers, we can use k-means to find a more expressive representation:
X, y = make_moons(n_samples=200, noise=0.05, random_state=0)
kmeans = KMeans(n_clusters=10, random_state=0)
kmeans.fit(X)
y_pred = kmeans.predict(X)
plt.scatter(X[:, 0], X[:, 1], c=y_pred, s=60, cmap='Paired')
plt.scatter(kmeans.cluster_centers_[:, 0], kmeans.cluster_centers_[:, 1], s=60,
 marker='^', c=range(kmeans.n_clusters), linewidth=2, cmap='Paired')
plt.xlabel("Feature 0")
plt.ylabel("Feature 1")
print("Cluster memberships:\n{}".format(y_pred))
Now we use 10 cluster centers, in other words, each point is now assigned a number between 0 and 9. So we can build 10 new features. Only the feature representing the cluster center corresponding to this point is not 0, and other features are 0. Using this 10-dimensional representation, we can now use a linear model to divide two half moons, which cannot be achieved by using the original two features. Taking the distance to the center of each cluster as a feature, we can also get a better data representation of the table. This can be done using the transform method of kmeans.
distance_features = kmeans.transform(X)
print("Distance feature shape: {}".format(distance_features.shape))
print("Distance features:\n{}".format(distance_features))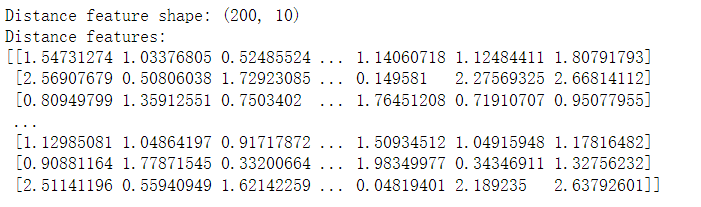
As for the specific implementation process of linear model, it is not described here. You can implement it yourself and communicate in the comment area.
Of course, k-means algorithm also has a disadvantage, that is, it has strong constraints on the assumption of cluster shape, and it also requires to specify the number of clusters to be found (this number may not be known in real-world applications).