Background summary
Recently, helm3 has deployed resources in k8S/k3s clusters. In China, Alibaba, Netease and Tsinghua are always keen to be image sources. Because there are always one or another problems in domestic and foreign networks, the difference between your ability and others is how you quickly deal with such network problems, which will make you grow up faster.
Digression:
Network problems: because some large factories can apply to the Ministry of industry and information technology for the power to open the external network connection, the networks of companies like Baidu / Tencent / Alibaba can access foreign networks (except wiki s), which is also a driving force for the source of the so-called advanced technology of large factories. Baidu search wastes time and life, and it is OK and cherished.
Image problem: some image maintenance websites in China are often on the spur of the moment. I don't know that little brother wants to engage in a wave of image conversion, but the continuous enabling maintenance is really hard to say. There are often the following reasons, such as the relatively large changes in helm version 2 and version 3, the untimely update, and some websites give up halfway, Originally, it was to solve the problem of network interoperability at home and abroad. As a result, half of it was done and no one maintained it, or the foreign version was greatly upgraded. People update it every day and can't keep up with the rhythm and speed. What are you doing for those good students?
Take a chestnut
According to the helm3 deployment tutorial, we usually set the helm source after the helm3 deployment, but the domestic source is really different from the foreign source!
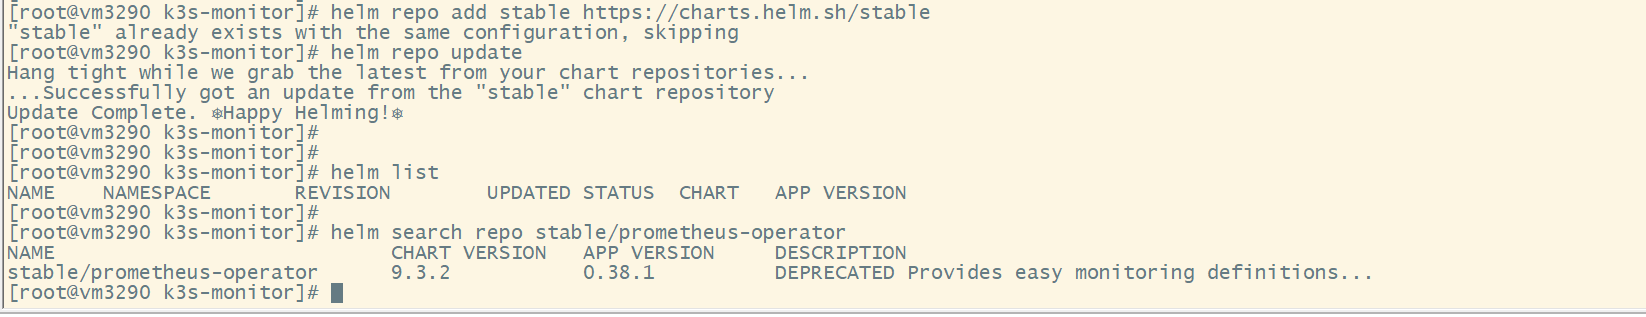
- Foreign helm sources
# Import foreign source
helm repo remove stable
helm repo add stable https://charts.helm.sh/stable
helm repo update
helm list
helm search repo stable/prometheus-operator
- Domestic helm source
helm repo remove stable
helm repo add stable https://kubernetes.oss-cn-hangzhou.aliyuncs.com/charts
helm repo update
helm list
helm search repo stable/prometheus-operator
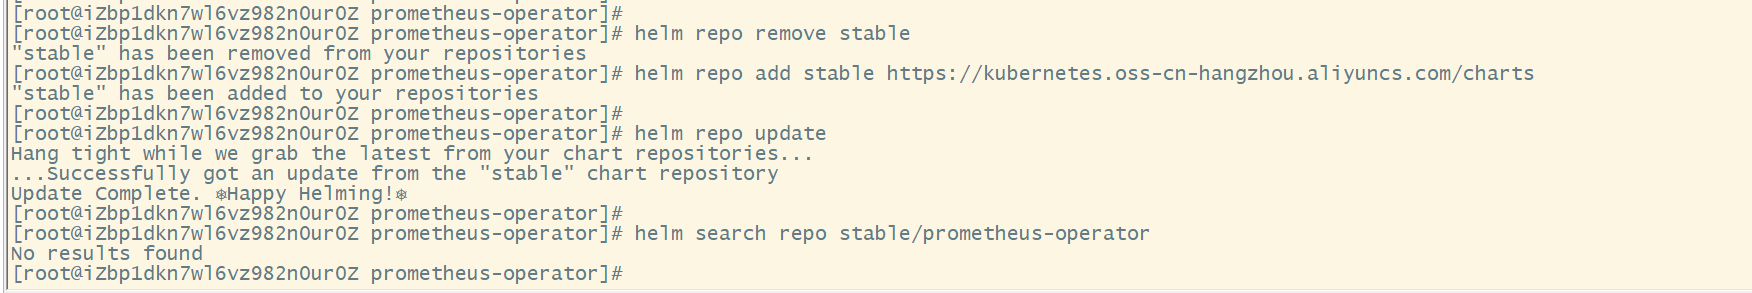
Note: the domestic source is caused by the network. The domestic source cannot be used normally. Do not test it separately. Unless your own network area is opened and you can access the external network, the server cluster of foreign source in China cannot be used normally.
terms of settlement
If there are common solutions to the problems of resource files such as image and helm source in the cloud native domain or due to network problems, the following is a summary:
Build a foreign k8s/k3s cluster or machine environment. It is better to use helm ctr and other environment commands normally for easy access
-
Buy foreign machines
Use your own brain -
Configure peer-to-peer environment
Expand according to your own environment
Development of foreign cluster environment
- Migrating environmental resources (helm3 resources as an example)
# Check whether there are available helm resources
helm search repo stable/prometheus-operator
# Save resources locally
helm pull stable/prometheus-operator
# Copy the saved helm resource tgz package to the domestic cluster environment (similarly, the image or other resources are obtained in the same way)

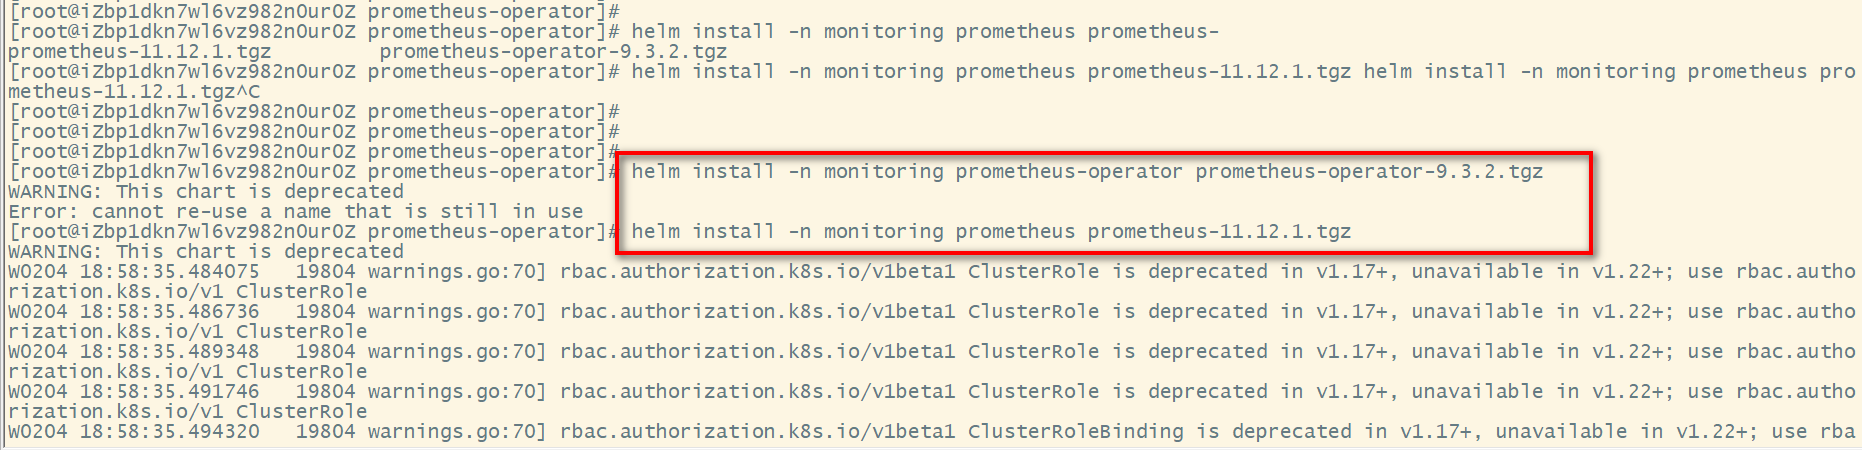
Operator & Prometheus (domestic)
# View smuggled helm resources
[root@iZbp1dkn7wl6vz982n0ur0Z prometheus-operator]# pwd
/home/work/helm/prometheus-operator
[root@iZbp1dkn7wl6vz982n0ur0Z prometheus-operator]# ls
prometheus-11.12.1.tgz  prometheus-operator-9.3.2.tgz

# Create a namespace for resource deployment
kubectl create ns monitoring

# Install Prometheus operator
helm install -n monitoring prometheus-operator prometheus-operator-9.3.2.tgz

# Install prometheus
helm install -n monitoring prometheus prometheus-11.12.1.tgz
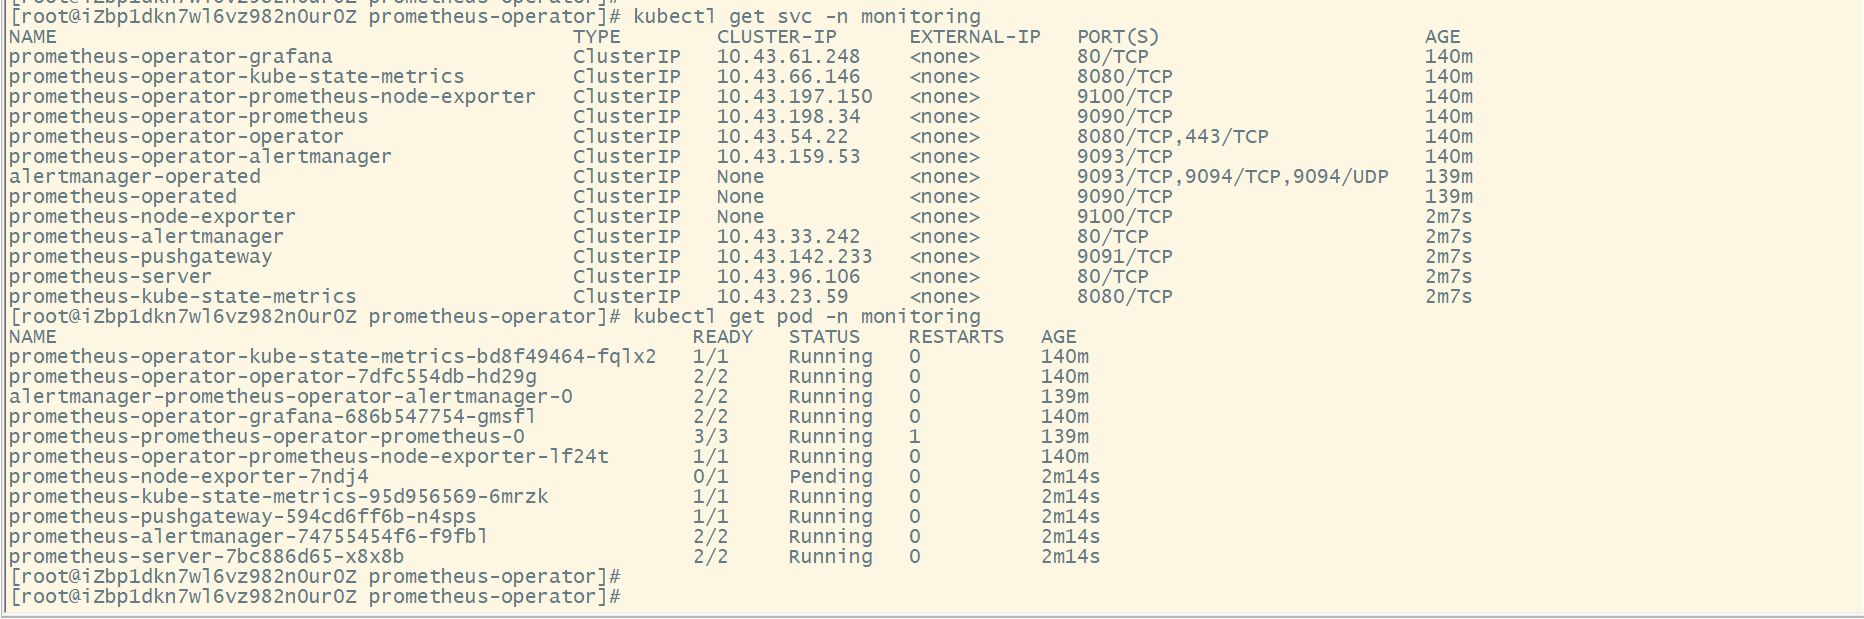
Service exposure
kubectl get svc -n monitoring
kubectl get pod -n monitoring
# Expose nodeport port
kubectl patch svc prometheus-operator-grafana -p '{"spec":{"type":"NodePort"}}' -n monitoring
kubectl patch svc prometheus-operator-prometheus -p '{"spec":{"type":"NodePort"}}' -n monitoring
View access method:
[root@iZbp1dkn7wl6vz982n0ur0Z prometheus-operator]# kubectl get svc -n monitoring
NAME                                           TYPE        CLUSTER-IP      EXTERNAL-IP   PORT(S)                      AGE
prometheus-operator-kube-state-metrics         ClusterIP   10.43.66.146    <none>        8080/TCP                     141m
prometheus-operator-prometheus-node-exporter   ClusterIP   10.43.197.150   <none>        9100/TCP                     141m
prometheus-operator-operator                   ClusterIP   10.43.54.22     <none>        8080/TCP,443/TCP             141m
prometheus-operator-alertmanager               ClusterIP   10.43.159.53    <none>        9093/TCP                     141m
alertmanager-operated                          ClusterIP   None            <none>        9093/TCP,9094/TCP,9094/UDP   141m
prometheus-operated                            ClusterIP   None            <none>        9090/TCP                     141m
prometheus-node-exporter                       ClusterIP   None            <none>        9100/TCP                     3m42s
prometheus-alertmanager                        ClusterIP   10.43.33.242    <none>        80/TCP                       3m42s
prometheus-pushgateway                         ClusterIP   10.43.142.233   <none>        9091/TCP                     3m42s
prometheus-server                              ClusterIP   10.43.96.106    <none>        80/TCP                       3m42s
prometheus-kube-state-metrics                  ClusterIP   10.43.23.59     <none>        8080/TCP                     3m42s
prometheus-operator-grafana                    NodePort    10.43.61.248    <none>        80:30901/TCP                 141m
prometheus-operator-prometheus                 NodePort    10.43.198.34    <none>        9090:31559/TCP               141m
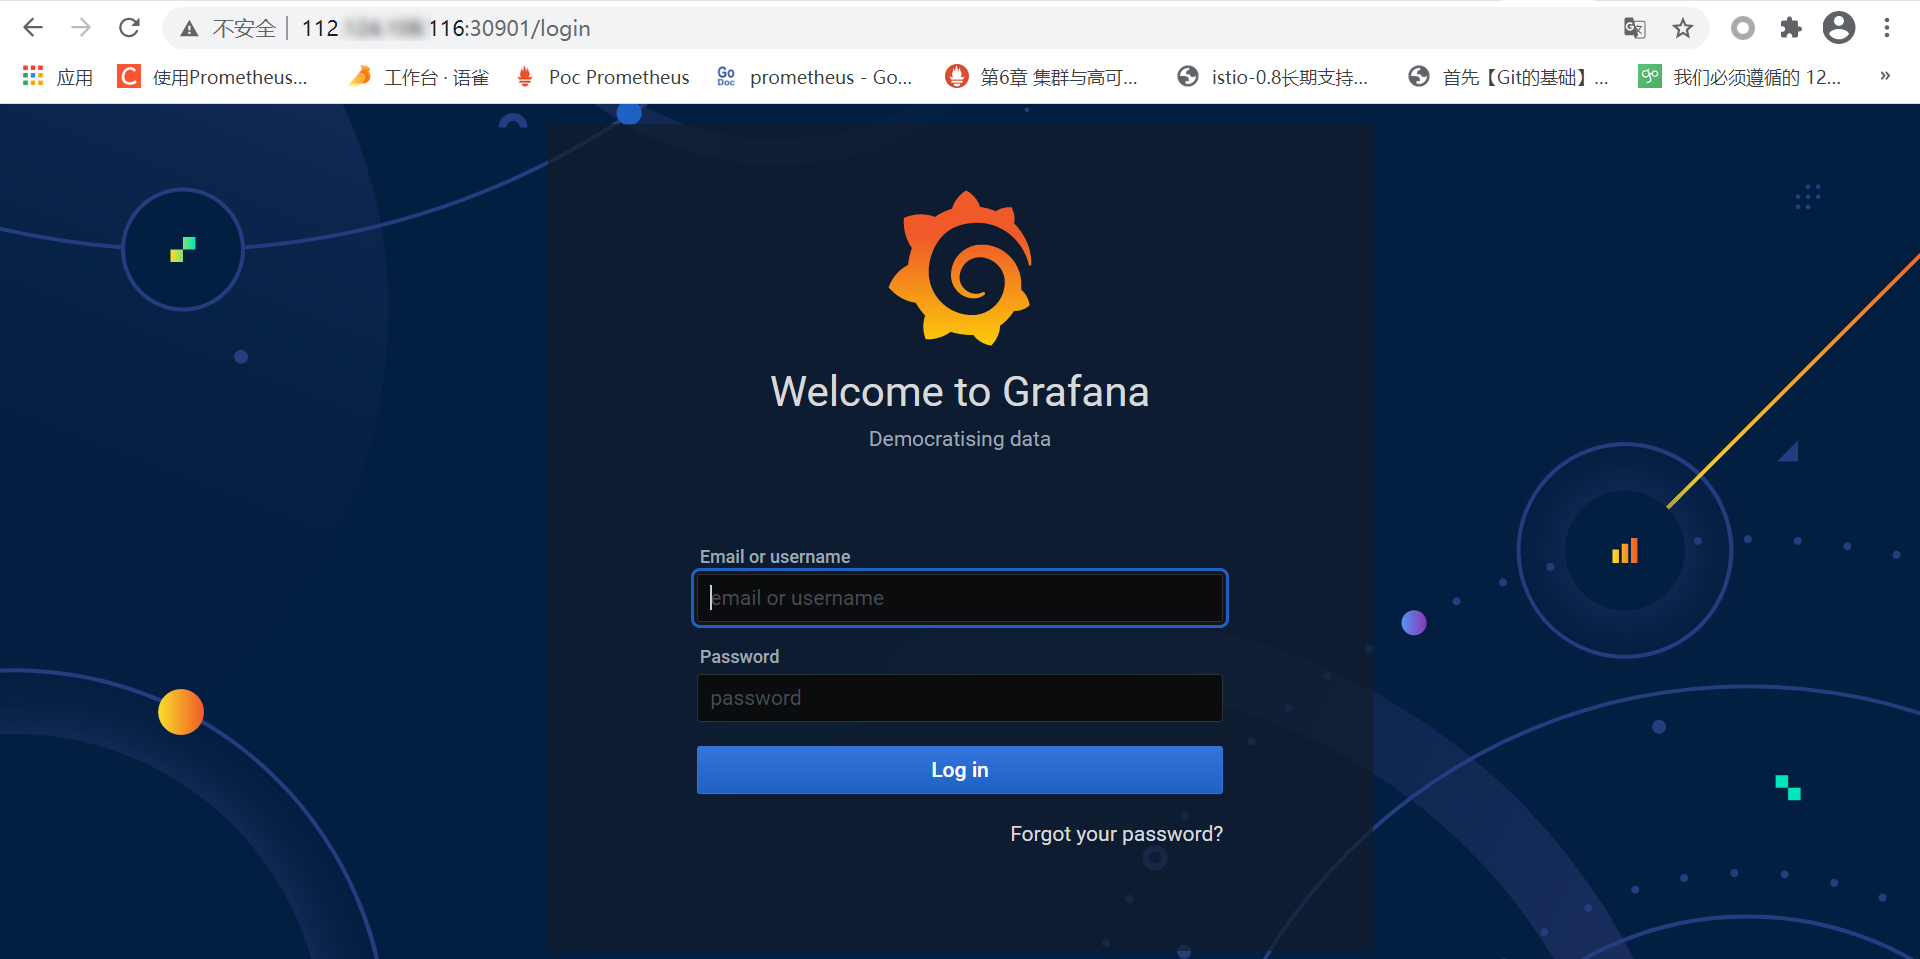
grafana needs to log in to view the account and password
account number: admin
 password:
kubectl get secret --namespace monitoring  prometheus-operator-grafana -o jsonpath="{.data.admin-password}" | base64 --decode ; echo
explain:
Grafana access portal: http://your_vhost_ip:30901
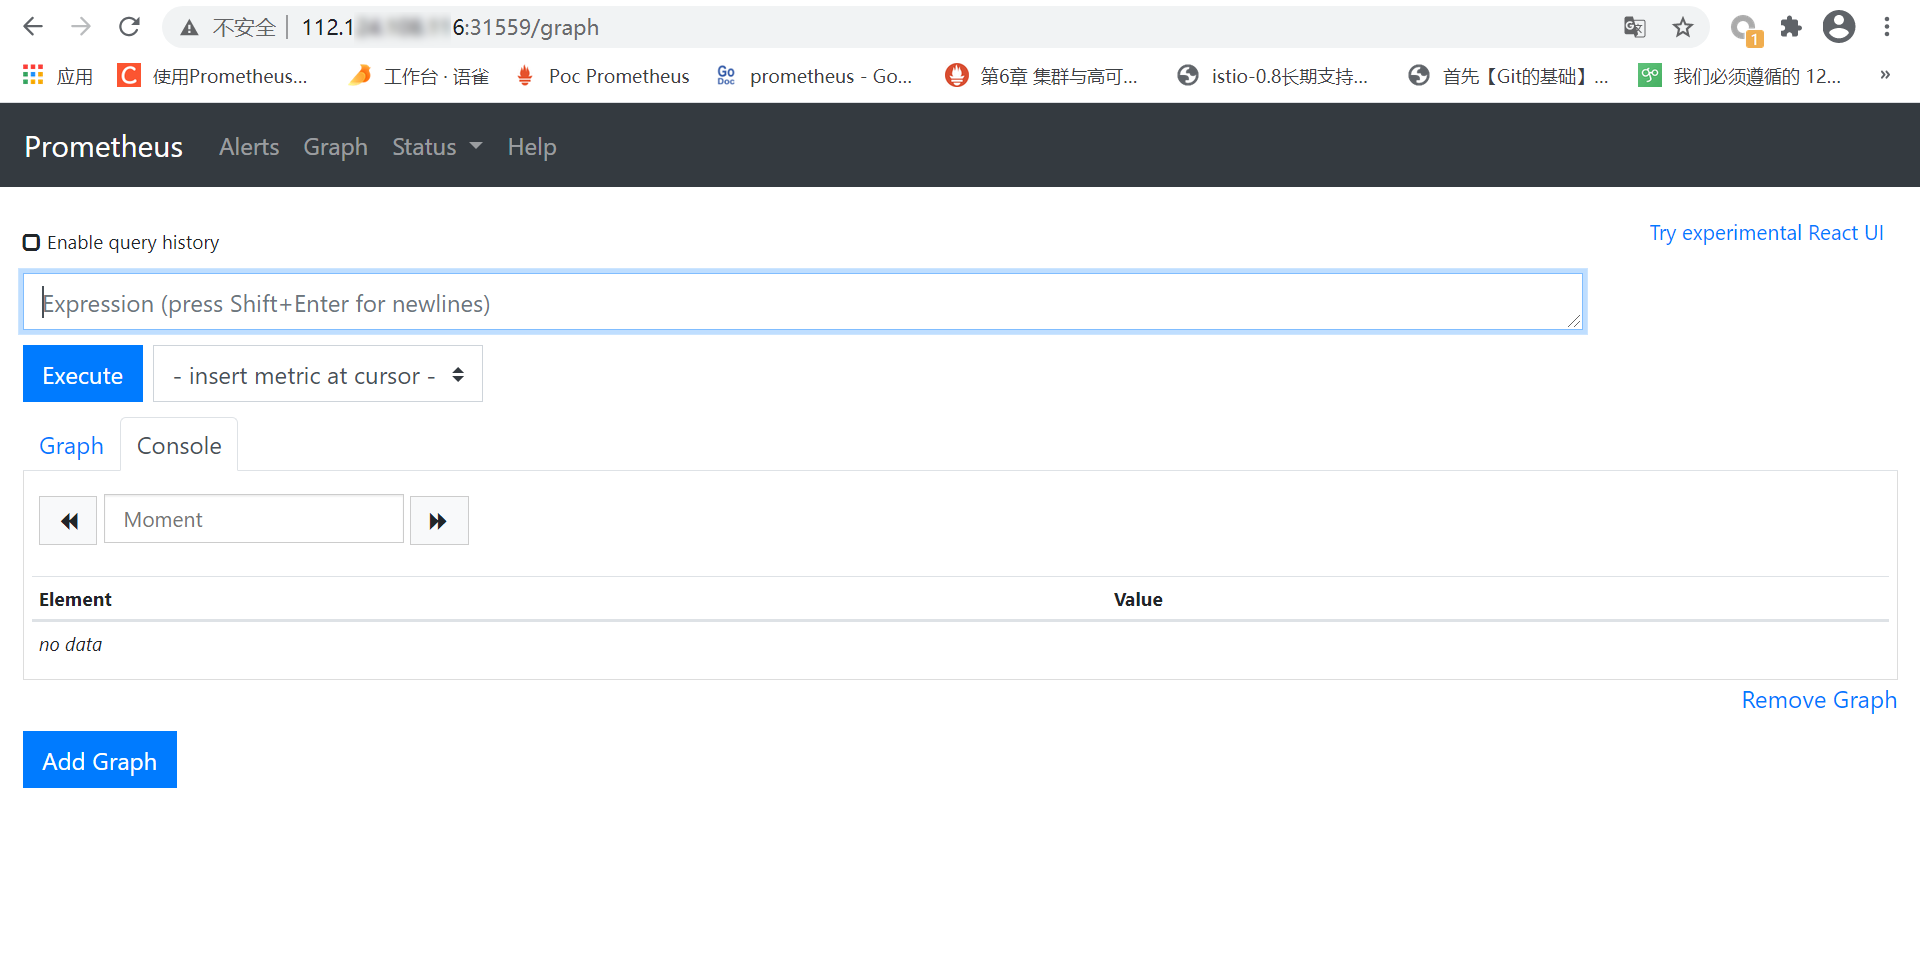
Prometheus access portal: http://your_vhost_ip:31559 .
Extended reading
In fact, we have accessed the desired service, but because my local port occupation conflicts, in fact, node export does not start collecting the data we expect, so I will not deal with the problem of port occupation ha!
Often, I prefer to use ingress to expose applications similar to http to access services. In order to operate conveniently, I exposed services through nodeport. In fact, the method is completely similar to the previous tutorial and there is no need to repeat it.
It can be seen that there are great differences between domestic and foreign helm sources, so domestic developers often need to spend more time to achieve their goals in dealing with compatibility and resource acquisition!