kmeans clustering algorithm
Algorithm principle
The algorithm principle of kmeans is actually very simple
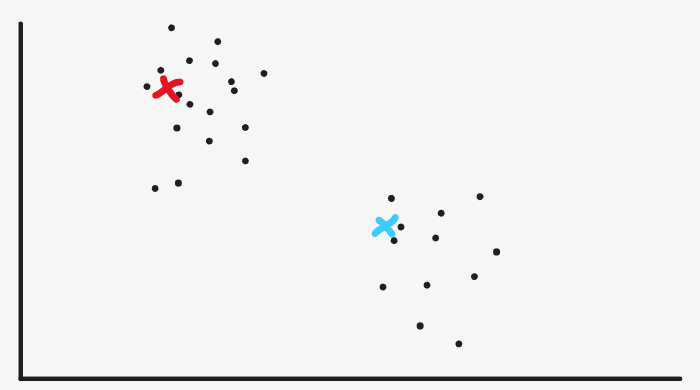
I use the simplest two-dimensional scatter diagram to explain
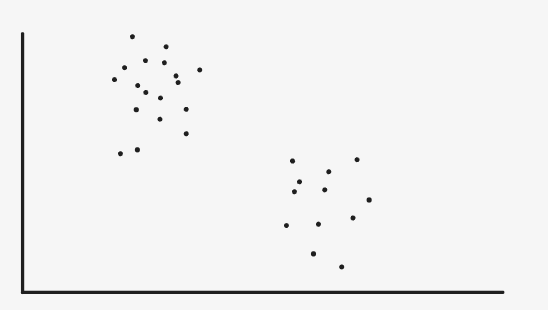
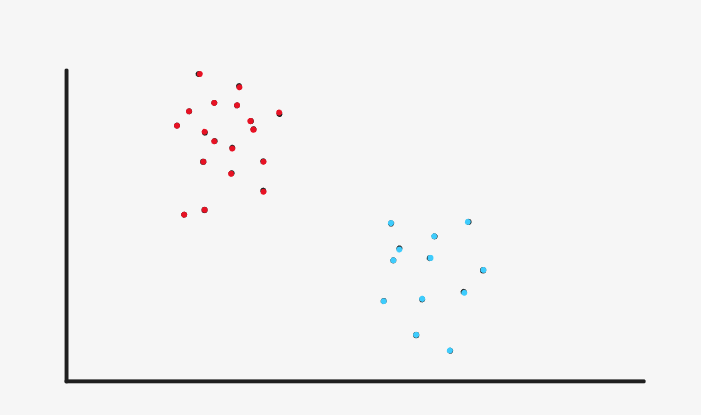
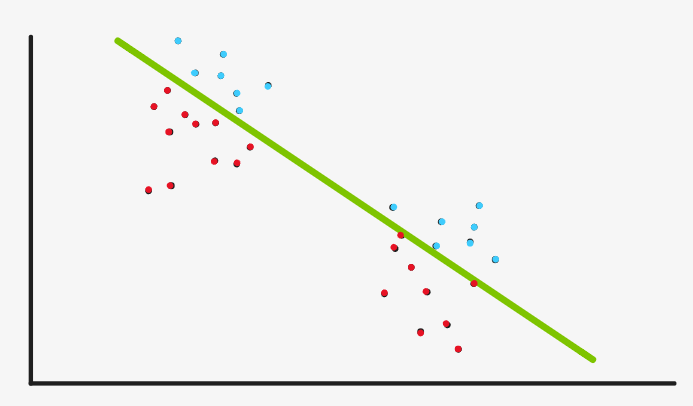
As shown in the figure above, we can intuitively see that the figure can be grouped into two categories, which are represented by red dots and blue dots respectively
Let's simulate how Kmeans clusters the original two-dimensional scatter graph
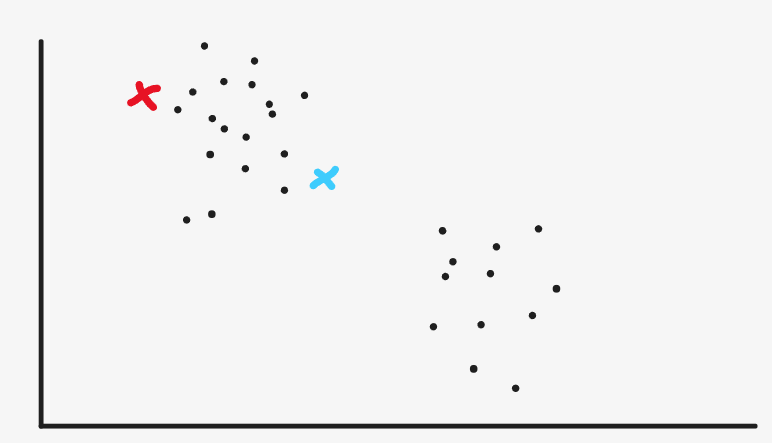
First, initialize two cluster centers randomly. As for what is a cluster center, we don't need to press down the table for the time being. Just take it as a point now.
[the external chain image transfer fails. The source station may have an anti-theft chain mechanism. It is recommended to save the image and upload it directly (img-sk81va5t-1636722491932) (C: \ users \ li554 \ appdata \ roaming \ typora user images \ image-20211112203412124. PNG)]
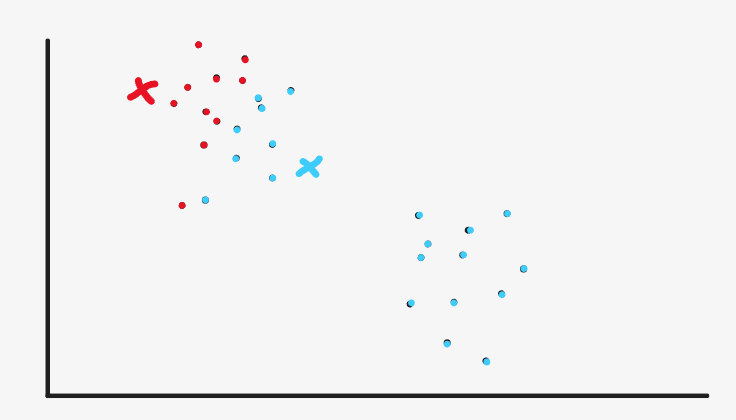
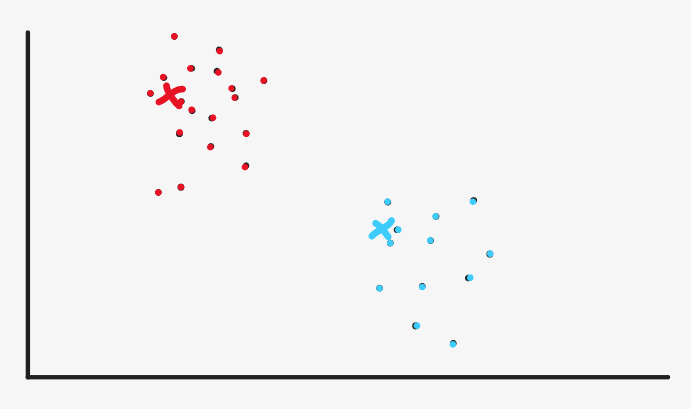
Then we will mark all the sample points entering from the red point as red and the sample points close to the blue point as blue
Then we reset the location of the cluster center. The red clustering center is set at the center (mean value) of the current red point, the blue clustering center is set at the center (mean value) of the current blue point, and the sample color is reset to black
Then we continue to mark all the sample points that enter from the red point as red, and the sample points that are close to the blue point as blue
In fact, we now see that red and blue are very clear and have achieved the initial effect, but the machine has no eyes and can't see intuitively. Now it can stop.
Therefore, it will continue to reset the cluster center according to the method of calculating the mean
Then, continue to mark all the sample points entering from the red point as red and the sample points close to the blue point as blue
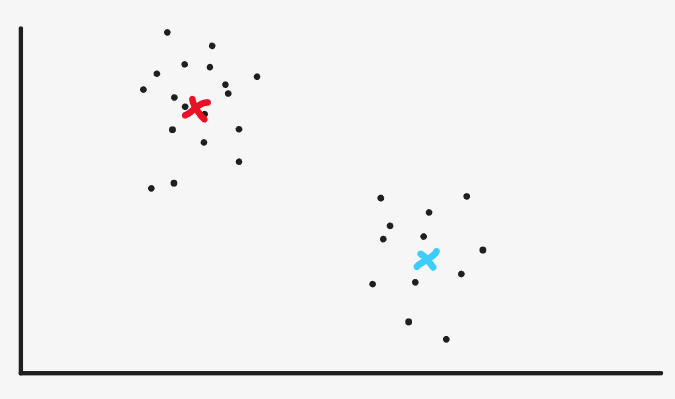
Then continue to reset the cluster center according to the method of calculating the mean, but here, the machine will find that the position of the cluster center we set and the previous cluster center has hardly changed, which shows that our algorithm converges and the category of each sample has been basically determined. So the algorithm terminates and clustering is completed
Algorithm steps
-
Select K cluster centers
-
Calculate the distance from each sample point to K cluster centers, and add the sample to the classification corresponding to the cluster center with the smallest distance
-
The sample mean of each classification set is calculated and used as a new clustering center
-
Repeat steps 2 and 3 until the distance between the new cluster center and the original cluster center is less than the set threshold
Algorithm implementation
import numpy as np
import matplotlib.pyplot as plt
from sklearn.datasets import make_blobs

class KMeans:
    def __init__(self, k, threshold):
        self.k = k
        self.threshold = threshold

    def train(self, X):
        # Initialize cluster center
        # K samples were randomly selected as clustering centers
        self.centers = X[np.random.choice(X.shape[0], size=self.k)]
        while True:
            # Classification by cluster center
            clusters = []
            for i in range(self.k):
                clusters.append([])
            for i, x in enumerate(X):
                # The reason why clusters store the sample index rather than the sample itself is to reduce space consumption
                clusters[self.predict(x)].append(i)
            new_centers = self.centers.copy()
            # Calculate the new cluster center
            for i, cluster in enumerate(clusters):
                new_centers[i] = X[cluster].mean()
            # If the cluster center basically does not change, it is terminated
            if np.max(np.abs(new_centers - self.centers)) < self.threshold:
                break
            # Otherwise, update the cluster center and repeat the above steps
            self.centers = new_centers
        # Return clustering results
        y_pred = np.zeros(shape=(X.shape[0],))
        for cluster_index, cluster in enumerate(clusters):
            for i in cluster:
                y_pred[i] = cluster_index
        return y_pred

    def predict(self, x):
        dis = []
        # Calculate the distance between each sample and the center
        for c in self.centers:
            dis.append(np.linalg.norm(x - c))
        # Add the sample index to the classification corresponding to the center with the smallest distance
        return np.argmin(dis)


def main():
    model = KMeans(3, 1e-2)
    X, y = make_blobs(n_samples=1000, n_features=2, centers=3)
    y_pred = model.train(X)
    plt.scatter(X[:, 0], X[:, 1], c=y)
    plt.show()

    plt.scatter(X[:, 0], X[:, 1], c=y_pred)
    plt.show()
main()
Optimization and improvement
OK, after talking about the Kmeans algorithm, let's think about what's wrong with the Kmeans algorithm
Cluster center initialization
Look at the following two figures. They are the results of the above programs that may run occasionally. The left is the original data and the right is the clustered data
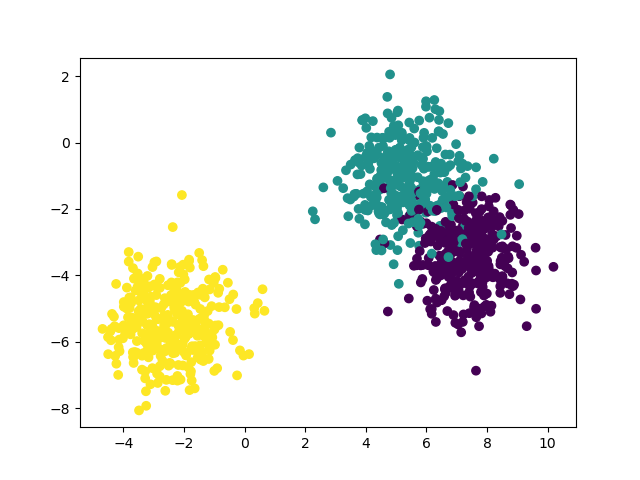
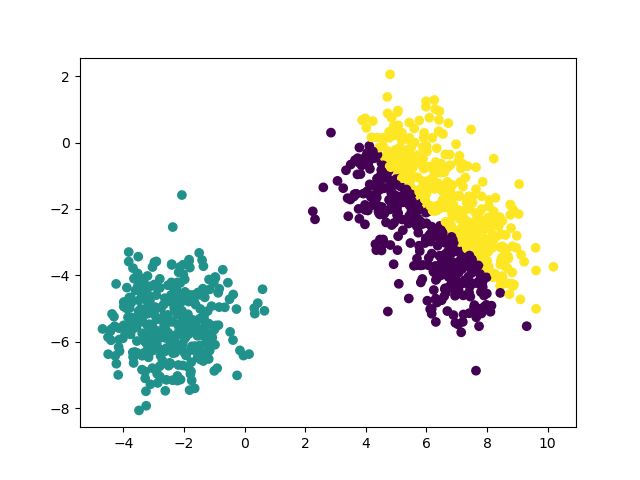
Although the clustered data is very clear, it is extremely inconsistent with the distribution of the original data, which is actually the problem of cluster center initialization.
For example, in the example we introduced earlier, if our clustering center is in this place
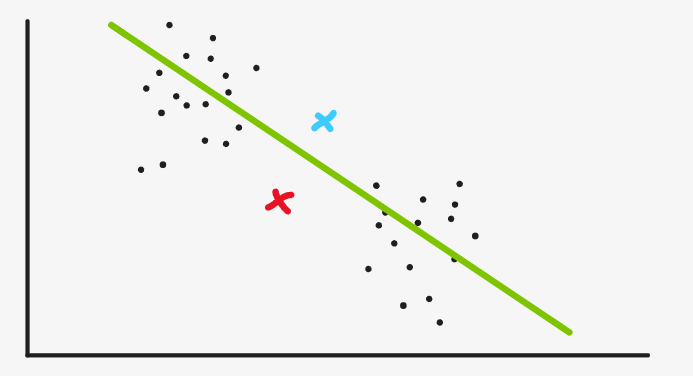
Therefore, the lower part of the green line is divided into red and the upper part of the green line is divided into blue. As soon as we find the mean value and reset the cluster center, we find that the location has not changed much, so this is the cluster we get
It is also clear, but it is obviously not the clustering we want
So how to solve this problem, that is, randomly initializing the cluster center is not good.
. . . To be added...