K-Means principle and implementation method of opencv (C + + and python versions)
KMeans principle
Today, record the principle of kmeans in opencv and an example of image segmentation. K-Means is an algorithm for data classification, which belongs to unsupervised learning.
First, determine the number of categories for the image, that is, know several categories, and then each category has a center point
Then determine which category label each data point belongs to according to the distance. After classifying all data points in one cycle, stop calculating the label of the final sample data until the specified number of cycles or the delta of the previous and subsequent two times is less than the specified threshold.
First, let's talk about the KMeans data classification function in opencv:
The API for KMeans data classification in OpenCV is:
KMeans function
double cv::kmeans(
	InputArray data,
	int K,
	InputOutputArray bestLabels,
	TermCriteria criteria,
	int attempts,
	int flags,
	OutputArray centers = noArray()
)
Data is the input sample data. Samples must be organized by rows. Each row contains one sample data. The dimensions of samples are listed
K represents the final number of classifications
bestLabels represents the label of each sample in the final classification (each sample has a label)
criteria indicates the stop condition for KMeans segmentation
Attempts indicates the number of attempts to sample different initialization tags
flag indicates the center initialization method (there are three methods below)
- KMEANS_RANDOM_CENTERS
- KMEANS_PP_CENTERS
- KMEANS_USE_INITIAL_LABELS
centers represents the center position of each cluster after final segmentation
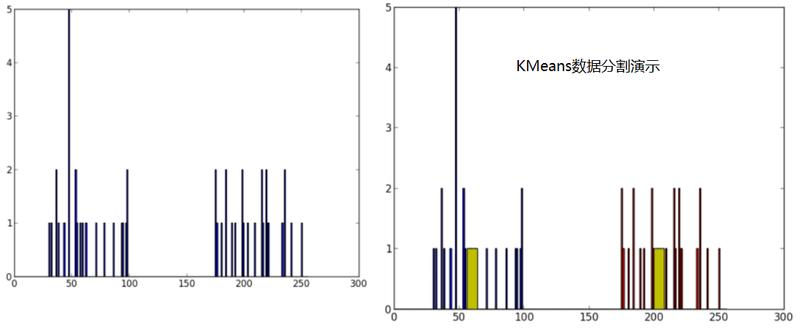
For the presentation of Kmeans data classification, the left figure shows the data coordinates, which can be understood as histograms. It can be seen that they are two major categories, while the yellow in the right figure is the center point of the category
Let's use teacher Jia Zhigang's code for a demonstration. Let's look at the python version first
Code demonstration
1.python version
Import required libraries
import numpy as np
import cv2
from matplotlib import pyplot as plt
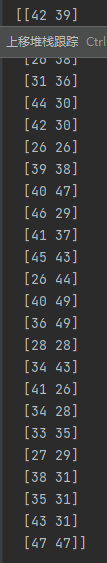
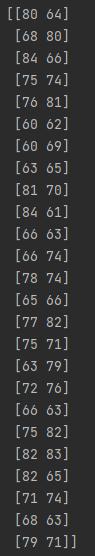
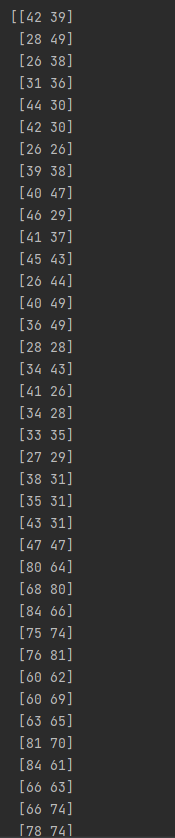
It is initialized to 25 rows and two columns. The range of X is 25-50 and the range of Y is 60-85.
X = np.random.randint(25,50,(25,2))
Y = np.random.randint(60,85,(25,2))
pts = np.vstack((X,Y))
# Initialization data
data = np.float32(pts)#Must be a floating point number data
print(data.shape)
Generated Y
pts = np.vstack((X,Y)) superimposes its two sets of data together
Define stop condition
criteria = (cv2.TERM_CRITERIA_EPS + cv2.TERM_CRITERIA_MAX_ITER, 10, 1.0)#Calculate 10 times and stop calculation when the difference is less than 1.0
ret,label,center=cv2.kmeans(data,2,None,criteria,2,cv2.KMEANS_RANDOM_CENTERS)
print(len(label))
print(center)
Get points with different labels. The label is 0 or 1
A = data[label.ravel()==0]
B = data[label.ravel()==1]
Finally draw the picture
plt.scatter(A[:,0],A[:,1])
plt.scatter(B[:,0],B[:,1],c = 'r')
plt.scatter(center[:,0],center[:,1],s = 80,c = 'y', marker = 's')
plt.xlabel('Height'),plt.ylabel('Weight')
plt.show()
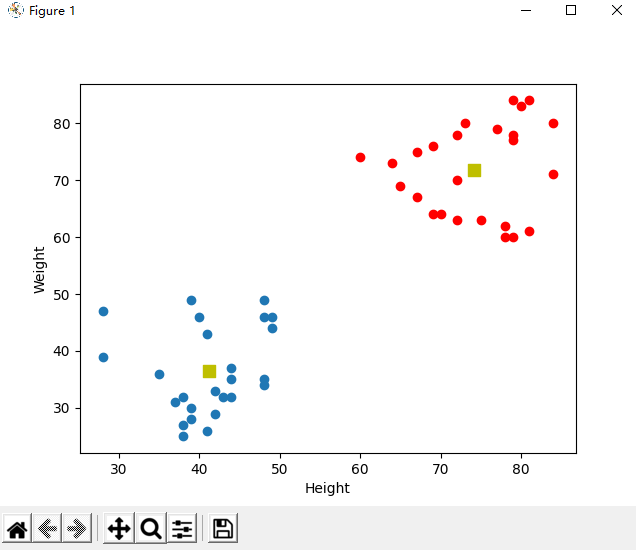
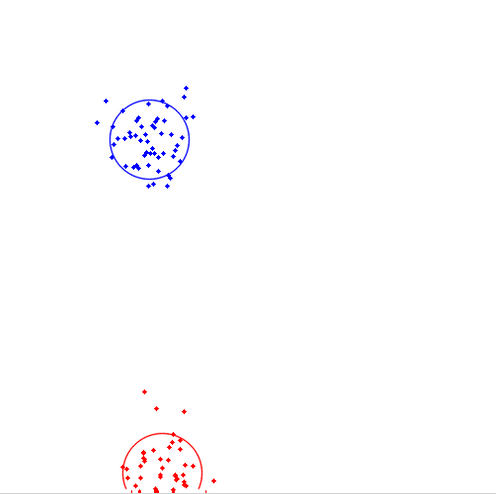
The classification results are shown in the figure
2.C + + version
Equivalent to the python version, the C + + version will be much different in writing. Let's start
#include <opencv2/opencv.hpp>
#include <iostream>
using namespace cv;
using namespace std;
int main(int argc, char** argv) {
	Mat img(500, 500, CV_8UC3);
	RNG rng(12345);

	Scalar colorTab[] = {
		Scalar(0, 0, 255),
		Scalar(255, 0, 0),
	};
int numCluster = 2;
	int sampleCount = rng.uniform(5, 500);
	Mat points(sampleCount, 1, CV_32FC2);

	// Generate random number
	for (int k = 0; k < numCluster; k++) {
		Point center;
		center.x = rng.uniform(0, img.cols);
		center.y = rng.uniform(0, img.rows);
		Mat pointChunk = points.rowRange(k*sampleCount / numCluster,
			k == numCluster - 1 ? sampleCount : (k + 1)*sampleCount / numCluster);
		rng.fill(pointChunk, RNG::NORMAL, Scalar(center.x, center.y), Scalar(img.cols*0.05, img.rows*0.05));
	}
	randShuffle(points, 1, &rng);
// Using KMeans
	Mat labels;
	Mat centers;
	kmeans(points, numCluster, labels, TermCriteria(TermCriteria::EPS + TermCriteria::COUNT, 10, 0.1), 3, KMEANS_PP_CENTERS, centers);
	//The sample data entered by points must be organized by line. Each line has one sample data, and the sample dimensions are listed; k represents the number of final classifications
	//bestlabels represents the label of each sample for final classification, criteria represents the stop condition for kmeans segmentation, and attempts represents the number of attempts to sample different initialization labels, which is generally equivalent to K
	//flag represents the center initialization method, and centers represents the center position of each cluster after final segmentation


	// Display categories in different colors
	img = Scalar::all(255);
	for (int i = 0; i < sampleCount; i++) {
		int index = labels.at<int>(i);
		Point p = points.at<Point2f>(i);
		circle(img, p, 2, colorTab[index], -1, 8);
	}

	// Circle is drawn at the center of each cluster
	for (int i = 0; i < centers.rows; i++) {
		int x = centers.at<float>(i, 0);
		int y = centers.at<float>(i, 1);
		printf("c.x= %d, c.y=%d", x, y);
		circle(img, Point(x, y), 40, colorTab[i], 1, LINE_AA);
	}

	imshow("KMeans-Data-Demo", img);
	waitKey(100000);
	return 0;
}