Introduction to Prometheus
Prometheus is an open source monitoring and alarm solution from SoundCloud. Like Kubernetes, Prometheus belongs to CNCF and is the second largest open source project after k8s. Prometheus provides a general data model and convenient data acquisition, storage and query interfaces. At the same time, the implementation based on Go also greatly reduces the operation and maintenance cost of the server. At present, it has supported a variety of service discovery mechanisms such as Kubernetes, Etcd and Consul.
Prometheus: monitor the running status of the service. Based on Prometheus rich Client library, users can easily add support for Prometheus in the application, so that users can obtain the real running status of the service and application.
-
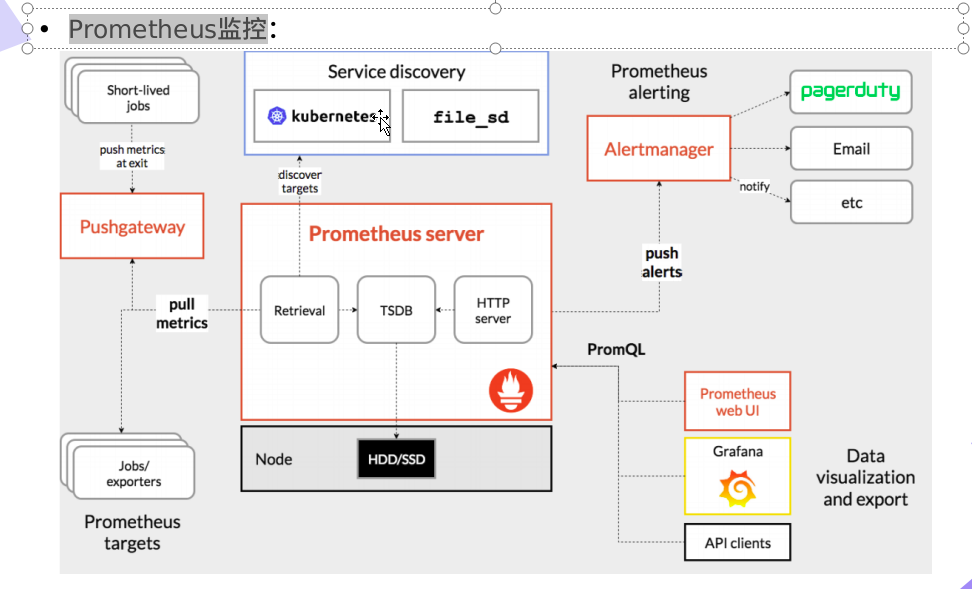
prometheus server: regularly pull data from statically configured targets or targets discovered by services (mainly DNS, consumer, k8s, mesos, etc.).
-
Exporters: the program system responsible for data reporting to prometheus server. Different data reporting is implemented by different exporters. For example, the monitoring host has node exporters and mysql has MySQL server exporter
-
pushgateway: the main usage scenarios are:
Prometheus adopts the pull mode. Prometheus may not be able to directly pull each target data because it is not in a subnet or firewall. When monitoring business data, it is necessary to summarize different data and collect them uniformly by Prometheus.
-
Alertmanager: realize the alarm function of prometheus.
-
web Ui: web Ui display is mainly realized through grafana.
I Prometheus deployed in k8s cluster
Pull the required warehouse first
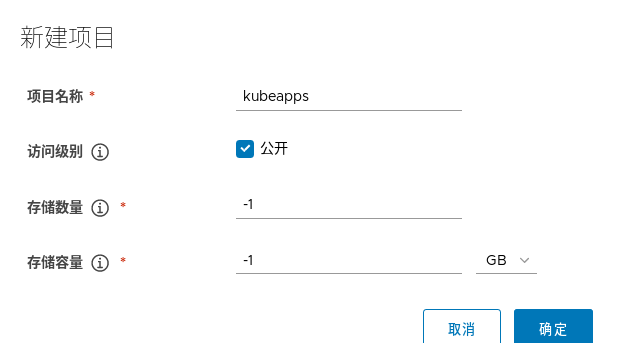
Create a new project kubeapps to upload images
helm pull apphub/prometheus-operator
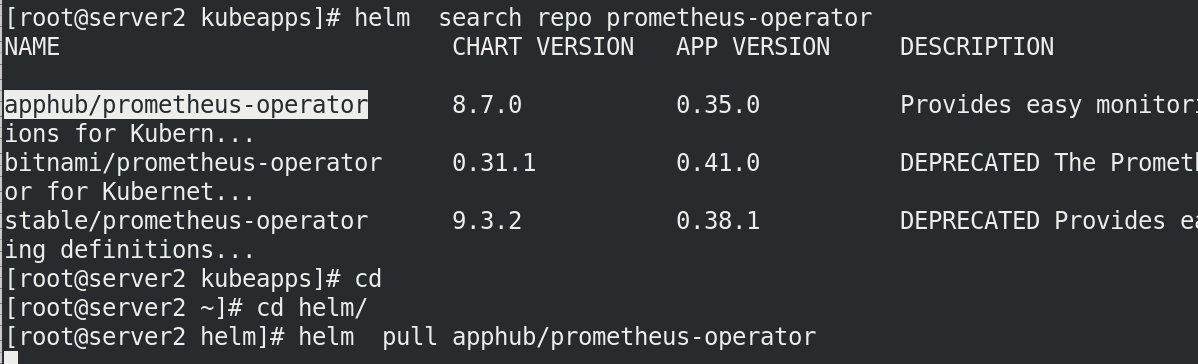
Pull down the compressed package, unpack it and enter the directory
tar zxf prometheus-operator-8.7.0.tgz
cd prometheus-operator/
ls

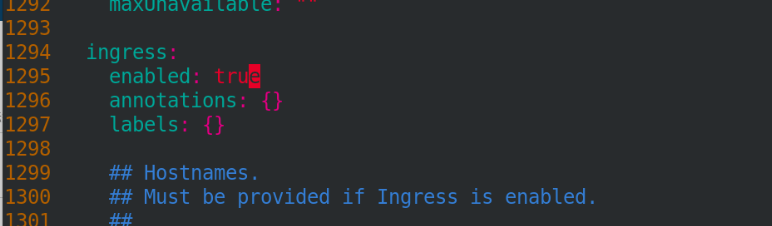
Modify first value.yaml
vim value.yaml
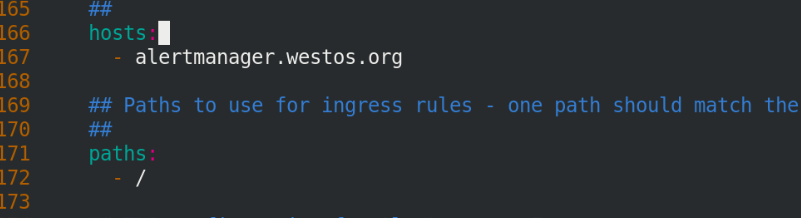
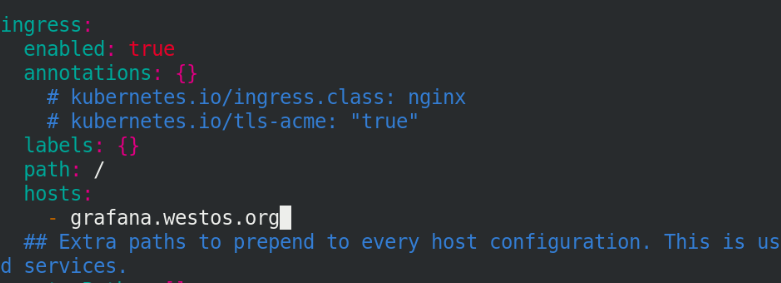
Open ingress service
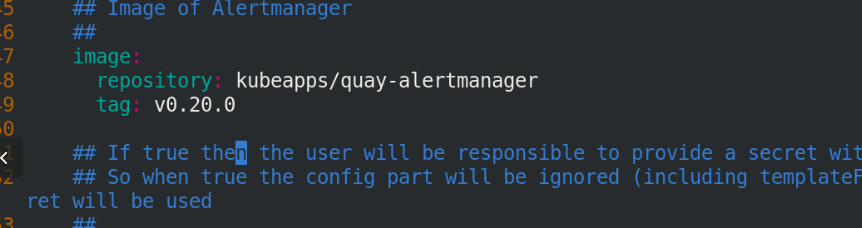
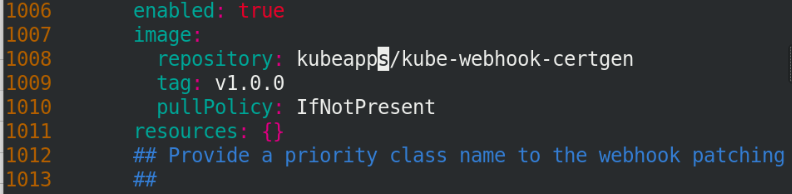
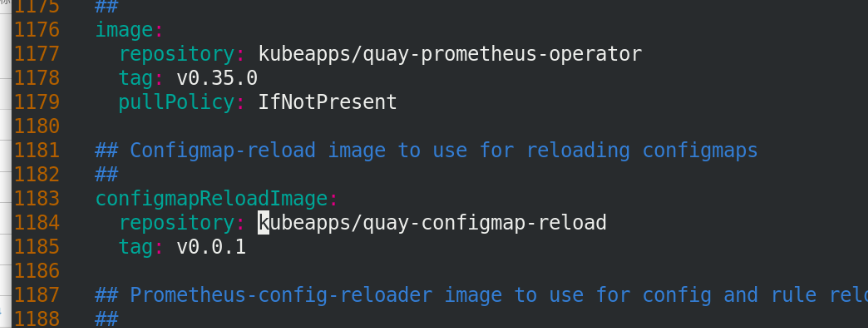
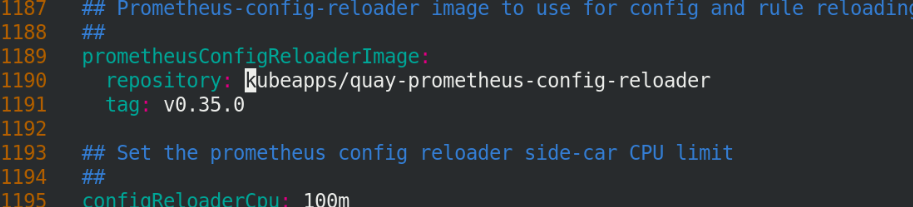
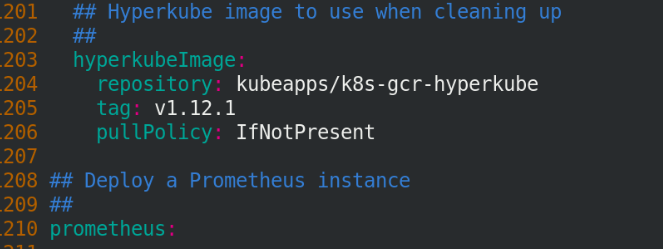
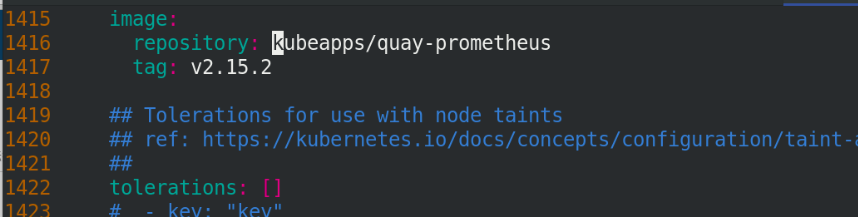
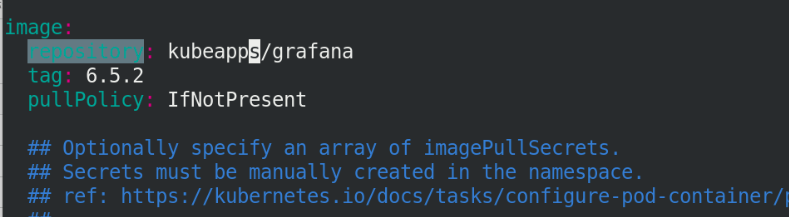
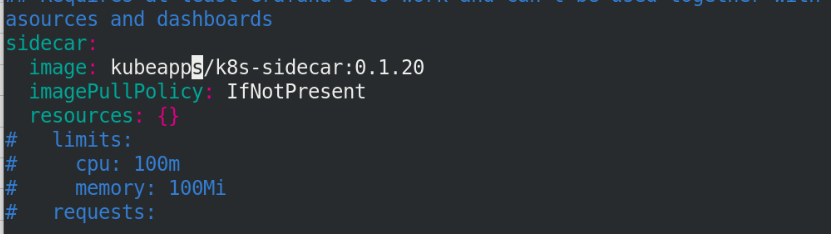
All image names are defined as kubeapps/
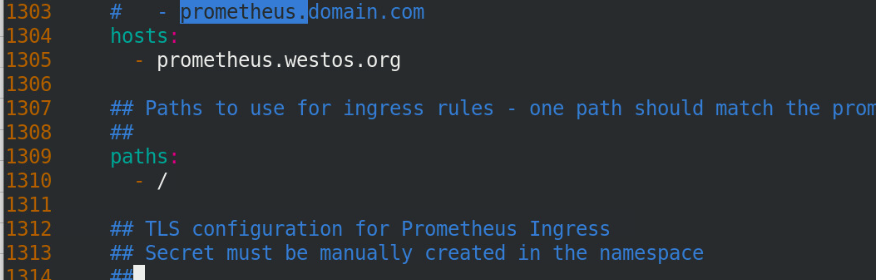
Add hosts
Note: all images in the file need to be pulled down and uploaded to the private warehouse, and the versions should be consistent one by one!!

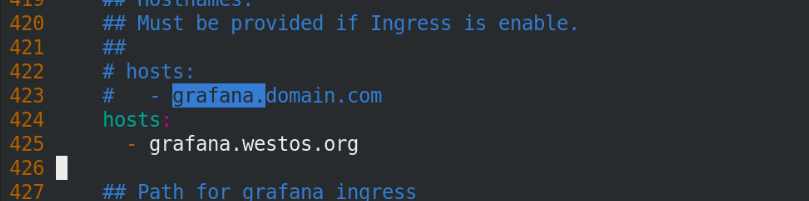
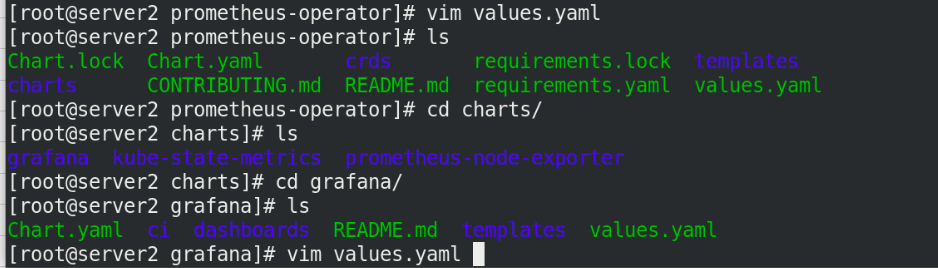
cd charts/
cd grafana/
vim values.yaml
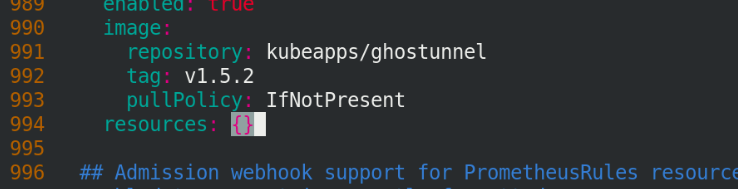
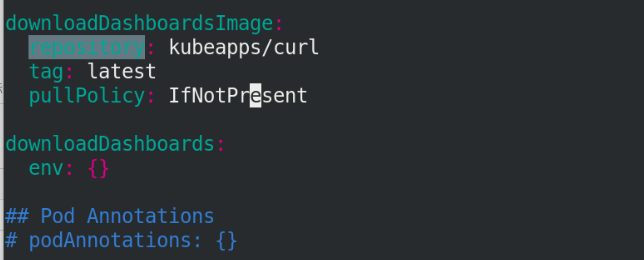
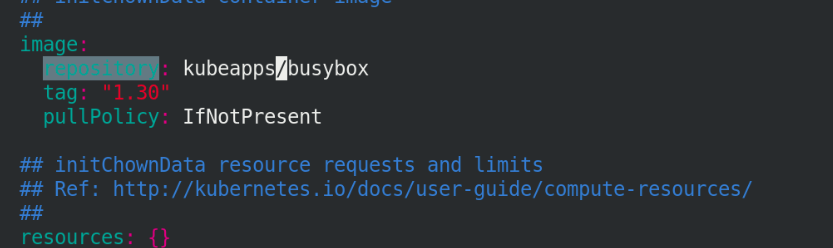
Change all mirrors to kubeapps/
And open ingress, as shown below
The images in the figure below need to be pulled by themselves. Pay attention to the version!!
Continue editing file
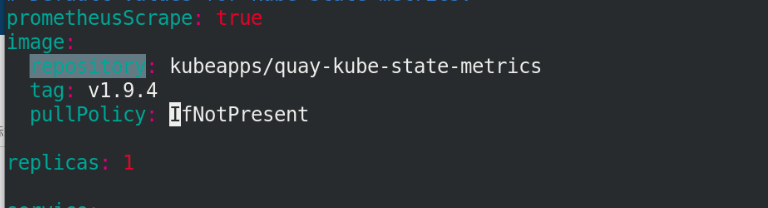
cd ..
cd kube-state-metrics/
vi values.yaml
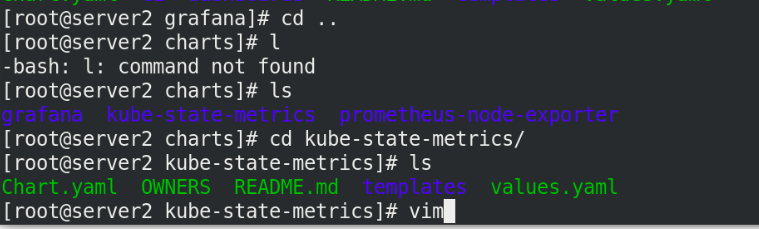
Just change an image and remember to pull it!
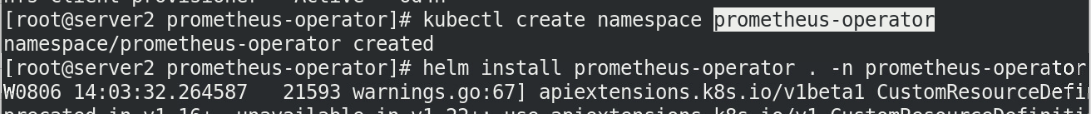
Create a namespace and specify the namespace installation
kubectl create namesapce prometheus-operator
helm install prometheus-operator . -n prometheus-operator
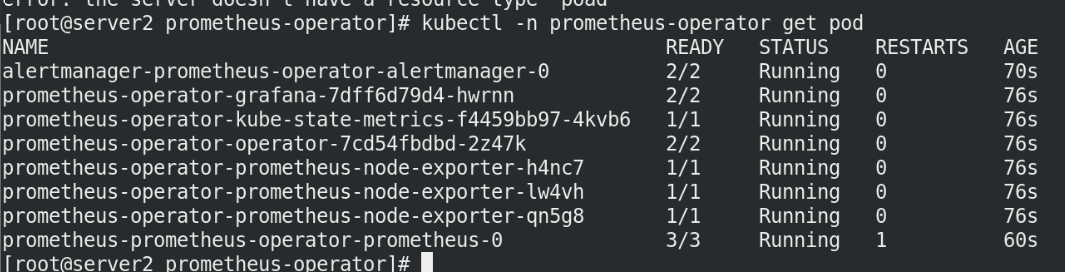
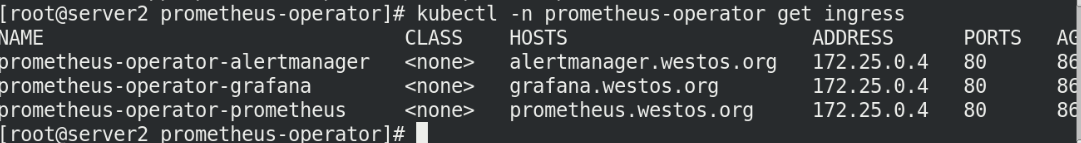
View the status and ingress status of the node
kubectl -n prometheus-operator get pod
kubectl -n prometheus-operator get ingress
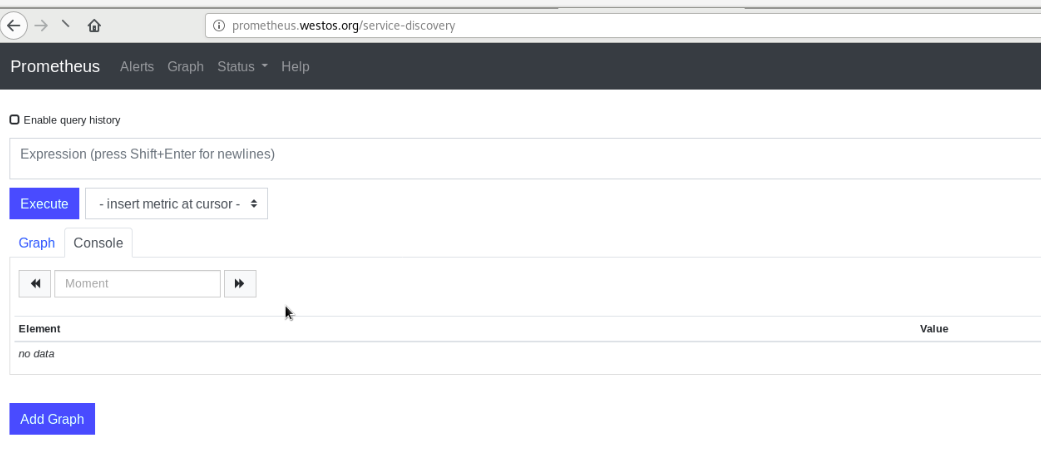
Then you can access the test on the web page
Remember to do local parsing
vim /etc/hosts
172.25.0.10 prometheus.westos.org granfana.westos.org

Enter the account password to log in!

II Prometheus monitoring application nginx
The previous article introduced how to build the graphical interface of helm:
First visit helm's graphical interface kubeapps westos. org
Search nginx first
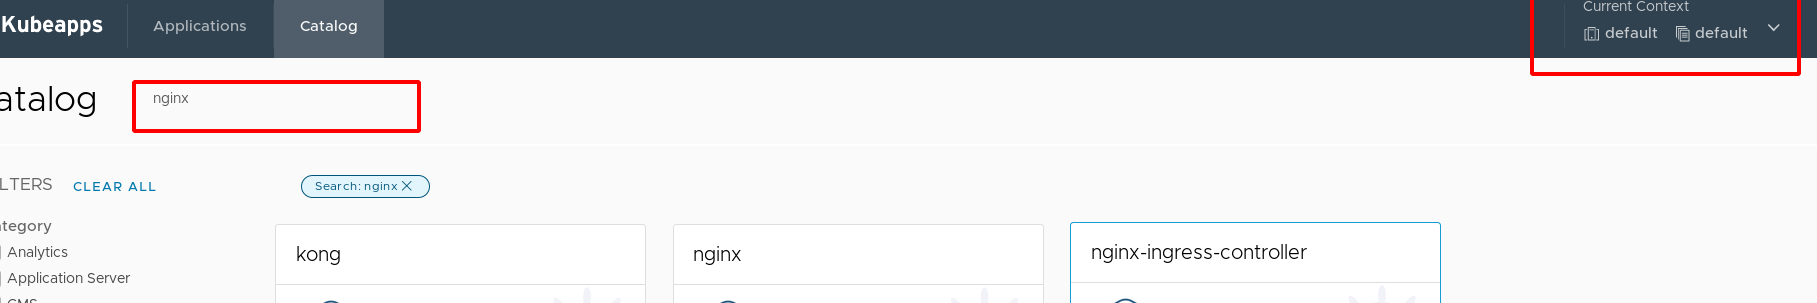
Then operate according to the following figure:
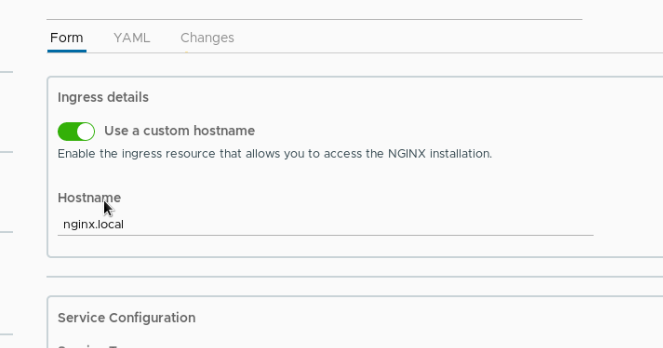
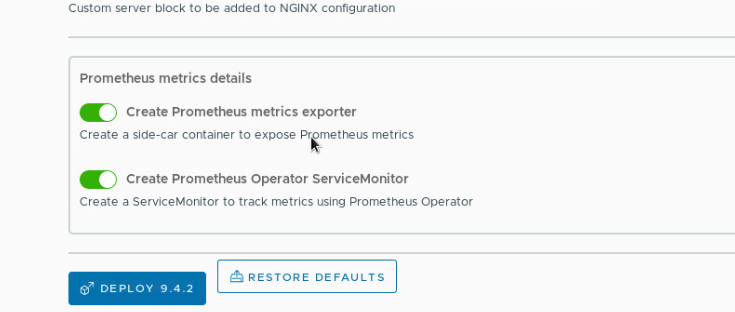
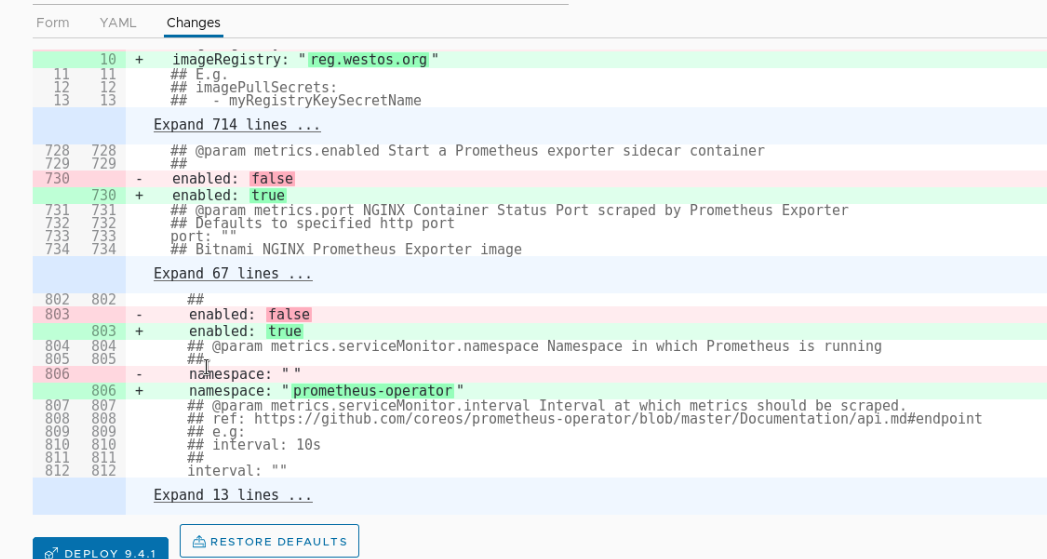
Modify the contents of yaml file:
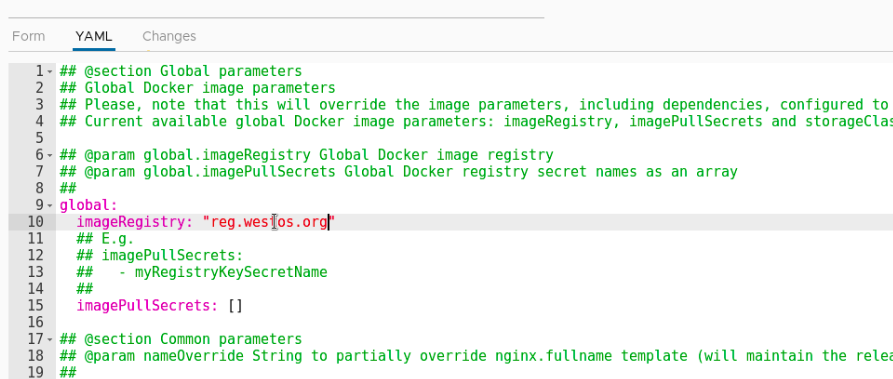
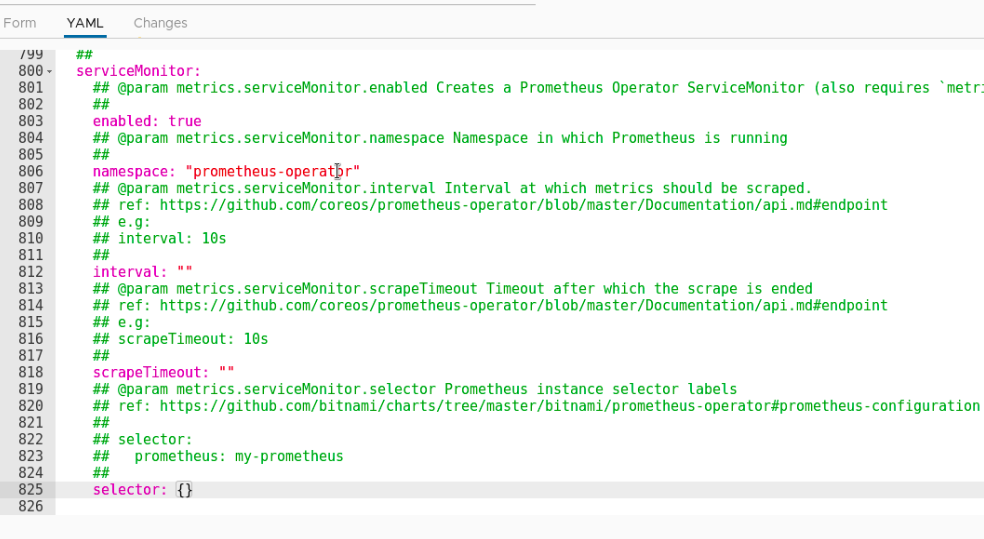
The content we just modified can be seen in changes, which is very detailed!!
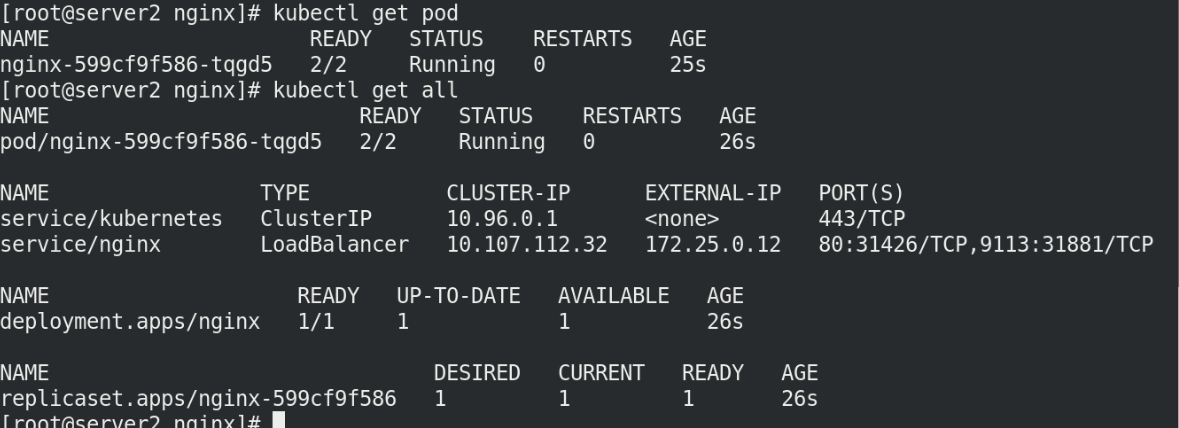
Test whether it is added successfully
kubectl get pod
kubectl get all
kubectl get svc
View svc assigned IP addresses
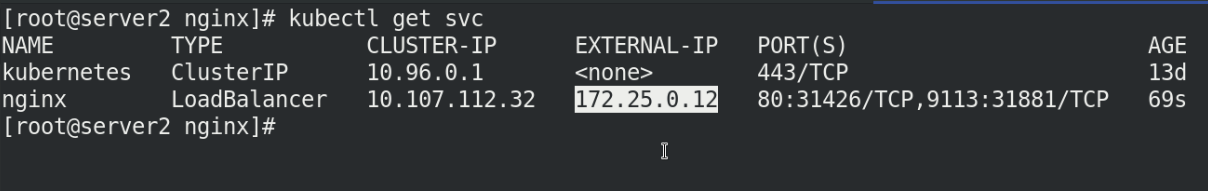
Visit the IP address and you can see the nginx release page!!
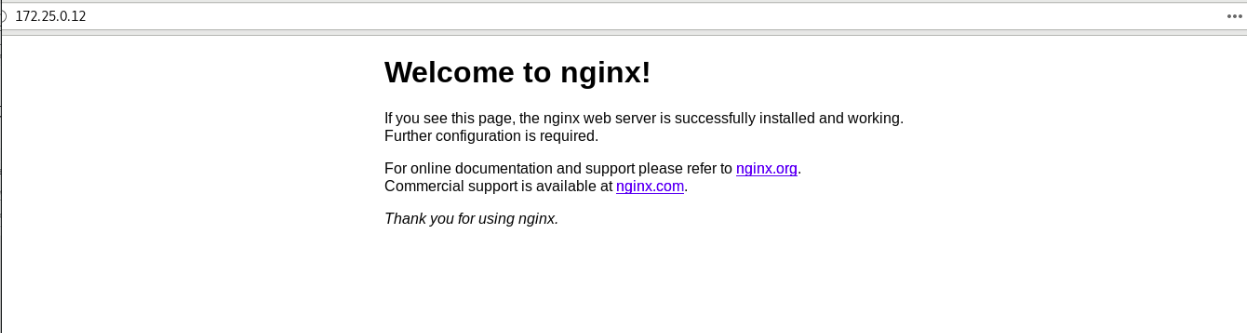
But!!
At this time, nginx cannot be found by prometheus because the corresponding label release = prometheus operator is not added
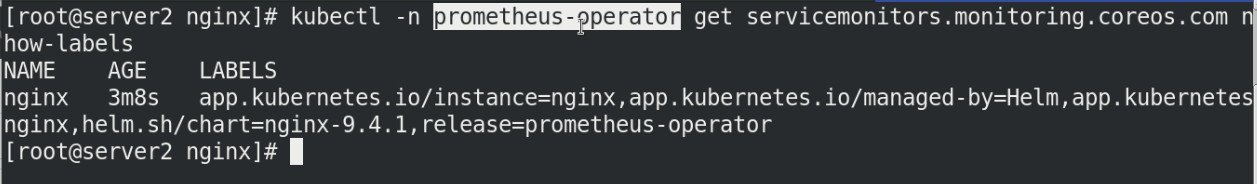
View and label nginx
kubectl -n prometheus-operator get servicemonitors.monitoring.coreos.com --show-labels

kubectl -n prometheus-operator label servicemonitors.monitoring.coreos.com nginx release=prometheus-operator

kubectl -n prometheus-operator get servicemonitors.monitoring.coreos.com nginx --show-labels

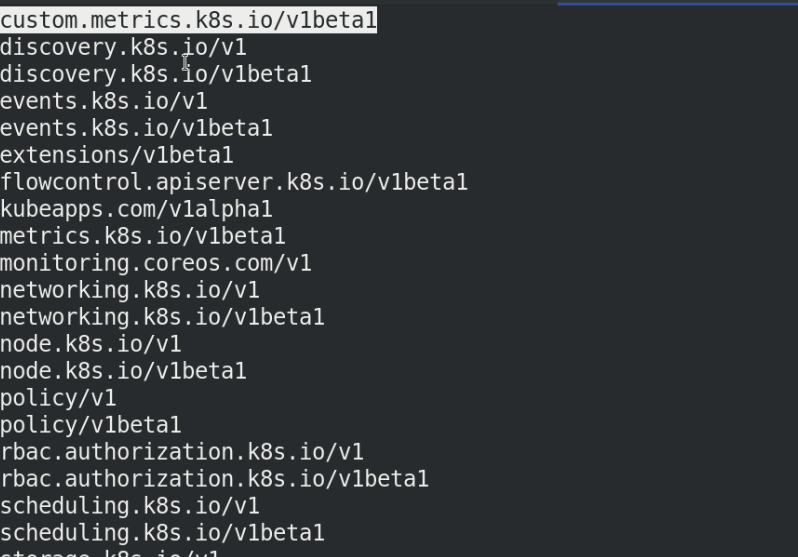
At this time, in Prometheus westos. The discovered nginx services can be seen in the Service Discovery in the status under. Org
The first line is nginx!!!
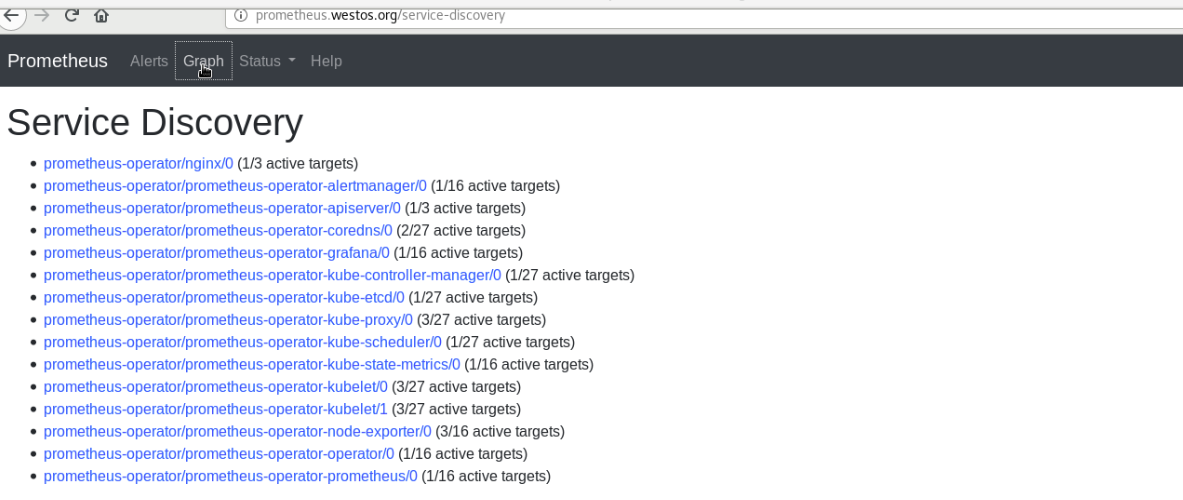
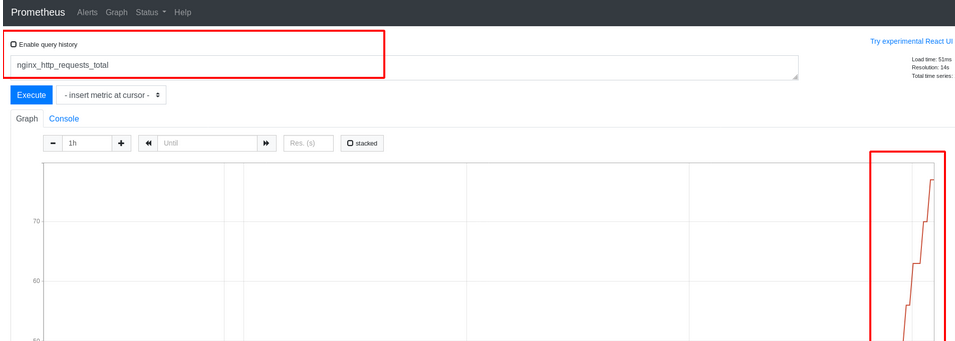
When you see the discovered services, click Graph to add Graph
You can see the graphics
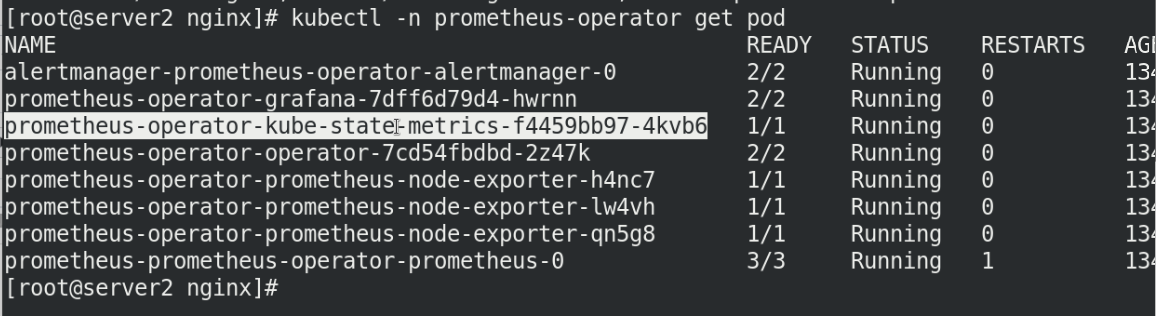
kubectl -n prometheus-operator get pod
III prometheus implements hpa dynamic scaling of k8s cluster
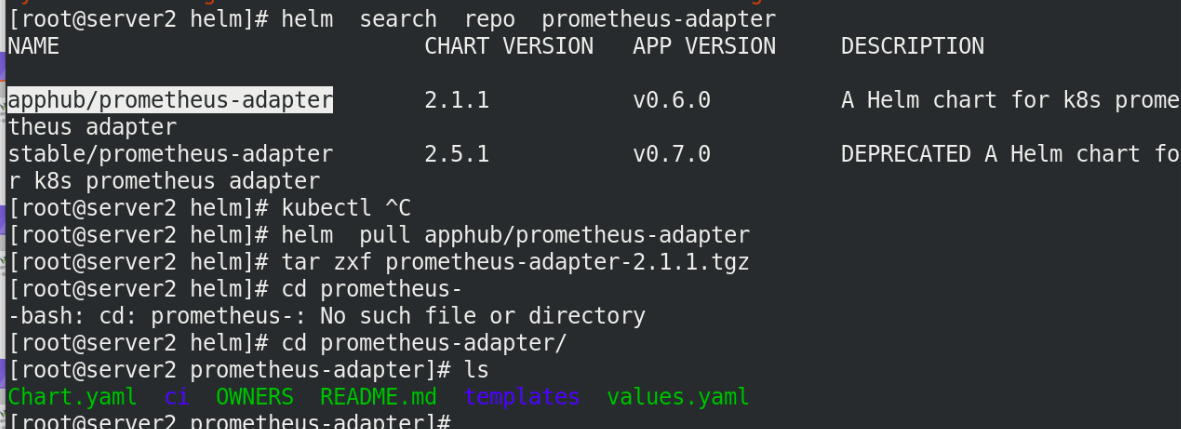
Add the Prometheus adapter plug-in
helm search repo prometheus-adapter
helm pull apphub/prometheus-adapter
tar zxf prometheus-adapter-2.1.1.tgz
cd prometheus-adapter/
ls
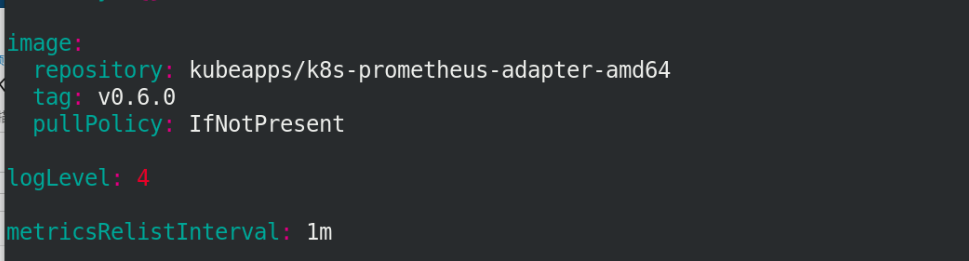
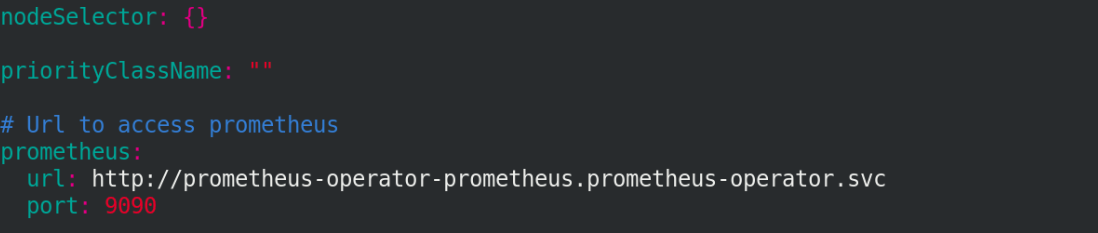
Edit values Yaml file to modify the image information
vim values.yaml
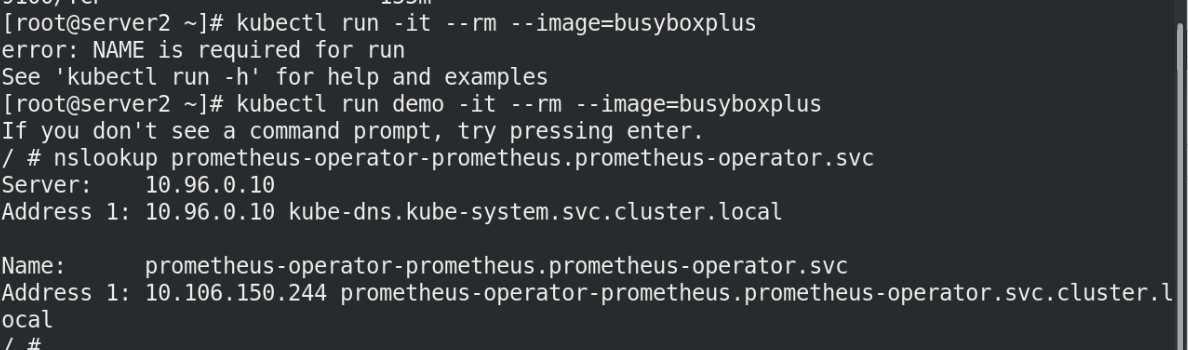
We can enter an image to see if it has resolution
kubectl run -it --rm --image=busyboxplus
nslookup prometheus-operator.prometheus-operator,svc
Specify namespace installation
helm install prometheus-adapter . -n prometheus-operator
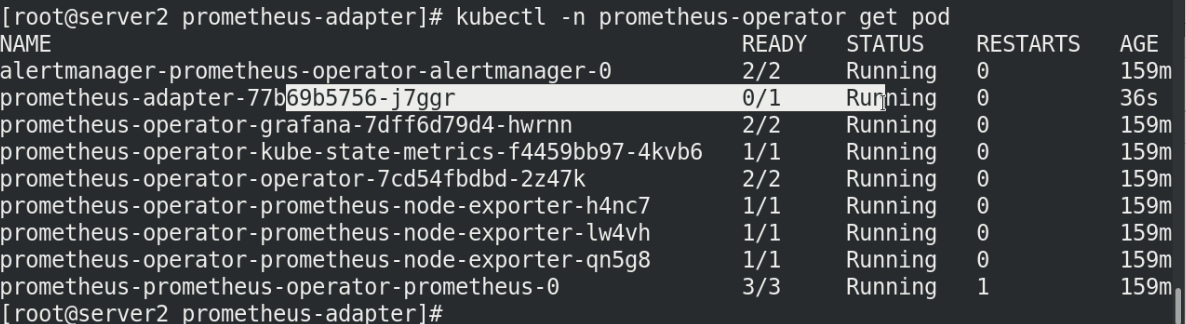
View monitoring information
kubectl get pod -n prometheus-operator
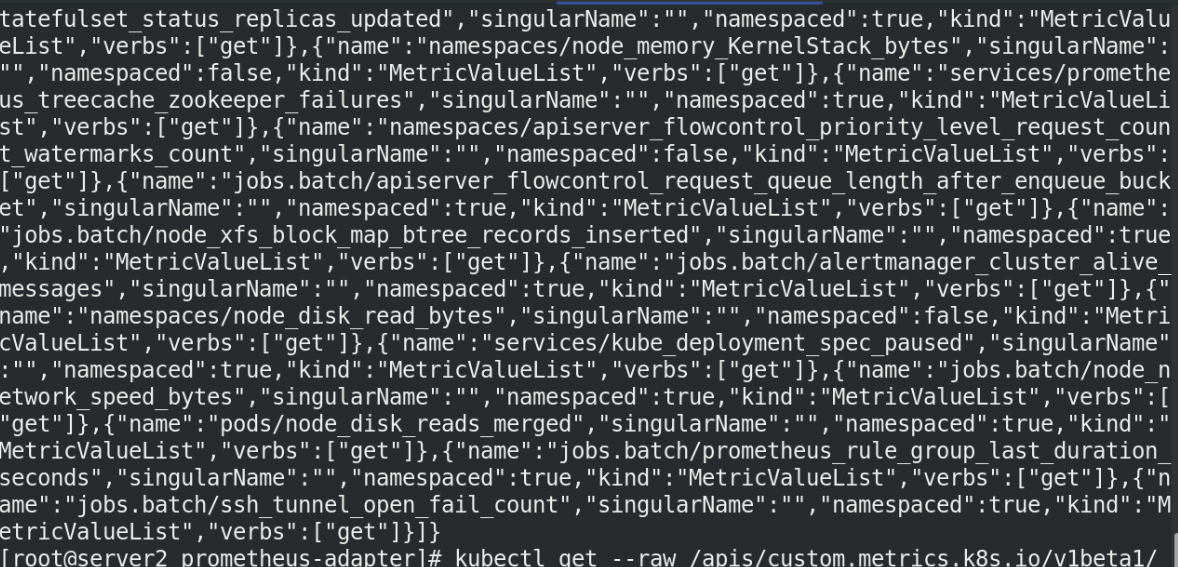
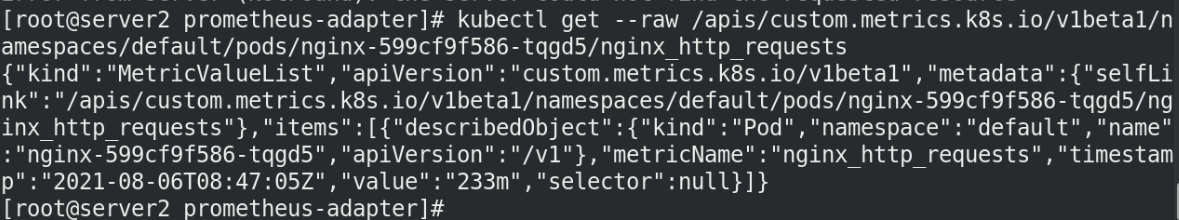
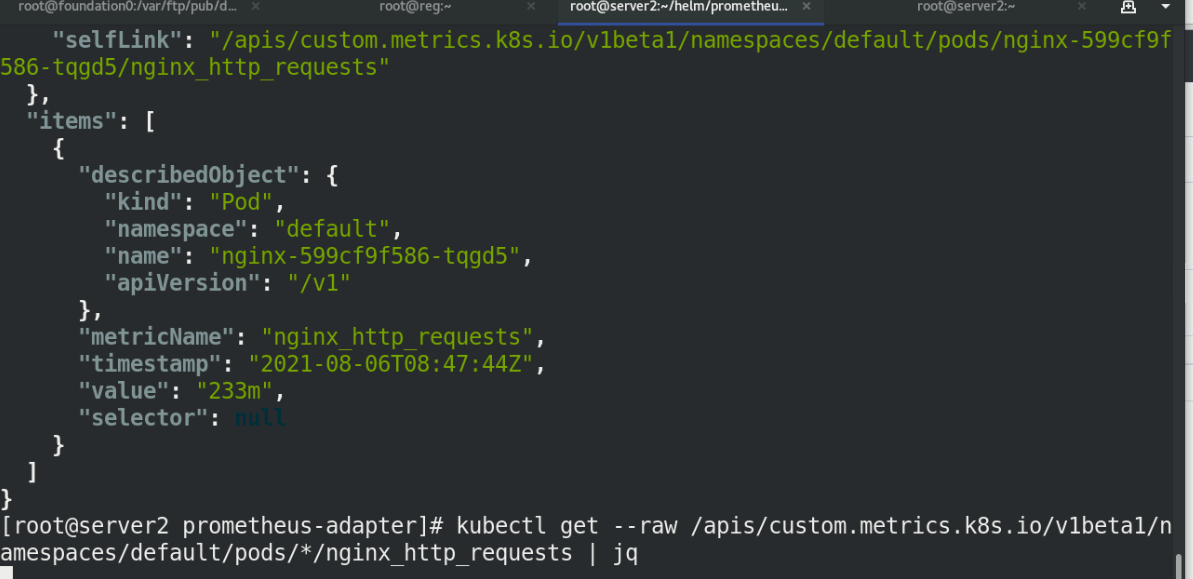
View nginx service details
kubectl get --raw /apis/custom.metrics.k8s.io/v1beta1/namespaces/default/pods/nginx-7dc5d5976-llz88/nginx_http_requests

Execute hpa file
kubectl apply -f hpa-nginx.yaml

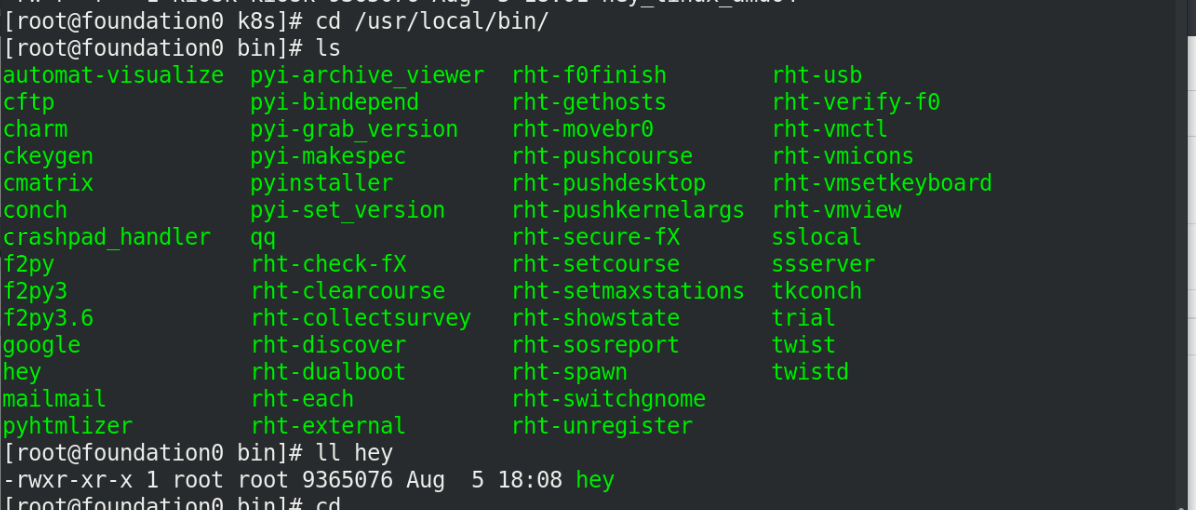
Use hey to access nginx and give pressure
Put the binary of hey in / usr/local/bin/
cp hey_linux_ad64 /usr/local/bin/

hey -n 10000 -c 5 -q 5 http://172.25.0.12/index.html

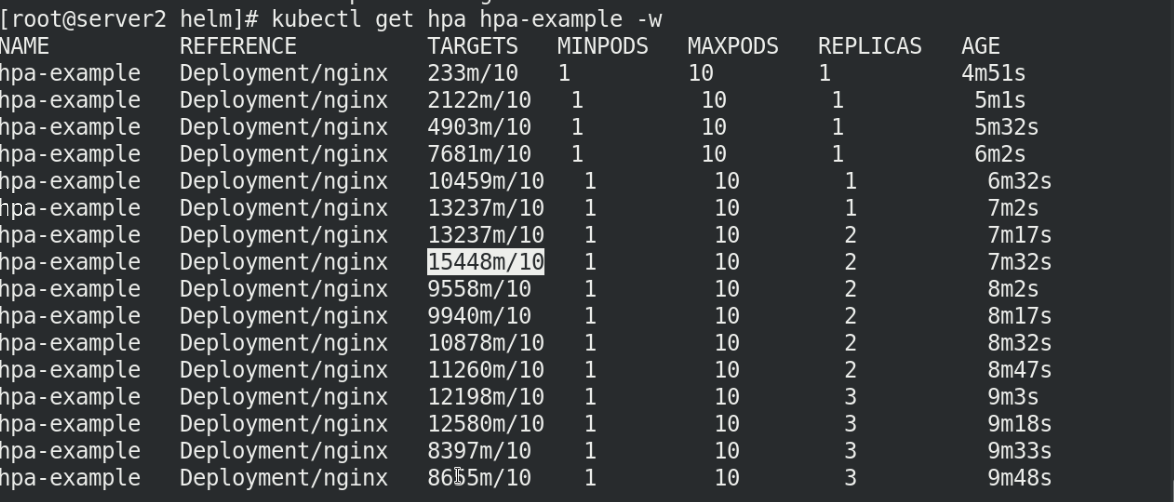
By continuously checking the hpa status, you can see that the cluster dynamically adds replicas according to the pressure to achieve dynamic scaling.
kubectl get hpa hpa-example -w
The pressure we give is 5 * 5 = 25. Each node can have 10 pods, so it can be stable after 3 replicas, as shown in the figure below!!