Monitoring system status
- preview contents
- 1 view system load
- 2. vmstat command
- 3. The top command displays the system resources occupied by the system process
- four.sar command monitoring system status
- 4.1 install sar command
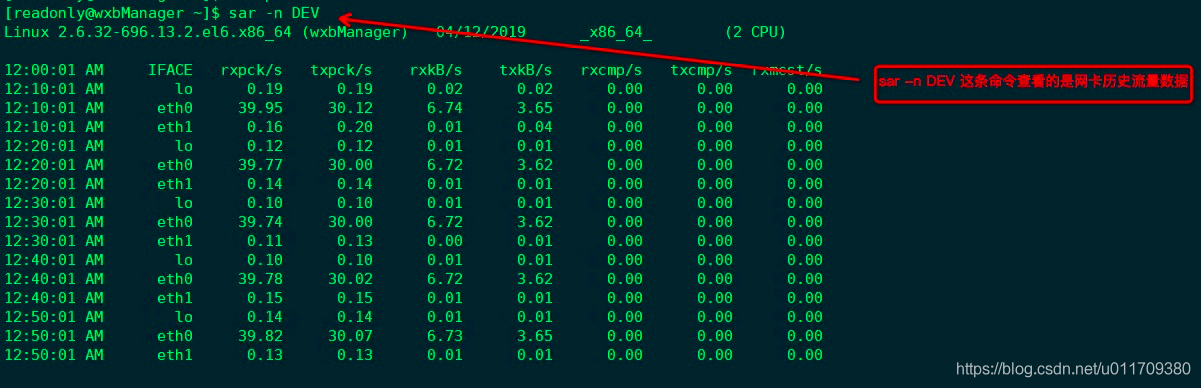
- 4.2 sar -n DEV viewing network card historical traffic
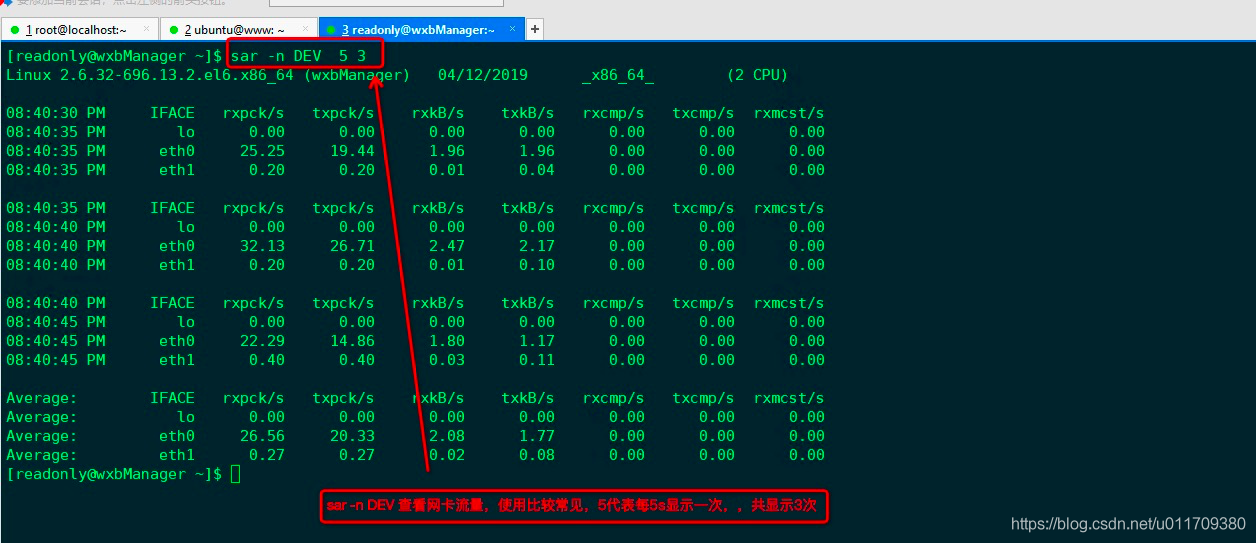
- 4.3 sar -n DEV 5 3 viewing real-time traffic of network card
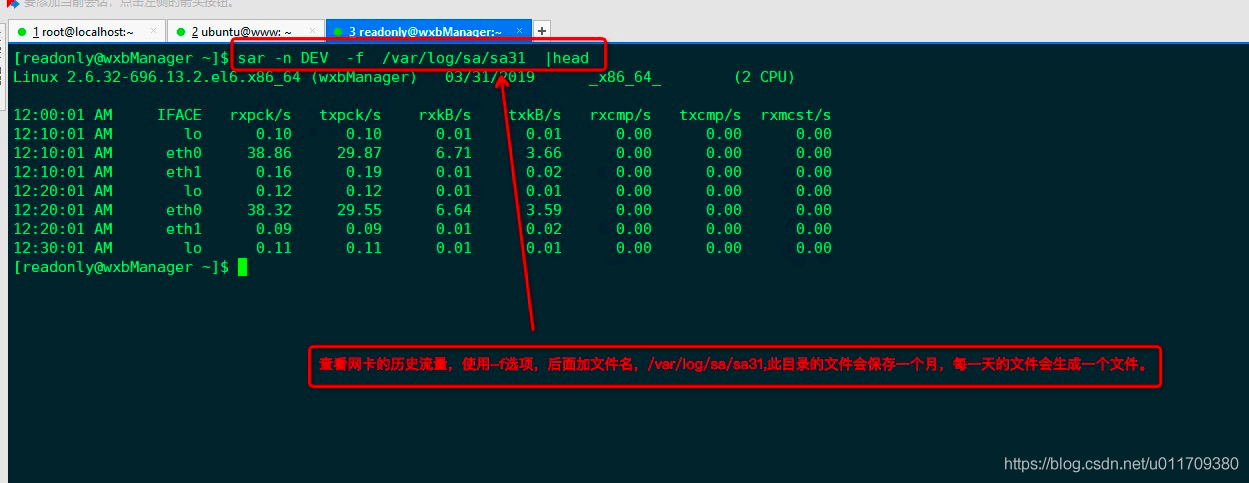
- 4.4 sar -n DEV -f view the historical traffic of the network card on a certain day
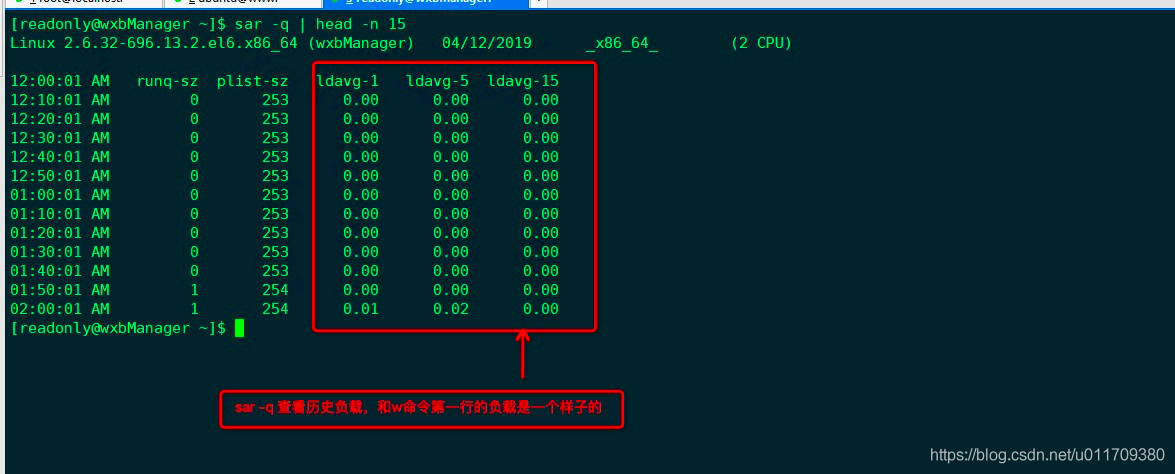
- 4.5 sar -q view historical load
- 4.6 view disk read and write
- 4.7 the file sa17 under / var / log / SA / is different from sar17
- 5. Use the nload command to view the network card traffic
- 6. Monitor io performance
- 7. free view memory
- 8. ps view system process
- 9. netstat view network status
- 10. Capturing packets under Linux
- 11.linux network related
- After class summary
preview contents
10.1 using w to view system load 10.2 vmstat command 10.3 top command 10.4 sar command 10.5 nload command 10.6 monitoring io performance 10.7 free command 10.8 ps command 10.9 viewing network status 10.10 capturing packets under Linux 10.11 Linux network related extend tcp three handshakes and four waves (key points) http://www.doc88.com/p-9913773 thirty-two 4388.html Several uses of tshark: http://www.aminglinux.com/bbs/thread-995-1-1.html
1 view system load
1.1 w command
[root@linux-01 ceshi]# w
 22:32:05 up 10 days, ,  2 users,  load average: 0.08, 0.03, 0.05
USER     TTY      FROM             LOGIN@   IDLE   JCPU   PCPU WHAT
root     pts/0    192.168.141.1    06:33    5.00s  0.41s  0.00s w
root     pts/2    192.168.141.1    I 17 15:56m  4.20s  4.20s -bash
state | meaning |
|---|---|
22:32:05 | time |
up 10 days,21:03 | System running time |
2 users | Number of users logged in to the system |
load average: 0.08, 0.03, 0.05 | Average load: the number of active processes of cpu in a unit time period. 0.08 represents the average load value in 1 minute, 0.03 represents the average load value in 5 minutes, and 0.05 represents the average load value in 15 minutes; The higher the value, the greater the pressure on the server. Generally, it doesn't matter as long as the value does not exceed the number of CPUs on the server. |
USER | Logged in user |
TTY | login terminal |
FROM | Remote host name |
LOGIN@ | login time |
IDLE | How long have you been free |
JCPU | Time spent connecting all processes with the terminal |
PCPU | Time consumed by the current process |
WHAT | Currently executing command |
Extension: the table above has submitted a number of CPUs. What is the number of CPUs? How to check the number of CPUs in linux system? Method 1: use cat command to view / proc/cpuinfo; Among the listed information, I need to check two keywords: processor and physical id. Processor represents the number of cpu cores of the machine. If it is 2, it represents 4-core cpu. physical id is to view how many physical CPUs there are in this machine. Method 2: use lscpu to view cpu information.
## How many servers are there cpu Methods of; cat /proc/cpuinfo ##
[root@linux-01 ceshi]# cat /proc/cpuinfo
processor	: 0
vendor_id	: GenuineIntel
cpu family	: 6
model		: sixty-one
model name	: Intel(R) Core(TM) i5-5300U CPU @ 2.30GHz
stepping	: 4
microcode	: 0x1f
cpu MHz		: 2294.709
cache size	: three thousand and seventy-two KB
physical id	: 0
siblings	: 1
core id		: 0
cpu cores	: 1
apicid		: 0
initial apicid	: 0
fpu		: yes
fpu_exception	: yes
cpuid level	: 20
wp		: yes
flags		: fpu vme de pse tsc msr pae mce cx8 apic sep mtrr pge mca cmov pat pse36 clflush mmx fxsr sse sse2 ss syscall nx pdpe1gb rdtscp lm constant_tsc arch_perfmon nopl xtopology tsc_reliable nonstop_tsc eagerfpu pni pclmulqdq ssse3 fma cx16 pcid sse4_1 sse4_2 x2apic movbe popcnt tsc_deadline_timer aes xsave avx f16c rdrand hypervisor lahf_lm abm 3dnowprefetch fsgsbase tsc_adjust bmi1 hle avx2 smep bmi2 invpcid rtm rdseed adx smap xsaveopt arat
bogomips	: 4589.41
clflush size	: 64
cache_alignment	: 64
address sizes	: 43 bits physical, 48 bits virtual
power management:

[root@linux-01 ceshi]#
## lscpu You can also view cpu information ##
[root@linux-01 ceshi]# lscpu
Architecture:          x86_64
CPU op-mode(s):        32-bit, 64-bit
Byte Order:            Little Endian
CPU(s):                1
On-line CPU(s) list:   0
Thread(s) per core:    1
Core(s) per socket:    1
 Seat:                 1
NUMA Node:         1
 manufacturer ID:            GenuineIntel
CPU Series:          6
 model:              61
 Model name:        Intel(R) Core(TM) i5-5300U CPU @ 2.30GHz
 Stepping:              4
CPU MHz:              2294.709
BogoMIPS:             4589.41
 Super manager manufacturer:  VMware
 Virtualization type:     completely
L1d Cache:          32K
L1i Cache:          32K
L2 Cache:           two hundred and fifty-six K
L3 Cache:           3072K
NUMA Node 0 CPU:     0
Flags:                 fpu vme de pse tsc msr pae mce cx8 apic sep mtrr pge mca cmov pat pse36 clflush mmx fxsr sse sse2 ss syscall nx pdpe1gb rdtscp lm constant_tsc arch_perfmon nopl xtopology tsc_reliable nonstop_tsc eagerfpu pni pclmulqdq ssse3 fma cx16 pcid sse4_1 sse4_2 x2apic movbe popcnt tsc_deadline_timer aes xsave avx f16c rdrand hypervisor lahf_lm abm 3dnowprefetch fsgsbase tsc_adjust bmi1 hle avx2 smep bmi2 invpcid rtm rdseed adx smap xsaveopt arat
[root@linux-01 ceshi]#
1.2 uptime command
## uptime The message displayed is w First line of information ##
[root@linux-01 ceshi]# uptime
 22:32:09 up 10 days, 21:03,  2 users,  load average: 0.08, 0.03, 0.05
[root@linux-01 ceshi]#
2. vmstat command
Command w can view the load information of the system, but it cannot judge where the system is under pressure. Therefore, vmstat command is used. The results displayed by vmstat command mainly include six parts: procs, memory, swap, io, system and cpu. The specific display results are as follows:
[root@linux-01 ceshi]# vmstat
procs -----------memory---------- ---swap-- -----io---- -system-- ------cpu-----
 r  b   swpd   free   buff  cache   si   so    bi    bo   in   cs us sy id wa st
 2  0      0 1514544   2200 192848    0    0     0     0   23   36  0  0 100  0  0
[root@linux-01 ceshi]#
category | project | meaning |
|---|---|---|
procs displays information about the process | r | run: indicates the number of processes running or waiting for cpu time slice. |
b | block: indicates the number of processes waiting for resources. This resource refers to I/O, memory, etc | |
Memory displays information about memory | swpd | Indicates the amount of memory in the swap partition, in kilobytes. |
free | Indicates the amount of free memory before a single, in KB. | |
buff | Indicates the cache size (to be written to disk), in KB. | |
cache | Indicates the cache size (read from disk), in kilobytes. | |
swap shows the memory exchange | si | Indicates the amount of data written to memory by the swap partition, in KB. |
so | Indicates the amount of data written to the swap partition by memory, in KB. | |
io displays the usage of the hard disk | bi | Indicates the amount of data read from the block device (read disk), in KB. |
bo | Indicates the amount of data written from the block device (to disk), in KB. | |
system displays the number of interrupts that occurred during the acquisition interval | in | Represents the number of device interrupts per second observed in a time interval |
cs | Indicates the number of context switches generated per second | |
cpu displays the usage status of the cpu | us | Displays the percentage of cpu time spent by the user |
sy | Displays the percentage of cpu time spent by the system | |
id | Indicates the percentage of cpu processing idle state | |
wa | Indicates the percentage of cpu time spent waiting for I/O | |
st | Indicates the percentage of cpu stolen (generally 0, don't pay attention) |
Note: always pay attention to the three columns r, b and wa. If the disk io pressure is high, the values of the bi and bo columns will be very high. In addition, when the values of the bi and bo columns are relatively high and constantly changing, it indicates that the memory is insufficient and the data in the memory is frequently exchanged to the exchange partition, which often has a great impact on the system performance.
## The following forms are usually used to view the system status ##
[root@linux-01 ceshi]# vmstat 1 5
procs -----------memory---------- ---swap-- -----io---- -system-- ------cpu-----
 r  b   swpd   free   buff  cache   si   so    bi    bo   in   cs us sy id wa st
 1  0      0 1514132   2200 192952    0    0     0     0   23   36  0  0 100  0  0
 0  0      0 1514132   2200 192952    0    0     0     0   23   35  0  0 100  0  0
 1  0      0 1514132   2200 192952    0    0     0     0   24   34  0  0 100  0  0
 0  0      0 1514132   2200 192952    0    0     0     0   23   37  0  0 100  0  0
 1  0      0 1514132   2200 192952    0    0     0     0   28   37  0  0 100  0  0

vmstat 1 5 express vmstat It is displayed every 1 second and output 5 times in total.
3. The top command displays the system resources occupied by the system process
Command w can view the load information of the system, and vmstat can view the information of the system. If a process occupies a high cpu rate, it involves the top command. The top command can display the cpu usage of the current system process, as shown below.
[root@linux-01 ceshi]# top
top - 02:26:23 up 11 days, 57 min,  2 users,  load average: 0.02, 0.03, 0.05
Tasks: 100 total,   1 running,  99 sleeping,   0 stopped,   0 zombie
%Cpu(s):  0.0 us,  0.3 sy,  0.0 ni, 99.7 id,  0.0 wa,  0.0 hi,  0.0 si,  0.0 st
KiB Mem :  1864248 total,  1513388 free,   155220 used,   195640 buff/cache
KiB Swap:  4194300 total,  4194300 free,        0 used.  1512100 avail Mem

   PID USER      PR  NI    VIRT    RES    SHR S %CPU %MEM     TIME+ COMMAND
  6321 root      20   0  227204   6464   5104 S  0.7  0.3  63:01.43 vmtoolsd
 17415 root      20   0       0      0      0 S  0.7  0.0   0:38.05 kworker/0:3
     1 root      20   0  128004   6548   4136 S  0.0  0.4   0:09.28 systemd
     2 root      20   0       0      0      0 S  0.0  0.0   0:00.11 kthreadd
     3 root      20   0       0      0      0 S  0.0  0.0   0:45.82 ksoftirqd/0
     5 root       0 -20       0      0      0 S  0.0  0.0   0:00.00 kworker/0:0H
     7 root      rt   0       0      0      0 S  0.0  0.0   0:00.00 migration/0
     8 root      20   0       0      0      0 S  0.0  0.0   0:00.00 rcu_bh
     9 root      20   0       0      0      0 S  0.0  0.0   0:35.09 rcu_sched
    10 root       0 -20       0      0      0 S  0.0  0.0   0:00.00 lru-add-drain
    11 root      rt   0       0      0      0 S  0.0  0.0   0:20.79 watchdog/0
    13 root      20   0       0      0      0 S  0.0  0.0   0:00.00 kdevtmpfs
    14 root       0 -20       0      0      0 S  0.0  0.0   0:00.00 netns
    15 root      20   0       0      0      0 S  0.0  0.0   0:00.58 khungtaskd
    16 root       0 -20       0      0      0 S  0.0  0.0   0:00.00 writeback
    17 root       0 -20       0      0      0 S  0.0  0.0   0:00.00 kintegrityd
    18 root       0 -20       0      0      0 S  0.0  0.0   0:00.00 bioset
    19 root       0 -20       0      0      0 S  0.0  0.0   0:00.00 bioset
    20 root       0 -20       0      0      0 S  0.0  0.0   0:00.00 bioset
    21 root       0 -20       0      0      0 S  0.0  0.0   0:00.00 kblockd
    22 root       0 -20       0      0      0 S  0.0  0.0   0:00.00 md
The first line of the top COMMAND is the same as that of the w COMMAND. The top COMMAND is used to dynamically monitor the system resources occupied by the process and refresh every 3 seconds. The top above prints a lot of information. We need to focus on the items% cpu,% mem and COMMAND. The RES item is the size of the system memory occupied by the process, and% MEM is the percentage of memory used. In the top state, press "M" to sort by memory usage, press "1" to list the usage of all core CPUs, and press "q" to exit top.
## top -c Yes, the path of the process is displayed ##
[readonly@wxbManager ~]$ top -c
top - 20:07:48 up 526 days, 23:35,  1 user,  load average: 0.02, 0.01, 0.00
Tasks: 112 total,   1 running, 111 sleeping,   0 stopped,   0 zombie
Cpu(s):  0.5%us,  0.5%sy,  0.0%ni, 99.0%id,  0.0%wa,  0.0%hi,  0.0%si,  0.0%st
Mem:   8189864k total,  6244516k used,  1945348k free,   384744k buffers
Swap:        0k total,        0k used,        0k free,  2419092k cached

  PID USER      PR  NI  VIRT  RES  SHR S %CPU %MEM    TIME+  COMMAND
 9273 root      20   0 79108 2128 1220 S  0.3  0.0 132:26.23 /usr/sbin/zabbix_agentd: active checks #1 [idle 1 sec]
28986 10beiMan  20   0 6888m 2.8g  15m S  0.3 36.2 411:52.18 /usr/java/jdk1.8.0_181/bin/java -Djava.util.logging.config.file=/home/10beiManager/tomcat/conf/logging.properties -Djava.util.l
    1 root      20   0 19340 1116  816 S  0.0  0.0   0:47.48 /sbin/init
    2 root      20   0     0    0    0 S  0.0  0.0   0:00.01 [kthreadd]
    3 root      RT   0     0    0    0 S  0.0  0.0   2:06.37 [migration/0]
    4 root      20   0     0    0    0 S  0.0  0.0   4:04.32 [ksoftirqd/0]
    5 root      RT   0     0    0    0 S  0.0  0.0   0:00.00 [stopper/0]
    6 root      RT   0     0    0    0 S  0.0  0.0   0:58.78 [watchdog/0]
    7 root      RT   0     0    0    0 S  0.0  0.0   2:58.54 [migration/1]
    8 root      RT   0     0    0    0 S  0.0  0.0   0:00.00 [stopper/1]
    9 root      20   0     0    0    0 S  0.0  0.0   5:45.23 [ksoftirqd/1]
   10 root      RT   0     0    0    0 S  0.0  0.0   0:52.23 [watchdog/1]
   11 root      20   0     0    0    0 S  0.0  0.0  30:35.79 [events/0]
   12 root      20   0     0    0    0 S  0.0  0.0 139:35.07 [events/1]
   13 root      20   0     0    0    0 S  0.0  0.0   0:00.00 [events/0]
   14 root      20   0     0    0    0 S  0.0  0.0   0:00.00 [events/1]
   15 root      20   0     0    0    0 S  0.0  0.0   0:00.00 [events_long/0]
   16 root      20   0     0    0    0 S  0.0  0.0   0:00.00 [events_long/1]
   17 root      20   0     0    0    0 S  0.0  0.0   0:00.00 [events_power_ef]
   18 root      20   0     0    0    0 S  0.0  0.0   0:00.00 [events_power_ef]
   19 root      20   0     0    0    0 S  0.0  0.0   0:00.00 [cgroup]
   20 root      20   0     0    0    0 S  0.0  0.0   0:00.00 [khelper]
   21 root      20   0     0    0    0 S  0.0  0.0   0:00.00 [netns]
   22 root      20   0     0    0    0 S  0.0  0.0   0:00.00 [async/mgr]
   23 root      20   0     0    0    0 S  0.0  0.0   0:00.00 [pm]
   24 root      20   0     0    0    0 S  0.0  0.0   0:00.00 [xenwatch]
## top -bn1 You can output the process information at one time. It is not dynamic information. It is mostly used in scripts ##
[root@linux-01 ceshi]# top -bn1
top - 02:37:01 up 11 days, 1:08, 2 users, load average: 0.00, 0.01, 0.05
Tasks: 100 total, 1 running, 99 sleeping, 0 stopped, 0 zombie
%Cpu(s): 0.0 us, 0.0 sy, 0.0 ni,100.0 id, 0.0 wa, 0.0 hi, 0.0 si, 0.0 st
KiB Mem : 1864248 total, 1513364 free, 155252 used, 195632 buff/cache
KiB Swap: 4194300 total, 4194300 free, 0 used. 1512080 avail Mem
PID USER PR NI VIRT RES SHR S %CPU %MEM TIME+ COMMAND
1 root 20 0 128004 6548 4136 S 0.0 0.4 0:09.28 systemd
2 root 20 0 0 0 0 S 0.0 0.0 0:00.11 kthreadd
3 root 20 0 0 0 0 S 0.0 0.0 0:45.86 ksoftirqd/0
5 root 0 -20 0 0 0 S 0.0 0.0 0:00.00 kworker/0:0H
7 root rt 0 0 0 0 S 0.0 0.0 0:00.00 migration/0
8 root 20 0 0 0 0 S 0.0 0.0 0:00.00 rcu_bh
9 root 20 0 0 0 0 S 0.0 0.0 0:35.12 rcu_sched
10 root 0 -20 0 0 0 S 0.0 0.0 0:00.00 lru-add-drain
11 root rt 0 0 0 0 S 0.0 0.0 0:20.80 watchdog/0
13 root 20 0 0 0 0 S 0.0 0.0 0:00.00 kdevtmpfs
14 root 0 -20 0 0 0 S 0.0 0.0 0:00.00 netns
15 root 20 0 0 0 0 S 0.0 0.0 0:00.58 khungtaskd
16 root 0 -20 0 0 0 S 0.0 0.0 0:00.00 writeback
17 root 0 -20 0 0 0 S 0.0 0.0 0:00.00 kintegrityd
18 root 0 -20 0 0 0 S 0.0 0.0 0:00.00 bioset
19 root 0 -20 0 0 0 S 0.0 0.0 0:00.00 bioset
20 root 0 -20 0 0 0 S 0.0 0.0 0:00.00 bioset
21 root 0 -20 0 0 0 S 0.0 0.0 0:00.00 kblockd
22 root 0 -20 0 0 0 S 0.0 0.0 0:00.00 md
23 root 0 -20 0 0 0 S 0.0 0.0 0:00.00 edac-poller
24 root 0 -20 0 0 0 S 0.0 0.0 0:00.00 watchdogd
30 root 20 0 0 0 0 S 0.0 0.0 0:00.00 kswapd0
31 root 25 5 0 0 0 S 0.0 0.0 0:00.00 ksmd
32 root 39 19 0 0 0 S 0.0 0.0 0:07.99 khugepaged
33 root 0 -20 0 0 0 S 0.0 0.0 0:00.00 crypto
41 root 0 -20 0 0 0 S 0.0 0.0 0:00.00 kthrotld
43 root 0 -20 0 0 0 S 0.0 0.0 0:00.00 kmpath_rdacd
44 root 0 -20 0 0 0 S 0.0 0.0 0:00.00 kaluad
45 root 0 -20 0 0 0 S 0.0 0.0 0:00.00 kpsmoused
47 root 0 -20 0 0 0 S 0.0 0.0 0:00.00 ipv6_addrconf
60 root 0 -20 0 0 0 S 0.0 0.0 0:00.00 deferwq
91 root 20 0 0 0 0 S 0.0 0.0 0:00.01 kauditd
1644 root 0 -20 0 0 0 S 0.0 0.0 0:00.00 nfit
1666 root 0 -20 0 0 0 S 0.0 0.0 0:00.00 mpt_poll_0
1670 root 0 -20 0 0 0 S 0.0 0.0 0:00.00 mpt/0
1671 root 0 -20 0 0 0 S 0.0 0.0 0:00.00 ata_sff
1716 root 20 0 0 0 0 S 0.0 0.0 0:00.00 scsi_eh_0
1722 root 0 -20 0 0 0 S 0.0 0.0 0:00.00 scsi_tmf_0
1747 root 20 0 0 0 0 S 0.0 0.0 0:00.01 scsi_eh_1
1748 root 0 -20 0 0 0 S 0.0 0.0 0:00.00 scsi_tmf_1
1750 root 20 0 0 0 0 S 0.0 0.0 0:00.00 scsi_eh_2
1757 root 0 -20 0 0 0 S 0.0 0.0 0:00.00 scsi_tmf_2
1899 root 0 -20 0 0 0 S 0.0 0.0 0:00.00 ttm_swap
1901 root -51 0 0 0 0 S 0.0 0.0 0:00.00 irq/16-vmwgfx
2900 root 0 -20 0 0 0 S 0.0 0.0 0:00.00 bioset
2905 root 0 -20 0 0 0 S 0.0 0.0 0:00.00 xfsalloc
2910 root 0 -20 0 0 0 S 0.0 0.0 0:00.00 xfs_mru_cache
2913 root 0 -20 0 0 0 S 0.0 0.0 0:00.00 xfs-buf/sda3
2916 root 0 -20 0 0 0 S 0.0 0.0 0:00.00 xfs-data/sda3
2919 root 0 -20 0 0 0 S 0.0 0.0 0:00.00 xfs-conv/sda3
2920 root 0 -20 0 0 0 S 0.0 0.0 0:00.00 xfs-cil/sda3
2921 root 0 -20 0 0 0 S 0.0 0.0 0:00.00 xfs-reclaim/sda
2922 root 0 -20 0 0 0 S 0.0 0.0 0:00.00 xfs-log/sda3
2923 root 0 -20 0 0 0 S 0.0 0.0 0:00.00 xfs-eofblocks/s
2924 root 20 0 0 0 0 S 0.0 0.0 0:14.38 xfsaild/sda3
2925 root 0 -20 0 0 0 S 0.0 0.0 0:08.96 kworker/0:1H
2992 root 20 0 39076 4472 4144 S 0.0 0.2 0:02.26 systemd-journal
3009 root 20 0 340348 8048 2620 S 0.0 0.4 0:00.01 lvmetad
3027 root 20 0 48208 5700 2864 S 0.0 0.3 0:00.73 systemd-udevd
4848 root 0 -20 0 0 0 S 0.0 0.0 0:00.00 kdmflush
4854 root 0 -20 0 0 0 S 0.0 0.0 0:00.00 bioset
4861 root 0 -20 0 0 0 S 0.0 0.0 0:00.00 xfs-buf/sda1
4863 root 0 -20 0 0 0 S 0.0 0.0 0:00.00 xfs-data/sda1
4867 root 0 -20 0 0 0 S 0.0 0.0 0:00.00 xfs-conv/sda1
4868 root 0 -20 0 0 0 S 0.0 0.0 0:00.00 xfs-cil/sda1
4873 root 0 -20 0 0 0 S 0.0 0.0 0:00.00 xfs-reclaim/sda
4878 root 0 -20 0 0 0 S 0.0 0.0 0:00.00 xfs-log/sda1
4879 root 0 -20 0 0 0 S 0.0 0.0 0:00.00 xfs-eofblocks/s
4882 root 20 0 0 0 0 S 0.0 0.0 0:00.00 xfsaild/sda1
4966 root 0 -20 0 0 0 S 0.0 0.0 0:00.00 kworker/u257:0
4973 root 0 -20 0 0 0 S 0.0 0.0 0:00.00 hci0
4975 root 0 -20 0 0 0 S 0.0 0.0 0:00.00 hci0
4980 root 0 -20 0 0 0 S 0.0 0.0 0:00.00 kworker/u257:2
6161 root 16 -4 62044 1080 496 S 0.0 0.1 0:02.77 auditd
6309 root 20 0 26376 1752 1440 S 0.0 0.1 0:02.92 systemd-logind
6312 polkitd 20 0 613000 11908 4920 S 0.0 0.6 0:00.48 polkitd
6319 root 20 0 99572 6112 4504 S 0.0 0.3 0:00.07 VGAuthService
6321 root 20 0 227204 6464 5104 S 0.0 0.3 63:03.15 vmtoolsd
6325 dbus 20 0 66460 2584 1896 S 0.0 0.1 0:02.08 dbus-daemon
6417 root 20 0 126280 1692 1068 S 0.0 0.1 0:03.74 crond
6456 root 20 0 110092 860 728 S 0.0 0.0 0:00.01 agetty
6465 root 20 0 358512 29324 7184 S 0.0 1.6 0:01.21 firewalld
6519 root 20 0 473892 8616 6648 S 0.0 0.5 0:30.74 NetworkManager
6965 root 20 0 573820 17112 6036 S 0.0 0.9 3:29.09 tuned
6967 root 20 0 112756 4352 3328 S 0.0 0.2 0:00.07 sshd
6968 root 20 0 220612 7824 4444 S 0.0 0.4 2:05.77 rsyslogd
7260 root 20 0 89544 2180 1148 S 0.0 0.1 0:07.78 master
7266 postfix 20 0 89716 4092 3088 S 0.0 0.2 0:01.19 qmgr
12649 root 20 0 158760 5588 4240 S 0.0 0.3 0:11.17 sshd
1 two hundred and sixty-five 3 root 20 0 116212 3088 1844 S 0.0 0.2 0:04.20 bash
14479 root 20 0 0 0 0 S 0.0 0.0 0:02.59 kworker/u256:2
16324 root 20 0 0 0 0 S 0.0 0.0 0:02.04 kworker/u256:0
16555 root 20 0 158760 5608 4256 S 0.0 0.3 0:01.57 sshd
16559 root 20 0 116228 2996 1792 S 0.0 0.2 0:00.48 bash
17415 root 20 0 0 0 0 S 0.0 0.0 0:40.42 kworker/0:3
17426 postfix 20 0 89648 4068 3068 S 0.0 0.2 0:00.02 pickup
17474 root 20 0 123260 780 552 S 0.0 0.0 0:00.00 anacron
17491 root 20 0 0 0 0 S 0.0 0.0 0:00.02 kworker/0:1
17492 root 20 0 0 0 0 S 0.0 0.0 0:00.01 kworker/0:0
17500 root 20 0 161880 2108 1548 R 0.0 0.1 0:00.04 top
[root@linux-01 ceshi]# 4.sar command monitoring system status
4.1 install sar command
## install sar command ##
[root@linux-01 ceshi]# yum install  -y sysstat
 Plug in loaded: fastestmirror
Repository base is listed more than once in the configuration
Repository updates is listed more than once in the configuration
Repository extras is listed more than once in the configuration
Repository centosplus is listed more than once in the configuration
Determining fastest mirrors
epel/x86_64/metalink                                                                                              | 4.7 kB  00:00:00
 * base: mirrors.163.com
 * epel: mirrors.tuna.tsinghua.edu.cn
 * extras: mirrors.cn99.com
 * updates: mirrors.nju.edu.cn
base                                                                                                              | 3.6 kB  00:00:00
epel                                                                                                              | 4.7 kB  00:00:00
extras                                                                                                            | 3.4 kB  00:00:00
updates                                                                                                           | 3.4 kB  00:00:00
(1/4): epel/x86_64/updateinfo                                                                                     | 986 kB  00:00:00
(2/4): extras/7/x86_64/primary_db                                                                                 | 187 kB  00:00:00
(3/4): epel/x86_64/primary_db                                                                                     | 6.7 MB  00:00:02
(4/4): updates/7/x86_64/primary_db                                                                                | 3.4 MB  00:00:02
Resolving dependencies
--> Checking transactions
---> software package sysstat.x86_64.0.10.1.5-17.el7 Will be installed
--> Processing dependencies libsensors.so.4()(64bit),It is a software package sysstat-10.1.5-17.el7.x86_64 need
--> Checking transactions
---> software package lm_sensors-libs.x86_64.0.3.4.0-6.20160601gitf9185e5.el7 Will be installed
--> Resolve dependency complete

Dependency resolution

=========================================================================================================================================
 Package                          framework                    edition                                               source                     size
=========================================================================================================================================
Installing:
 sysstat                          x86_64                  10.1.5-17.el7                                      base                  315 k
 Install for dependency:
 lm_sensors-libs                  x86_64                  3.4.0-6.20160601gitf9185e5.el7                     base                   42 k

Transaction summary
=========================================================================================================================================
Install 1 package (+1 Dependent packages)

Total downloads: 356 k
 Installation size: 1.2 M
Downloading packages:
(1/2): lm_sensors-libs-3.4.0-6.20160601gitf9185e5.el7.x86_64.rpm                                                  |  42 kB  00:00:00
(2/2): sysstat-10.1.5-17.el7.x86_64.rpm                                                                           | 315 kB  00:00:01
-----------------------------------------------------------------------------------------------------------------------------------------
total                                                                                                     265 kB/s | 356 kB  00:00:01
Running transaction check
Running transaction test
Transaction test succeeded
Running transaction
  Installing    : lm_sensors-libs-3.4.0-6.20160601gitf9185e5.el7.x86_64                                                                1/2
  Installing    : sysstat-10.1.5-17.el7.x86_64                                                                                         2/2
  Verification in progress      : lm_sensors-libs-3.4.0-6.20160601gitf9185e5.el7.x86_64                                                                1/2
  Verification in progress      : sysstat-10.1.5-17.el7.x86_64                                                                                         2/2

already installed:
  sysstat.x86_64 0:10.1.5-17.el7

Installed as a dependency:
  lm_sensors-libs.x86_64 0:3.4.0-6.20160601gitf9185e5.el7

complete!
[root@linux-01 ceshi]#

## sar After the command is installed, an error will be reported because sar If there is no historical record, the error will not be affected. You can add parameters and use it. ##
[root@linux-01 ceshi]# sar
 Cannot open /var/log/sa/sa13: There is no such file or directory
4.2 sar -n DEV viewing network card historical traffic
Information per column | meaning |
|---|---|
08:40:30 PM | time |
IFACE | Network card device name |
rxpck/s | Packets received per second |
txpck/s | Database sent per second |
rxkB/s | Packet size accepted per second, in KB |
txkB/s | Packet size sent per second, in KB |
rxcmp/s | Compressed packets accepted per second |
txcmp/s | Compressed packets sent per second |
rxmcst/s | Multicast packets received per second |
4.3 sar -n DEV 5 3 viewing real-time traffic of network card
4.4 sar -n DEV -f view the historical traffic of the network card on a certain day
4.5 sar -q view historical load
4.6 view disk read and write

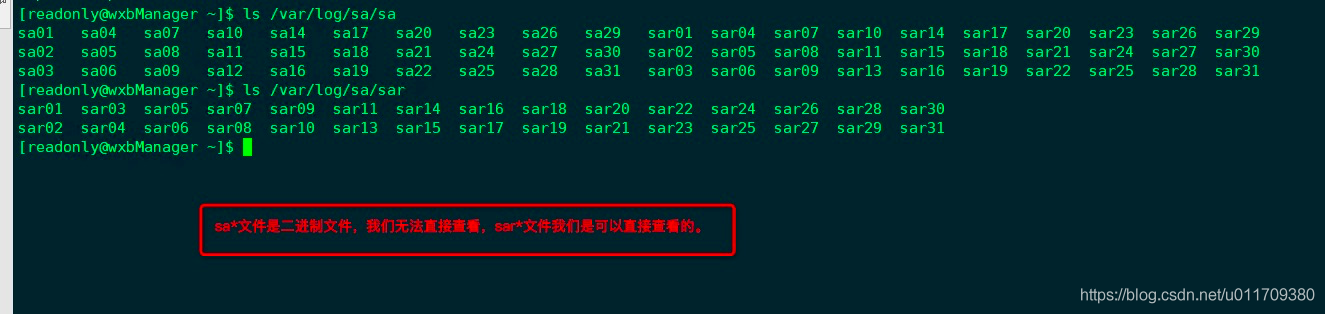
4.7 the file sa17 under / var / log / SA / is different from sar17
sa17 is a binary file. We can't use cat to view it; sar17 files can be viewed using cat.
5. Use the nload command to view the network card traffic
5.1 install nload command package. Install EPEL release before installation
[root@linux-01 ceshi]# yum install -y nload
 Plug in loaded: fastestmirror
Repository base is listed more than once in the configuration
Repository updates is listed more than once in the configuration
Repository extras is listed more than once in the configuration
Repository centosplus is listed more than once in the configuration
Loading mirror speeds from cached hostfile
 * base: mirrors.163.com
 * epel: mirrors.tuna.tsinghua.edu.cn
 * extras: mirrors.cn99.com
 * updates: mirrors.nju.edu.cn
 Resolving dependencies
--> Checking transactions
---> software package nload.x86_64.0.0.7.4-4.el7 Will be installed
--> Resolve dependency complete

Dependency resolution

=========================================================================================================================================
 Package                        framework                            edition                                 source                             size
=========================================================================================================================================
Installing:
 nload                          x86_64                          0.7.4-4.el7                          epel                           70 k

Transaction summary
=========================================================================================================================================
Install 1 package

Total downloads: 70 k
 Installation size: 176 k
Downloading packages:
Warning:/var/cache/yum/x86_64/7/epel/packages/nload-0.7.4-4.el7.x86_64.rpm: head V3 RSA/SHA256 Signature, secret key ID 352c64e5: NOKEY00:00:00 ETA
nload-0.7.4-4.el7.x86_64.rpm Your public key is not installed
nload-0.7.4-4.el7.x86_64.rpm                                                                                      |  70 kB  00:00:01
from file:///etc/pki/rpm-gpg/RPM-GPG-KEY-EPEL-7 retrieving keys
 Import GPG key 0x352C64E5:
 user ID     : "Fedora EPEL (7) <epel@fedoraproject.org>"
 fingerprint       : 91e9 7d7c 4a5e 96f1 7f3e 888f 6a2f aea2 352c 64e5
 software package     : epel-release-7-11.noarch (@extras)
 come from       : /etc/pki/rpm-gpg/RPM-GPG-KEY-EPEL-7
Running transaction check
Running transaction test
Transaction test succeeded
Running transaction
  Installing    : nload-0.7.4-4.el7.x86_64                                                                                             1/1
  Verification in progress      : nload-0.7.4-4.el7.x86_64                                                                                             1/1

already installed:
  nload.x86_64 0:0.7.4-4.el7

complete!
[root@linux-01 ceshi]#
5.2 nload real-time display of network card information
When using the nload command, we need to pay attention to which line of curr data. incoming is the traffic entering the network card and outgoing is the traffic leaving the network card.
[root@linux-01 ceshi]# nload
Device ens33 [192.168.141.128] (1/2):
=========================================================================================================================================
Incoming:


                                                                                             Curr: 872.00 Bit/s
                                                                                             Avg: 960.00 Bit/s
                                                                                             Min: 872.00 Bit/s
                                                                                             Max: 1.73 kBit/s
                                                                                             Ttl: 32.87 MByte
Outgoing:


                                                                                             Curr: 8.15 kBit/s
                                                                                             Avg: 7.73 kBit/s
                                                                                             Min: 3.98 kBit/s
                                                                                             Max: 8.16 kBit/s
                                                                                             Ttl: 6.61 MByte
## Click the right cursor ##
Device lo [127.0.0.1] (2/2):
=========================================================================================================================================
Incoming:


                                                                                             Curr: 0.00 Bit/s
                                                                                             Avg: 0.00 Bit/s
                                                                                             Min: 0.00 Bit/s
                                                                                             Max: 0.00 Bit/s
                                                                                             Ttl: 0.00 Byte
Outgoing:


                                                                                             Curr: 0.00 Bit/s
                                                                                             Avg: 0.00 Bit/s
                                                                                             Min: 0.00 Bit/s
                                                                                             Max: 0.00 Bit/s
                                                                                             Ttl: 0.00 Byte
## Press q sign out ##
6. Monitor io performance
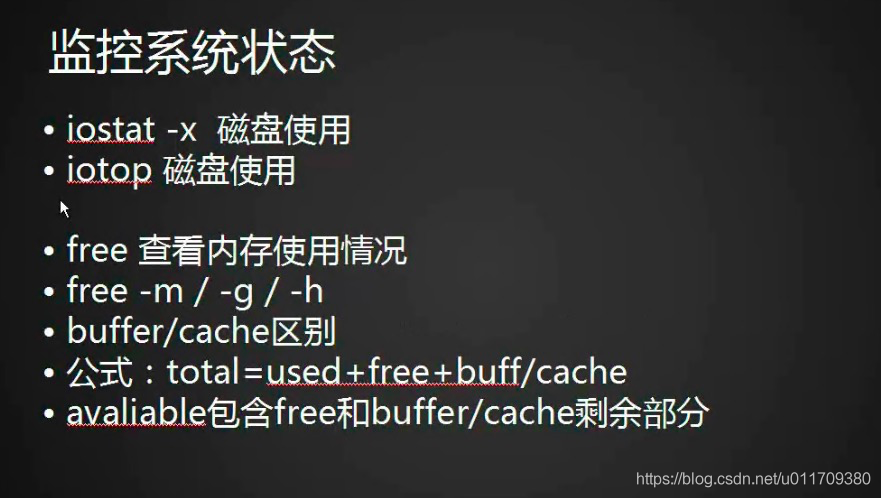
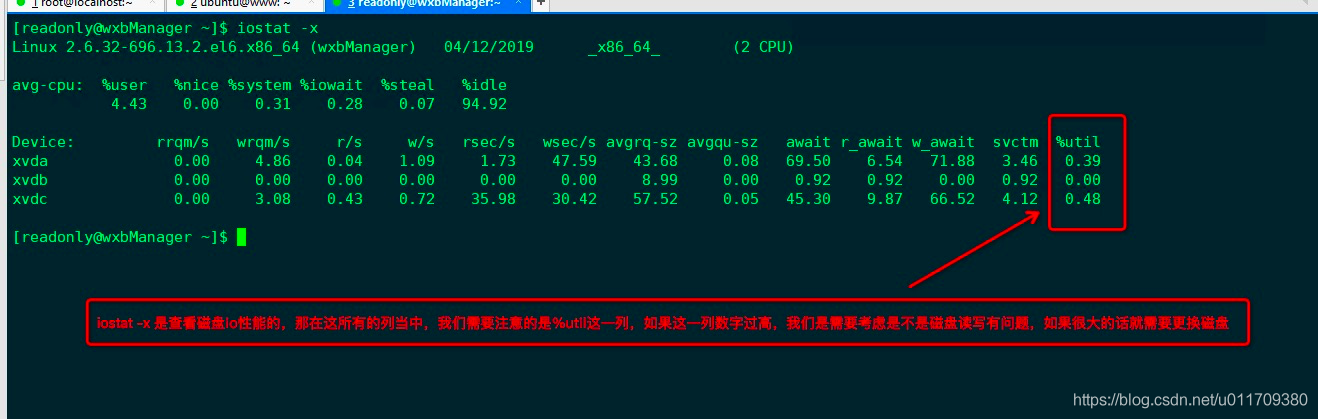
6.1 iostat -x disk usage
Iostat depends on sysstat. Like the sar command, iostat is also installed after sysstat is installed Util is a very important indicator. If the io read / write is not enabled,% util is large, indicating that the disk io is seriously insufficient.
6.2 iotop check which process occupies a high io
The iotop command is not available in the system itself, so we need to install the iotop package. The iotop command is familiar with the top command and is also a dynamic display. If the disk IO is very high, we need to use iotop if we want to see which process uses a large io.
[root@linux-01 ceshi]# yum install -y iotop
 Plug in loaded: fastestmirror
Repository base is listed more than once in the configuration
Repository updates is listed more than once in the configuration
Repository extras is listed more than once in the configuration
Repository centosplus is listed more than once in the configuration
Loading mirror speeds from cached hostfile
 * base: mirrors.163.com
 * epel: mirrors.tuna.tsinghua.edu.cn
 * extras: mirrors.cn99.com
 * updates: mirrors.nju.edu.cn
 Resolving dependencies
--> Checking transactions
---> software package iotop.noarch.0.0.6-4.el7 Will be installed
--> Resolve dependency complete

Dependency resolution

=========================================================================================================================================
 Package                        framework                            edition                                 source                             size
=========================================================================================================================================
Installing:
 iotop                          noarch                          0.6-4.el7                            base                           52 k

Transaction summary
=========================================================================================================================================
Install 1 package

Total downloads: 52 k
 Installation size: 156 k
Downloading packages:
iotop-0.6-4.el7.noarch.rpm                                                                                        |  52 kB  00:00:00
Running transaction check
Running transaction test
Transaction test succeeded
Running transaction
  Installing    : iotop-0.6-4.el7.noarch                                                                                               1/1
  Verification in progress      : iotop-0.6-4.el7.noarch                                                                                               1/1

already installed:
  iotop.noarch 0:0.6-4.el7

complete!
[root@linux-01 ceshi]#
[root@linux-01 ceshi]#  iotop
Total DISK READ :	0.00 B/s | Total DISK WRITE :       0.00 B/s
Actual DISK READ:	0.00 B/s | Actual DISK WRITE:       0.00 B/s
   TID  PRIO  USER     DISK READ  DISK WRITE  SWAPIN     IO>    COMMAND
     1 be/4 root        0.00 B/s    0.00 B/s  0.00 %  0.00 % systemd --switched-root --system --deserialize 22
     2 be/4 root        0.00 B/s    0.00 B/s  0.00 %  0.00 % [kthreadd]
     3 be/4 root        0.00 B/s    0.00 B/s  0.00 %  0.00 % [ksoftirqd/0]
     5 be/0 root        0.00 B/s    0.00 B/s  0.00 %  0.00 % [kworker/0:0H]
     7 rt/4 root        0.00 B/s    0.00 B/s  0.00 %  0.00 % [migration/0]
     8 be/4 root        0.00 B/s    0.00 B/s  0.00 %  0.00 % [rcu_bh]
     9 be/4 root        0.00 B/s    0.00 B/s  0.00 %  0.00 % [rcu_sched]
    10 be/0 root        0.00 B/s    0.00 B/s  0.00 %  0.00 % [lru-add-drain]
    11 rt/4 root        0.00 B/s    0.00 B/s  0.00 %  0.00 % [watchdog/0]
    13 be/4 root        0.00 B/s    0.00 B/s  0.00 %  0.00 % [kdevtmpfs]
    14 be/0 root        0.00 B/s    0.00 B/s  0.00 %  0.00 % [netns]
    15 be/4 root        0.00 B/s    0.00 B/s  0.00 %  0.00 % [khungtaskd]
    16 be/0 root        0.00 B/s    0.00 B/s  0.00 %  0.00 % [writeback]
    17 be/0 root        0.00 B/s    0.00 B/s  0.00 %  0.00 % [kintegrityd]
    18 be/0 root        0.00 B/s    0.00 B/s  0.00 %  0.00 % [bioset]
    19 be/0 root        0.00 B/s    0.00 B/s  0.00 %  0.00 % [bioset]
    20 be/0 root        0.00 B/s    0.00 B/s  0.00 %  0.00 % [bioset]
    21 be/0 root        0.00 B/s    0.00 B/s  0.00 %  0.00 % [kblockd]
    22 be/0 root        0.00 B/s    0.00 B/s  0.00 %  0.00 % [md]
    23 be/0 root        0.00 B/s    0.00 B/s  0.00 %  0.00 % [edac-poller]
    24 be/0 root        0.00 B/s    0.00 B/s  0.00 %  0.00 % [watchdogd]
  6319 be/4 root        0.00 B/s    0.00 B/s  0.00 %  0.00 % VGAuthService -s
    30 be/4 root        0.00 B/s    0.00 B/s  0.00 %  0.00 % [kswapd0]
    31 be/5 root        0.00 B/s    0.00 B/s  0.00 %  0.00 % [ksmd]
    32 be/7 root        0.00 B/s    0.00 B/s  0.00 %  0.00 % [khugepaged]
7. free view memory
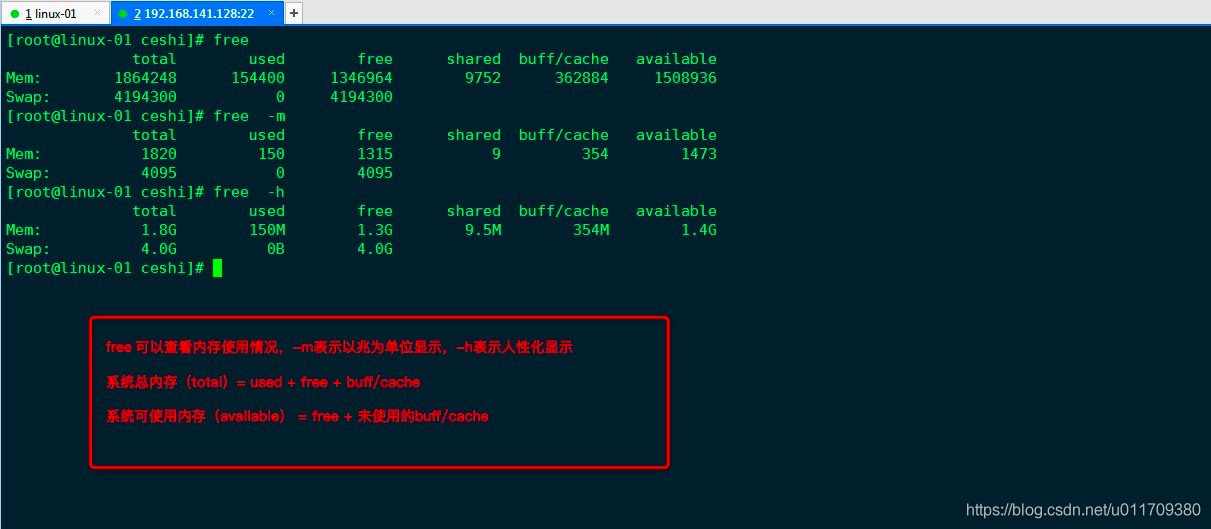
The display results of the free command of CentOS 7 system are more concise and consistent than those of CentOS 6.
[root@linux-01 ceshi]# free
              total        used        free      shared  buff/cache   available
Mem:        1864248      154264     1347132        9752      362852     1509080
Swap:       4194300           0     4194300
[root@linux-01 ceshi]#
column | meaning |
|---|---|
total | Total memory size |
used | Actual memory size actually used |
free | Remaining physical memory size |
shared | Shared physical memory size |
buff/cache | The data is written to the disk through the cpu, and the memory used is buffer. The data is handed over to the cpu for operation and processing through the disk, and the memory used is cache |
available | How much memory can be used by the system, including free, and whether the buff+cache is occupied |
8. ps view system process

[readonly@wxbManager ~]$ ps aux
USER       PID %CPU %MEM    VSZ   RSS TTY      STAT START   TIME COMMAND
root         1  0.0  0.0  19340  1116 ?        Ss    2017   0:47 /sbin/init
root         2  0.0  0.0      0     0 ?        S     2017   0:00 [kthreadd]
root         3  0.0  0.0      0     0 ?        S     2017   2:06 [migration/0]
root         4  0.0  0.0      0     0 ?        S     2017   4:04 [ksoftirqd/0]
root         5  0.0  0.0      0     0 ?        S     2017   0:00 [stopper/0]
root         6  0.0  0.0      0     0 ?        S     2017   0:58 [watchdog/0]
root         7  0.0  0.0      0     0 ?        S     2017   2:58 [migration/1]
root         8  0.0  0.0      0     0 ?        S     2017   0:00 [stopper/1]
root         9  0.0  0.0      0     0 ?        S     2017   5:45 [ksoftirqd/1]
root        10  0.0  0.0      0     0 ?        S     2017   0:52 [watchdog/1]
root        11  0.0  0.0      0     0 ?        S     2017  30:36 [events/0]
root        12  0.0  0.0      0     0 ?        S     2017 139:36 [events/1]
root        13  0.0  0.0      0     0 ?        S     2017   0:00 [events/0]
root        14  0.0  0.0      0     0 ?        S     2017   0:00 [events/1]
root        15  0.0  0.0      0     0 ?        S     2017   0:00 [events_long/0]
root        16  0.0  0.0      0     0 ?        S     2017   0:00 [events_long/1]
root        17  0.0  0.0      0     0 ?        S     2017   0:00 [events_power_ef]
root        18  0.0  0.0      0     0 ?        S     2017   0:00 [events_power_ef]
root        19  0.0  0.0      0     0 ?        S     2017   0:00 [cgroup]
root        20  0.0  0.0      0     0 ?        S     2017   0:00 [khelper]
root        21  0.0  0.0      0     0 ?        S     2017   0:00 [netns]
root        22  0.0  0.0      0     0 ?        S     2017   0:00 [async/mgr]
root        23  0.0  0.0      0     0 ?        S     2017   0:00 [pm]
root        24  0.0  0.0      0     0 ?        S     2017   0:00 [xenwatch]
root        25  0.0  0.0      0     0 ?        S     2017   0:00 [xenbus]
root        26  0.0  0.0      0     0 ?        S     2017   2:29 [sync_supers]
root        27  0.0  0.0      0     0 ?        S     2017   0:02 [bdi-default]
root        28  0.0  0.0      0     0 ?        S     2017   0:00 [kintegrityd/0]
root        29  0.0  0.0      0     0 ?        S     2017   0:00 [kintegrityd/1]
root        30  0.0  0.0      0     0 ?        S     2017   4:36 [kblockd/0]
root        31  0.0  0.0      0     0 ?        S     2017   0:02 [kblockd/1]
root        32  0.0  0.0      0     0 ?        S     2017   0:00 [kacpid]
root        33  0.0  0.0      0     0 ?        S     2017   0:00 [kacpi_notify]
root        34  0.0  0.0      0     0 ?        S     2017   0:00 [kacpi_hotplug]
root        35  0.0  0.0      0     0 ?        S     2017   0:00 [ata_aux]
root        36  0.0  0.0      0     0 ?        S     2017   0:00 [ata_sff/0]
root        37  0.0  0.0      0     0 ?        S     2017   0:00 [ata_sff/1]
root        38  0.0  0.0      0     0 ?        S     2017   0:00 [ksuspend_usbd]
root        39  0.0  0.0      0     0 ?        S     2017   0:00 [khubd]
root        40  0.0  0.0      0     0 ?        S     2017   0:00 [kseriod]
root        41  0.0  0.0      0     0 ?        S     2017   0:00 [md/0]
root        42  0.0  0.0      0     0 ?        S     2017   0:00 [md/1]
root        43  0.0  0.0      0     0 ?        S     2017   0:00 [md_misc/0]
root        44  0.0  0.0      0     0 ?        S     2017   0:00 [md_misc/1]
root        45  0.0  0.0      0     0 ?        S     2017   0:00 [linkwatch]
root        47  0.0  0.0      0     0 ?        S     2017   0:15 [khungtaskd]
root        48  0.0  0.0      0     0 ?        S     2017   6:07 [kswapd0]
root        49  0.0  0.0      0     0 ?        SN    2017   0:00 [ksmd]
root        50  0.0  0.0      0     0 ?        SN    2017   2:13 [khugepaged]
root        51  0.0  0.0      0     0 ?        S     2017   0:00 [aio/0]
root        52  0.0  0.0      0     0 ?        S     2017   0:00 [aio/1]
root        53  0.0  0.0      0     0 ?        S     2017   0:00 [crypto/0]
root        54  0.0  0.0      0     0 ?        S     2017   0:00 [crypto/1]
root        61  0.0  0.0      0     0 ?        S     2017   0:00 [kthrotld/0]
root        62  0.0  0.0      0     0 ?        S     2017   0:00 [kthrotld/1]
root        64  0.0  0.0      0     0 ?        S     2017   0:00 [kpsmoused]
root        65  0.0  0.0      0     0 ?        S     2017   0:00 [usbhid_resumer]
root        66  0.0  0.0      0     0 ?        S     2017   0:00 [deferwq]
root        98  0.0  0.0      0     0 ?        S     2017   0:00 [kdmremove]
root        99  0.0  0.0      0     0 ?        S     2017   0:00 [kstriped]
root       229  0.0  0.0      0     0 ?        S     2017   0:00 [scsi_eh_0]
root       230  0.0  0.0      0     0 ?        S     2017   0:00 [scsi_eh_1]
root       343  0.0  0.0      0     0 ?        S     2017  15:33 [jbd2/xvda1-8]
root       344  0.0  0.0      0     0 ?        S     2017   0:00 [ext4-dio-unwrit]
root       440  0.0  0.0  10760   876 ?        S<s   2017   0:00 /sbin/udevd -d
root       688  0.0  0.0      0     0 ?        S     2017  18:29 [flush-202:0]
root       772  0.0  0.0      0     0 ?        S     2017   0:00 [kauditd]
root       822  0.0  0.0      0     0 ?        S     2017   0:04 [ib_addr]
root       827  0.0  0.0      0     0 ?        S     2017   0:00 [infiniband/0]
root       828  0.0  0.0      0     0 ?        S     2017   0:00 [infiniband/1]
root       837  0.0  0.0      0     0 ?        S     2017   0:00 [ib_mcast]
root       842  0.0  0.0      0     0 ?        S     2017   0:00 [iw_cm_wq]
root       848  0.0  0.0      0     0 ?        S     2017   0:00 [ib_cm/0]
root       849  0.0  0.0      0     0 ?        S     2017   0:00 [ib_cm/1]
root       854  0.0  0.0      0     0 ?        S     2017   0:00 [rdma_cm]
root       875  0.0  0.0      0     0 ?        S     2017   0:00 [ipoib_flush]
root      1141  0.0  0.0 251960  5876 ?        Sl    2017   0:25 /sbin/rsyslogd -i /var/run/syslogd.pid -c 5
nscd      1164  0.0  0.0 630248  1480 ?        Ssl   2017  91:35 /usr/sbin/nscd
root      1276  0.0  0.0  66256  1196 ?        Ss    2017   0:02 /usr/sbin/sshd
ntp       1287  0.0  0.0  26600  1556 ?        Ss    2017   4:10 ntpd -u ntp:ntp -p /var/run/ntpd.pid -g
root      1352  0.0  0.0      0     0 ?        S     2017   0:00 [cqueue]
root      1393  0.0  0.0 116908  1324 ?        Ss    2017   1:18 crond
root      1832  0.0  0.4 591388 38044 ?        Sl    2017 479:37 /usr/bin/python2.7 /usr/bin/salt-minion -c /etc/salt -d
root      1833  0.0  0.3 493532 25796 ?        S     2017   0:00 /usr/bin/python2.7 /usr/bin/salt-minion -c /etc/salt -d
root      1994  0.0  0.0  31616    68 ?        Ssl   2017   0:00 /usr/sbin/gshelld
root      2011  0.0  0.0   4060   532 tty1     Ss+   2017   0:00 /sbin/mingetty /dev/tty1
root      2013  0.0  0.0   4060   536 tty2     Ss+   2017   0:00 /sbin/mingetty /dev/tty2
root      2015  0.0  0.0   4060   532 tty3     Ss+   2017   0:00 /sbin/mingetty /dev/tty3
root      2017  0.0  0.0   4060   532 tty4     Ss+   2017   0:00 /sbin/mingetty /dev/tty4
root      2019  0.0  0.0   4060   536 tty5     Ss+   2017   0:00 /sbin/mingetty /dev/tty5
root      2021  0.0  0.0   4060   532 tty6     Ss+   2017   0:00 /sbin/mingetty /dev/tty6
root      2022  0.0  0.0  10760   908 ?        S<    2017   0:00 /sbin/udevd -d
root      2023  0.0  0.0  10824   840 ?        S<    2017   0:00 /sbin/udevd -d
root      2362  0.0  0.0      0     0 ?        S     2017  10:49 [kjournald]
root      7331  0.0  0.0  45984  2520 ?        Ss    2017   0:00 nginx: master process /usr/local/nginx/sbin/nginx
root      9263  0.0  0.0  79104  1212 ?        S     2017   0:00 /usr/sbin/zabbix_agentd -c /etc/zabbix/zabbix_agentd.conf
root      9269  0.0  0.0  79104  1312 ?        S     2017 206:07 /usr/sbin/zabbix_agentd: collector [idle 1 sec]
root      9270  0.0  0.0  79104  2168 ?        S     2017  36:43 /usr/sbin/zabbix_agentd: listener #1 [waiting for connection]
root      9271  0.0  0.0  79104  2168 ?        S     2017  36:43 /usr/sbin/zabbix_agentd: listener #2 [waiting for connection]
root      9272  0.0  0.0  79104  2168 ?        S     2017  36:48 /usr/sbin/zabbix_agentd: listener #3 [waiting for connection]
root      9273  0.0  0.0  79108  2128 ?        S     2017 132:27 /usr/sbin/zabbix_agentd: active checks #1 [idle 1 sec]
nobody    9595  0.0  0.3  73268 30672 ?        S    Feb14  13:00 nginx: worker process
nobody    9596  0.0  0.3  73668 30996 ?        S    Feb14  12:18 nginx: worker process
readonly 20493  0.0  0.0 110244  1140 pts/0    R+   22:55   0:00 ps aux
root     21063  0.0  0.0  25836  4360 ?        S<sl Jan21  33:10 /usr/local/aegis/aegis_update/AliYunDunUpdate
root     21111  0.2  0.2 129544 20356 ?        S<sl Jan21 331:01 /usr/local/aegis/aegis_client/aegis_10_59/AliYunDun
508      28984  0.0  0.0 106240   680 ?        S    Mar14   0:00 /bin/sh /home/10beiManager/tomcat/bin/catalina.sh start
508      28985  0.0  0.0   4112   624 ?        S    Mar14   2:29 /usr/sbin/cronolog /home/10beiManager/tomcat/logs/catalina.%Y-%m-%d.out
508      28986  0.9 35.7 7053776 2925128 ?     Sl   Mar14 413:02 /usr/java/jdk1.8.0_181/bin/java -Djava.util.logging.config.file=/home/10beiManage
root     30323  0.0  0.0 102556  4400 ?        Ss   17:48   0:00 sshd: readonly [priv]
readonly 30325  0.0  0.0 102556  1888 ?        S    17:48   0:00 sshd: readonly@pts/0
readonly 30326  0.0  0.0 108352  1836 pts/0    Ss   17:48   0:00 -bash
[readonly@wxbManager ~]$
stat process status | meaning |
|---|---|
D | Non interruptible progress (usually io process) |
R | The running process is in progress, including the process of expanding icpu time slice |
S | Interrupted process. Usually, most processes in the system are in this state |
T | A process that has been stopped or paused. |
W | (not available after kernel 2.6xx) not enough memory is allocated |
X | Dead process |
Z | Zombie processes, garbage processes that neither kill nor kill, occupy some resources of the system, but it doesn't matter. If they occupy too much, they need to be paid attention to |
< | High priority process |
N | Low priority process |
L | Memory pages locked in memory |
s | The main process, the nginx service mentioned later, is easy to understand |
l | Multithreaded process |
+ | Processes running in the foreground |
[readonly@wxbManager ~]$ ps aux | grep  nginx
root      7331  0.0  0.0  45984  2520 ?        Ss    2017   0:00 nginx: master process /usr/local/nginx/sbin/nginx
nobody    9595  0.0  0.3  73268 30672 ?        S    Feb14  13:01 nginx: worker process
nobody    9596  0.0  0.3  73668 30996 ?        S    Feb14  12:18 nginx: worker process
readonly 21461  0.0  0.0 103324   848 pts/0    S+   23:07   0:00 grep nginx
[readonly@wxbManager ~]$
9. netstat view network status
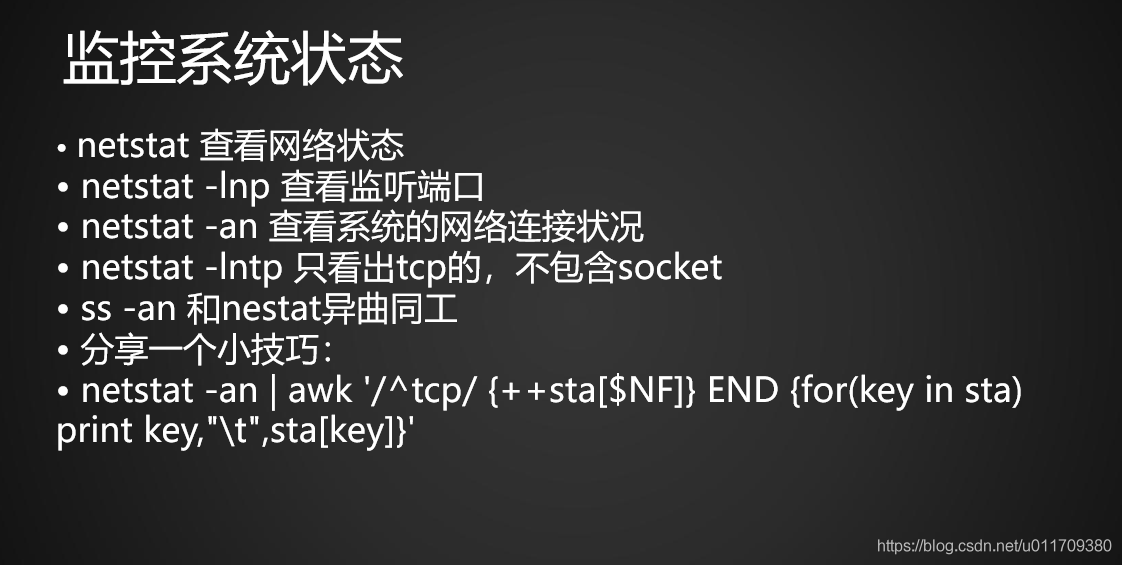
## netstat -lnp View listening port ##
[root@linux-01 ceshi]# netstat -lnp
Active Internet connections (only servers)
Proto Recv-Q Send-Q Local Address Foreign Address State PID/Program name
tcp 0 0 0.0.0.0:22 0.0.0.0:* LISTEN 6967/sshd
tcp 0 0 127.0.0.1:25 0.0.0.0:* LISTEN 7260/master
tcp6 0 0 :::22 :::* LISTEN 6967/sshd
tcp6 0 0 ::1:25 :::* LISTEN 7260/master
raw6 0 0 :::58 :::* 7 6519/NetworkManager
Active UNIX domain sockets (only servers)
Proto RefCnt Flags Type State I-Node PID/Program name Path
unix 2 [ ACC ] STREAM LISTENING 39265 7260/master private/trace
unix 2 [ ACC ] STREAM LISTENING 39268 7260/master private/verify
unix 2 [ ACC ] STREAM LISTENING 39277 7260/master private/proxywrite
unix 2 [ ACC ] STREAM LISTENING 39292 7260/master private/retry
unix 2 [ ACC ] STREAM LISTENING 39295 7260/master private/discard
unix 2 [ ACC ] STREAM LISTENING 39298 7260/master private/local
unix 2 [ ACC ] STREAM LISTENING 39301 7260/master private/virtual
unix 2 [ ACC ] STREAM LISTENING 39304 7260/master private/lmtp
unix 2 [ ACC ] STREAM LISTENING 39307 7260/master private/anvil
unix 2 [ ACC ] STREAM LISTENING 39310 7260/master private/scache
unix 2 [ ACC ] SEQPACKET LISTENING 21315 1/systemd /run/udev/control
unix 2 [ ACC ] STREAM LISTENING 39262 7260/master private/defer
unix 2 [ ACC ] STREAM LISTENING 35410 6319/VGAuthService /var/run/vmware/guestServicePipe
unix 2 [ ACC ] STREAM LISTENING 21140 1/systemd /run/systemd/private
unix 2 [ ACC ] STREAM LISTENING 39280 7260/master private/smtp
unix 2 [ ACC ] STREAM LISTENING 39283 7260/master private/relay
unix 2 [ ACC ] STREAM LISTENING 39289 7260/master private/error
unix 2 [ ACC ] STREAM LISTENING 39241 7260/master public/pickup
unix 2 [ ACC ] STREAM LISTENING 39245 7260/master public/cleanup
unix 2 [ ACC ] STREAM LISTENING 39249 7260/master public/qmgr
unix 2 [ ACC ] STREAM LISTENING 39271 7260/master public/flush
unix 2 [ ACC ] STREAM LISTENING 39286 7260/master public/showq
unix 2 [ ACC ] STREAM LISTENING 39274 7260/master private/proxymap
unix 2 [ ACC ] STREAM LISTENING 39253 7260/master private/tlsmgr
unix 2 [ ACC ] STREAM LISTENING 39256 7260/master private/rewrite
unix 2 [ ACC ] STREAM LISTENING 39259 7260/master private/bounce
unix 2 [ ACC ] STREAM LISTENING 21223 1/systemd /run/lvm/lvmetad.socket
unix 2 [ ACC ] STREAM LISTENING 21226 1/systemd /run/lvm/lvmpolld.socket
unix 2 [ ACC ] STREAM LISTENING 34025 1/systemd /run/dbus/system_bus_socket
unix 2 [ ACC ] STREAM LISTENING 8946 1/systemd /run/systemd/journal/stdout
[root@linux-01 ceshi]#
## netstat -an View the network connection status of the system ##
[root@linux-01 ceshi]# netstat -an
Active Internet connections (servers and established)
Proto Recv-Q Send-Q Local Address Foreign Address State
tcp 0 0 0.0.0.0:22 0.0.0.0:* LISTEN
tcp 0 0 127.0.0.1:25 0.0.0.0:* LISTEN
tcp 0 0 192.168.141.128:22 192.168.141.1:65423 ESTABLISHED
tcp 0 52 192.168.141.128:22 192.168.141.1:60176 ESTABLISHED
tcp6 0 0 :::22 :::* LISTEN
tcp6 0 0 ::1:25 :::* LISTEN
raw6 0 0 :::58 :::* 7
Active UNIX domain sockets (servers and established)
Proto RefCnt Flags Type State I-Node Path
unix 2 [ ACC ] STREAM LISTENING 39265 private/trace
unix 2 [ ACC ] STREAM LISTENING 39268 private/verify
unix 2 [ ACC ] STREAM LISTENING 39277 private/proxywrite
unix 2 [ ACC ] STREAM LISTENING 39292 private/retry
unix 2 [ ACC ] STREAM LISTENING 39295 private/discard
unix 2 [ ACC ] STREAM LISTENING 39298 private/local
unix 2 [ ACC ] STREAM LISTENING 39301 private/virtual
unix 2 [ ACC ] STREAM LISTENING 39304 private/lmtp
unix 2 [ ACC ] STREAM LISTENING 39307 private/anvil
unix 2 [ ACC ] STREAM LISTENING 39310 private/scache
unix 2 [ ACC ] SEQPACKET LISTENING 21315 /run/udev/control
unix 2 [ ACC ] STREAM LISTENING 39262 private/defer
unix 2 [ ACC ] STREAM LISTENING 35410 /var/run/vmware/guestServicePipe
unix 2 [ ACC ] STREAM LISTENING 21140 /run/systemd/private
unix 2 [ ACC ] STREAM LISTENING 39280 private/smtp
unix 2 [ ACC ] STREAM LISTENING 39283 private/relay
unix 2 [ ACC ] STREAM LISTENING 39289 private/error
unix 2 [ ACC ] STREAM LISTENING 39241 public/pickup
unix 2 [ ACC ] STREAM LISTENING 39245 public/cleanup
unix 2 [ ACC ] STREAM LISTENING 39249 public/qmgr
unix 2 [ ACC ] STREAM LISTENING 39271 public/flush
unix 2 [ ACC ] STREAM LISTENING 39286 public/showq
unix 2 [ ] DGRAM 21427 /run/systemd/shutdownd
unix 2 [ ACC ] STREAM LISTENING 39274 private/proxymap
unix 3 [ ] DGRAM 8926 /run/systemd/notify
unix 2 [ ] DGRAM 8928 /run/systemd/cgroups-agent
unix 2 [ ACC ] STREAM LISTENING 39253 private/tlsmgr
unix 2 [ ACC ] STREAM LISTENING 39256 private/rewrite
unix 2 [ ACC ] STREAM LISTENING 39259 private/bounce
unix 2 [ ACC ] STREAM LISTENING 21223 /run/lvm/lvmetad.socket
unix 2 [ ACC ] STREAM LISTENING 21226 /run/lvm/lvmpolld.socket
unix 2 [ ACC ] STREAM LISTENING 34025 /run/dbus/system_bus_socket
unix 2 [ ACC ] STREAM LISTENING 8946 /run/systemd/journal/stdout
unix 5 [ ] DGRAM 8949 /run/systemd/journal/socket
unix 13 [ ] DGRAM 8951 /dev/log
unix 3 [ ] STREAM CONNECTED 39312
unix 3 [ ] STREAM CONNECTED 34453 /run/systemd/journal/stdout
unix 3 [ ] STREAM CONNECTED 39311
unix 3 [ ] STREAM CONNECTED 39246
unix 3 [ ] STREAM CONNECTED 39309
unix 3 [ ] STREAM CONNECTED 38165 /run/systemd/journal/stdout
unix 3 [ ] STREAM CONNECTED 39250
unix 3 [ ] STREAM CONNECTED 39251
unix 3 [ ] STREAM CONNECTED 38164
unix 3 [ ] STREAM CONNECTED 34452
unix 3 [ ] STREAM CONNECTED 39248
unix 3 [ ] STREAM CONNECTED 34711
unix 2 [ ] DGRAM 35686
unix 3 [ ] STREAM CONNECTED 39242
unix 3 [ ] STREAM CONNECTED 36842 /run/dbus/system_bus_socket
unix 3 [ ] STREAM CONNECTED 39303
unix 3 [ ] STREAM CONNECTED 39239
unix 3 [ ] STREAM CONNECTED 36841
unix 3 [ ] STREAM CONNECTED 39302
unix 3 [ ] STREAM CONNECTED 39243
unix 2 [ ] DGRAM 1027790
unix 3 [ ] STREAM CONNECTED 39308
unix 3 [ ] STREAM CONNECTED 34516 /run/systemd/journal/stdout
unix 3 [ ] STREAM CONNECTED 34941
unix 3 [ ] STREAM CONNECTED 39306
unix 3 [ ] STREAM CONNECTED 39240
unix 3 [ ] STREAM CONNECTED 39267
unix 3 [ ] STREAM CONNECTED 39305
unix 3 [ ] STREAM CONNECTED 34467
unix 3 [ ] STREAM CONNECTED 39257
unix 3 [ ] STREAM CONNECTED 21706
unix 3 [ ] STREAM CONNECTED 34713 /run/dbus/system_bus_socket
unix 3 [ ] STREAM CONNECTED 39258
unix 3 [ ] STREAM CONNECTED 34554
unix 3 [ ] STREAM CONNECTED 21707 /run/systemd/journal/stdout
unix 3 [ ] STREAM CONNECTED 39255
unix 2 [ ] DGRAM 34788
unix 3 [ ] STREAM CONNECTED 39261
unix 3 [ ] STREAM CONNECTED 34712
unix 3 [ ] STREAM CONNECTED 38295 /run/systemd/journal/stdout
unix 3 [ ] STREAM CONNECTED 35633
unix 2 [ ] DGRAM 34536
unix 3 [ ] STREAM CONNECTED 39260
unix 3 [ ] STREAM CONNECTED 34718 /run/dbus/system_bus_socket
unix 2 [ ] DGRAM 21422
unix 3 [ ] STREAM CONNECTED 39266
unix 3 [ ] STREAM CONNECTED 34515
unix 3 [ ] STREAM CONNECTED 38294
unix 3 [ ] STREAM CONNECTED 39439
unix 2 [ ] DGRAM 1109850
unix 2 [ ] DGRAM 39330
unix 3 [ ] STREAM CONNECTED 39254
unix 3 [ ] STREAM CONNECTED 35634 /run/systemd/journal/stdout
unix 2 [ ] DGRAM 39608
unix 3 [ ] STREAM CONNECTED 39300
unix 3 [ ] STREAM CONNECTED 39440 /run/dbus/system_bus_socket
unix 3 [ ] STREAM CONNECTED 39299
unix 3 [ ] STREAM CONNECTED 34942 /run/systemd/journal/stdout
unix 3 [ ] STREAM CONNECTED 39279
unix 3 [ ] STREAM CONNECTED 35709
unix 3 [ ] STREAM CONNECTED 39278
unix 3 [ ] STREAM CONNECTED 39276
unix 3 [ ] STREAM CONNECTED 35569
unix 3 [ ] STREAM CONNECTED 39264
unix 3 [ ] STREAM CONNECTED 39282
unix 3 [ ] STREAM CONNECTED 39281
unix 3 [ ] STREAM CONNECTED 34391 /run/systemd/journal/stdout
unix 3 [ ] DGRAM 22225
unix 3 [ ] STREAM CONNECTED 34158 /run/systemd/journal/stdout
unix 2 [ ] DGRAM 22207
unix 3 [ ] STREAM CONNECTED 39270
unix 2 [ ] DGRAM 35775
unix 3 [ ] DGRAM 22226
unix 3 [ ] STREAM CONNECTED 39269
unix 2 [ ] DGRAM 681719
unix 3 [ ] STREAM CONNECTED 34157
unix 3 [ ] STREAM CONNECTED 34885
unix 3 [ ] STREAM CONNECTED 39275
unix 2 [ ] DGRAM 33504
unix 3 [ ] STREAM CONNECTED 39263
unix 3 [ ] STREAM CONNECTED 39273
unix 3 [ ] STREAM CONNECTED 35570 /run/dbus/system_bus_socket
unix 3 [ ] STREAM CONNECTED 39272
unix 3 [ ] STREAM CONNECTED 33516
unix 3 [ ] STREAM CONNECTED 39294
unix 3 [ ] STREAM CONNECTED 39293
unix 3 [ ] STREAM CONNECTED 34390
unix 3 [ ] STREAM CONNECTED 34886 /run/dbus/system_bus_socket
unix 3 [ ] STREAM CONNECTED 39291
unix 2 [ ] DGRAM 1205914
unix 2 [ ] DGRAM 35332
unix 3 [ ] STREAM CONNECTED 39297
unix 2 [ ] DGRAM 35296
unix 3 [ ] STREAM CONNECTED 22196 /run/systemd/journal/stdout
unix 3 [ ] STREAM CONNECTED 39296
unix 3 [ ] STREAM CONNECTED 22195
unix 3 [ ] STREAM CONNECTED 39287
unix 3 [ ] STREAM CONNECTED 35710 /run/dbus/system_bus_socket
unix 3 [ ] STREAM CONNECTED 39285
unix 3 [ ] STREAM CONNECTED 33515
unix 3 [ ] STREAM CONNECTED 39284
unix 3 [ ] STREAM CONNECTED 39290
unix 2 [ ] DGRAM 39213
unix 3 [ ] STREAM CONNECTED 39288
[root@linux-01 ceshi]#
## netstat -ltnp see tcp Network interface status for ##
[root@linux-01 ceshi]# netstat -ltnp
Active Internet connections (only servers)
Proto Recv-Q Send-Q Local Address Foreign Address State PID/Program name
tcp 0 0 0.0.0.0:22 0.0.0.0:* LISTEN 6967/sshd
tcp 0 0 127.0.0.1:25 0.0.0.0:* LISTEN 7260/master
tcp6 0 0 :::22 :::* LISTEN 6967/sshd
tcp6 0 0 ::1:25 :::* LISTEN 7260/master
## netstat -ltunp see tcp and udp Network interface status for ##
[root@linux-01 ceshi]# netstat -ltunp
Active Internet connections (only servers)
Proto Recv-Q Send-Q Local Address Foreign Address State PID/Program name
tcp 0 0 0.0.0.0:22 0.0.0.0:* LISTEN 6967/sshd
tcp 0 0 127.0.0.1:25 0.0.0.0:* LISTEN 7260/master
tcp6 0 0 :::22 :::* LISTEN 6967/sshd
tcp6 0 0 ::1:25 :::* LISTEN 7260/master
[root@linux-01 ceshi]#
## ss -an and netstat Similarly, you can view the network interface ##
[root@linux-01 ceshi]# ss -an
Netid State Recv-Q Send-Q Local Address:Port Peer Address:Port
nl UNCONN 0 0 0:6519 *
nl UNCONN 0 0 0:0 *
nl UNCONN 0 0 0:6519 *
nl UNCONN 4352 0 4:19380 *
nl UNCONN 768 0 4:0 *
nl UNCONN 0 0 6:0 *
nl UNCONN 0 0 7:0 *
nl UNCONN 0 0 7:6325 *
nl UNCONN 0 0 7:1 *
nl UNCONN 0 0 7:6325 *
nl UNCONN 0 0 7:1 *
nl UNCONN 0 0 9:6161 *
nl UNCONN 0 0 9:1 *
nl UNCONN 0 0 9:0 *
nl UNCONN 0 0 10:0 *
nl UNCONN 0 0 11:0 *
nl UNCONN 0 0 12:0 *
nl UNCONN 0 0 15:6965 *
nl UNCONN 0 0 15:-4119 *
nl UNCONN 0 0 15:6519 *
nl UNCONN 0 0 15:-4120 *
nl UNCONN 0 0 15:-4118 *
nl UNCONN 0 0 15:-4117 *
nl UNCONN 0 0 15:3027 *
nl UNCONN 0 0 15:1 *
nl UNCONN 0 0 15:0 *
nl UNCONN 0 0 15:6309 *
nl UNCONN 0 0 15:-4107 *
nl UNCONN 0 0 15:6965 *
nl UNCONN 0 0 15:-4120 *
nl UNCONN 0 0 15:6519 *
nl UNCONN 0 0 15:-4119 *
nl UNCONN 0 0 15:-4118 *
nl UNCONN 0 0 15:-4117 *
nl UNCONN 0 0 15:6309 *
nl UNCONN 0 0 15:-4107 *
nl UNCONN 0 0 15:1 *
nl UNCONN 0 0 16:0 *
nl UNCONN 0 0 18:0 *
p_dgr UNCONN 0 0 arp:ens33 *
u_str LISTEN 0 100 private/trace 39265 * 0
u_str LISTEN 0 100 private/verify 39268 * 0
u_str LISTEN 0 100 private/proxywrite 39277 * 0
u_str LISTEN 0 100 private/retry 39292 * 0
u_str LISTEN 0 100 private/discard 39295 * 0
u_str LISTEN 0 100 private/local 39298 * 0
u_str LISTEN 0 100 private/virtual 39301 * 0
u_str LISTEN 0 100 private/lmtp 39304 * 0
u_str LISTEN 0 100 private/anvil 39307 * 0
u_str LISTEN 0 100 private/scache 39310 * 0
u_seq LISTEN 0 128 /run/udev/control 21315 * 0
u_str LISTEN 0 100 private/defer 39262 * 0
u_str LISTEN 0 32 /var/run/vmware/guestServicePipe 35410 * 0
u_str LISTEN 0 128 /run/systemd/private 21140 * 0
u_str LISTEN 0 100 private/smtp 39280 * 0
u_str LISTEN 0 100 private/relay 39283 * 0
u_str LISTEN 0 100 private/error 39289 * 0
u_str LISTEN 0 100 public/pickup 39241 * 0
u_str LISTEN 0 100 public/cleanup 39245 * 0
u_str LISTEN 0 100 public/qmgr 39249 * 0
u_str LISTEN 0 100 public/flush 39271 * 0
u_str LISTEN 0 100 public/showq 39286 * 0
u_dgr UNCONN 0 0 /run/systemd/shutdownd 21427 * 0
u_str LISTEN 0 100 private/proxymap 39274 * 0
u_dgr UNCONN 0 0 /run/systemd/notify 8926 * 0
u_dgr UNCONN 0 0 /run/systemd/cgroups-agent 8928 * 0
u_str LISTEN 0 100 private/tlsmgr 39253 * 0
u_str LISTEN 0 100 private/rewrite 39256 * 0
u_str LISTEN 0 100 private/bounce 39259 * 0
u_str LISTEN 0 128 /run/lvm/lvmetad.socket 21223 * 0
u_str LISTEN 0 128 /run/lvm/lvmpolld.socket 21226 * 0
u_str LISTEN 0 128 /run/dbus/system_bus_socket 34025 * 0
u_str LISTEN 0 128 /run/systemd/journal/stdout 8946 * 0
u_dgr UNCONN 0 0 /run/systemd/journal/socket 8949 * 0
u_dgr UNCONN 0 0 /dev/log 8951 * 0
u_str ESTAB 0 0 * 39312 * 39311
u_str ESTAB 0 0 /run/systemd/journal/stdout 34453 * 34452
u_str ESTAB 0 0 * 39311 * 39312
u_str ESTAB 0 0 * 39246 * 39248
u_str ESTAB 0 0 * 39309 * 39308
u_str ESTAB 0 0 /run/systemd/journal/stdout 38165 * 38164
u_str ESTAB 0 0 * 39250 * 39251
u_str ESTAB 0 0 * 39251 * 39250
u_str ESTAB 0 0 * 38164 * 38165
u_str ESTAB 0 0 * 34452 * 34453
u_str ESTAB 0 0 * 39248 * 39246
u_str ESTAB 0 0 * 34711 * 34712
u_dgr UNCONN 0 0 * 35686 * 8951
u_str ESTAB 0 0 * 39242 * 39243
u_str ESTAB 0 0 /run/dbus/system_bus_socket 36842 * 36841
u_str ESTAB 0 0 * 39303 * 39302
u_str ESTAB 0 0 * 39239 * 39240
u_str ESTAB 0 0 * 36841 * 36842
u_str ESTAB 0 0 * 39302 * 39303
u_str ESTAB 0 0 * 39243 * 39242
u_dgr UNCONN 0 0 * 1027790 * 8951
u_str ESTAB 0 0 * 39308 * 39309
u_str ESTAB 0 0 /run/systemd/journal/stdout 34516 * 34515
u_str ESTAB 0 0 * 34941 * 34942
u_str ESTAB 0 0 * 39306 * 39305
u_str ESTAB 0 0 * 39240 * 39239
u_str ESTAB 0 0 * 39267 * 39266
u_str ESTAB 0 0 * 39305 * 39306
u_str ESTAB 0 0 * 34467 * 34713
u_str ESTAB 0 0 * 39257 * 39258
u_str ESTAB 0 0 * 21706 * 21707
u_str ESTAB 0 0 /run/dbus/system_bus_socket 34713 * 34467
u_str ESTAB 0 0 * 39258 * 39257
u_str ESTAB 0 0 * 34554 * 34718
u_str ESTAB 0 0 /run/systemd/journal/stdout 21707 * 21706
u_str ESTAB 0 0 * 39255 * 39254
u_dgr UNCONN 0 0 * 34788 * 0
u_str ESTAB 0 0 * 39261 * 39260
u_str ESTAB 0 0 * 34712 * 34711
u_str ESTAB 0 0 /run/systemd/journal/stdout 38295 * 38294
u_str ESTAB 0 0 * 35633 * 35634
u_dgr UNCONN 0 0 * 34536 * 8949
u_str ESTAB 0 0 * 39260 * 39261
u_str ESTAB 0 0 /run/dbus/system_bus_socket 34718 * 34554
u_dgr UNCONN 0 0 * 21422 * 8926
u_str ESTAB 0 0 * 39266 * 39267
u_str ESTAB 0 0 * 34515 * 34516
u_str ESTAB 0 0 * 38294 * 38295
u_str ESTAB 0 0 * 39439 * 39440
u_dgr UNCONN 0 0 * 1109850 * 8949
u_dgr UNCONN 0 0 * 39330 * 8951
u_str ESTAB 0 0 * 39254 * 39255
u_str ESTAB 0 0 /run/systemd/journal/stdout 35634 * 35633
u_dgr UNCONN 0 0 * 39608 * 8951
u_str ESTAB 0 0 * 39300 * 39299
u_str ESTAB 0 0 /run/dbus/system_bus_socket 39440 * 39439
u_str ESTAB 0 0 * 39299 * 39300
u_str ESTAB 0 0 /run/systemd/journal/stdout 34942 * 34941
u_str ESTAB 0 0 * 39279 * 39278
u_str ESTAB 0 0 * 35709 * 35710
u_str ESTAB 0 0 * 39278 * 39279
u_str ESTAB 0 0 * 39276 * 39275
u_str ESTAB 0 0 * 35569 * 35570
u_str ESTAB 0 0 * 39264 * 39263
u_str ESTAB 0 0 * 39282 * 39281
u_str ESTAB 0 0 * 39281 * 39282
u_str ESTAB 0 0 /run/systemd/journal/stdout 34391 * 34390
u_dgr UNCONN 0 0 * 22225 * 22226
u_str ESTAB 0 0 /run/systemd/journal/stdout 34158 * 34157
u_dgr UNCONN 0 0 * 22207 * 8949
u_str ESTAB 0 0 * 39270 * 39269
u_dgr UNCONN 0 0 * 35775 * 8951
u_dgr UNCONN 0 0 * 22226 * 22225
u_str ESTAB 0 0 * 39269 * 39270
u_dgr UNCONN 0 0 * 681719 * 8951
u_str ESTAB 0 0 * 34157 * 34158
u_str ESTAB 0 0 * 34885 * 34886
u_str ESTAB 0 0 * 39275 * 39276
u_dgr UNCONN 0 0 * 33504 * 8951
u_str ESTAB 0 0 * 39263 * 39264
u_str ESTAB 0 0 * 39273 * 39272
u_str ESTAB 0 0 /run/dbus/system_bus_socket 35570 * 35569
u_str ESTAB 0 0 * 39272 * 39273
u_str ESTAB 0 0 * 33516 * 33515
u_str ESTAB 0 0 * 39294 * 39293
u_str ESTAB 0 0 * 39293 * 39294
u_str ESTAB 0 0 * 34390 * 34391
u_str ESTAB 0 0 /run/dbus/system_bus_socket 34886 * 34885
u_str ESTAB 0 0 * 39291 * 39290
u_dgr UNCONN 0 0 * 1205914 * 8951
u_dgr UNCONN 0 0 * 35332 * 8951
u_str ESTAB 0 0 * 39297 * 39296
u_dgr UNCONN 0 0 * 35296 * 8951
u_str ESTAB 0 0 /run/systemd/journal/stdout 22196 * 22195
u_str ESTAB 0 0 * 39296 * 39297
u_str ESTAB 0 0 * 22195 * 22196
u_str ESTAB 0 0 * 39287 * 39288
u_str ESTAB 0 0 /run/dbus/system_bus_socket 35710 * 35709
u_str ESTAB 0 0 * 39285 * 39284
u_str ESTAB 0 0 * 33515 * 33516
u_str ESTAB 0 0 * 39284 * 39285
u_str ESTAB 0 0 * 39290 * 39291
u_dgr UNCONN 0 0 * 39213 * 8951
u_str ESTAB 0 0 * 39288 * 39287
raw UNCONN 0 0 :::58 :::*
tcp LISTEN 0 128 *:22 *:*
tcp LISTEN 0 100 127.0.0.1:25 *:*
tcp ESTAB 0 0 192.168.141.128:22 192.168.141.1:65423
tcp ESTAB 0 0 192.168.141.128:22 192.168.141.1:60176
tcp LISTEN 0 128 :::22 :::*
tcp LISTEN 0 100 ::1:25 :::*
v_str ESTAB 0 0 2993521101:1023 0:976
[root@linux-01 ceshi]#
## ss -an | grep -i listen Only view the status of network interface back listening ##
[root@linux-01 ceshi]# ss -an | grep -i listen
u_str LISTEN 0 100 private/trace 39265 * 0
u_str LISTEN 0 100 private/verify 39268 * 0
u_str LISTEN 0 100 private/proxywrite 39277 * 0
u_str LISTEN 0 100 private/retry 39292 * 0
u_str LISTEN 0 100 private/discard 39295 * 0
u_str LISTEN 0 100 private/local 39298 * 0
u_str LISTEN 0 100 private/virtual 39301 * 0
u_str LISTEN 0 100 private/lmtp 39304 * 0
u_str LISTEN 0 100 private/anvil 39307 * 0
u_str LISTEN 0 100 private/scache 39310 * 0
u_seq LISTEN 0 128 /run/udev/control 21315 * 0
u_str LISTEN 0 100 private/defer 39262 * 0
u_str LISTEN 0 32 /var/run/vmware/guestServicePipe 35410 * 0
u_str LISTEN 0 128 /run/systemd/private 21140 * 0
u_str LISTEN 0 100 private/smtp 39280 * 0
u_str LISTEN 0 100 private/relay 39283 * 0
u_str LISTEN 0 100 private/error 39289 * 0
u_str LISTEN 0 100 public/pickup 39241 * 0
u_str LISTEN 0 100 public/cleanup 39245 * 0
u_str LISTEN 0 100 public/qmgr 39249 * 0
u_str LISTEN 0 100 public/flush 39271 * 0
u_str LISTEN 0 100 public/showq 39286 * 0
u_str LISTEN 0 100 private/proxymap 39274 * 0
u_str LISTEN 0 100 private/tlsmgr 39253 * 0
u_str LISTEN 0 100 private/rewrite 39256 * 0
u_str LISTEN 0 100 private/bounce 39259 * 0
u_str LISTEN 0 128 /run/lvm/lvmetad.socket 21223 * 0
u_str LISTEN 0 128 /run/lvm/lvmpolld.socket 21226 * 0
u_str LISTEN 0 128 /run/dbus/system_bus_socket 34025 * 0
u_str LISTEN 0 128 /run/systemd/journal/stdout 8946 * 0
tcp LISTEN 0 128 *:22 *:*
tcp LISTEN 0 100 127.0.0.1:25 *:*
tcp LISTEN 0 128 :::22 :::*
tcp LISTEN 0 100 ::1:25 :::*
[root@linux-01 ceshi]#
## The following command can view the status in the network interface ##
[root@linux-01 ceshi]# netstat -an | awk '/^tcp/ {++sta[$NF]} END {for(key in sta) print key,"\t",sta[key]}'
LISTEN 4
ESTABLISHED 2
[root@linux-01 ceshi]# 10. Capturing packets under Linux
## By default, the system does not tcpdump Command, required yum Install it  ##
[root@linux-01 ceshi]# tcpdump
-bash: tcpdump: Command not found
[root@linux-01 ceshi]#   yum install -y tcpdump
 Plug in loaded: fastestmirror
Repository base is listed more than once in the configuration
Repository updates is listed more than once in the configuration
Repository extras is listed more than once in the configuration
Repository centosplus is listed more than once in the configuration
Loading mirror speeds from cached hostfile
epel/x86_64/metalink                                                                                              | 5.8 kB  00:00:00
 * base: mirrors.163.com
 * epel: mirrors.tuna.tsinghua.edu.cn
 * extras: mirrors.cn99.com
 * updates: mirrors.nju.edu.cn
base                                                                                                              | 3.6 kB  00:00:00
epel                                                                                                              | 4.7 kB  00:00:00
extras                                                                                                            | 3.4 kB  00:00:00
updates                                                                                                           | 3.4 kB  00:00:00
(1/2): epel/x86_64/updateinfo                                                                                     | 986 kB  00:00:01
(2/2): epel/x86_64/primary_db                                                                                     | 6.7 MB  00:01:34
Resolving dependencies
--> Checking transactions
---> software package tcpdump.x86_64.14.4.9.2-3.el7 Will be installed
--> Processing dependencies libpcap >= 14:1.5.3-10,It is supported by software package 14:tcpdump-4.9.2-3.el7.x86_64 need
--> Processing dependencies libpcap.so.1()(64bit),It is supported by software package 14:tcpdump-4.9.2-3.el7.x86_64 need
--> Checking transactions
---> software package libpcap.x86_64.14.1.5.3-11.el7 Will be installed
--> Resolve dependency complete

Dependency resolution

=========================================================================================================================================
 Package                        framework                          edition                                     source                           size
=========================================================================================================================================
Installing:
 tcpdump                        x86_64                        14:4.9.2-3.el7                           base                        421 k
 Install for dependency:
 libpcap                        x86_64                        14:1.5.3-11.el7                          base                        138 k

Transaction summary
=========================================================================================================================================
Install 1 package (+1 Dependent packages)

Total downloads: 559 k
 Installation size: 1.3 M
Downloading packages:
(1/2): libpcap-1.5.3-11.el7.x86_64.rpm                                                                            | 138 kB  00:00:00
(2/2): tcpdump-4.9.2-3.el7.x86_64.rpm                                                                             | 421 kB  00:00:00
-----------------------------------------------------------------------------------------------------------------------------------------
total                                                                                                     2.5 MB/s | 559 kB  00:00:00
Running transaction check
Running transaction test
Transaction test succeeded
Running transaction
  Installing    : 14:libpcap-1.5.3-11.el7.x86_64                                                                                       1/2
  Installing    : 14:tcpdump-4.9.2-3.el7.x86_64                                                                                        2/2
  Verification in progress      : 14:tcpdump-4.9.2-3.el7.x86_64                                                                                        1/2
  Verification in progress      : 14:libpcap-1.5.3-11.el7.x86_64                                                                                       2/2

already installed:
  tcpdump.x86_64 14:4.9.2-3.el7

Installed as a dependency:
  libpcap.x86_64 14:1.5.3-11.el7

complete!
[root@linux-01 ceshi]#
## tcpdump   -nn (display ip (address)-i ((specify network card name)##
[root@linux-01 ceshi]# tcpdump  -nn -i ens33
tcpdump: verbose output suppressed, use -v or -vv for full protocol decode
listening on ens33, link-type EN10MB (Ethernet), capture size 262144 bytes
23:38:58.029804 IP 192.168.141.128.22 > 192.168.141.1.60176: Flags [P.], seq 143933360:143933572, ack 2117960428, win 318, length 212
23:38:58.030089 IP 192.168.141.1.60176 > 192.168.141.128.22: Flags [.], ack 212, win 250, length 0
23:38:58.030728 IP 192.168.141.128.22 > 192.168.141.1.60176: Flags [P.], seq 212:504, ack 1, win 318, length 292
23:38:58.031099 IP 192.168.141.128.22 > 192.168.141.1.60176: Flags [P.], seq 504:668, ack 1, win 318, length 164
23:38:58.031299 IP 192.168.141.1.60176 > 192.168.141.128.22: Flags [.], ack 668, win 255, length 0
23:38:58.031689 IP 192.168.141.128.22 > 192.168.141.1.60176: Flags [P.], seq 668:944, ack 1, win 318, length 276
23:38:58.032000 IP 192.168.141.128.22 > 192.168.141.1.60176: Flags [P.], seq 944:1108, ack 1, win 318, length 164
23:38:58.032164 IP 192.168.141.1.60176 > 192.168.141.128.22: Flags [.], ack 1108, win 254, length 0
23:38:58.032476 IP 192.168.141.128.22 > 192.168.141.1.60176: Flags [P.], seq 1108:1384, ack 1, win 318, length 276
23:38:58.032773 IP 192.168.141.128.22 > 192.168.141.1.60176: Flags [P.], seq 1384:1564, ack 1, win 318, length 180
23:38:58.032916 IP 192.168.141.1.60176 > 192.168.141.128.22: Flags [.], ack 1564, win 252, length 0
23:38:58.033153 IP 192.168.141.128.22 > 192.168.141.1.60176: Flags [P.], seq 1564:1840, ack 1, win 318, length 276
23:38:58.033565 IP 192.168.141.128.22 > 192.168.141.1.60176: Flags [P.], seq 1840:2020, ack 1, win 318, length 180
23:38:58.033715 IP 192.168.141.1.60176 > 192.168.141.128.22: Flags [.], ack 2020, win 250, length 0

##  You can set not to use that port and that ip My bag ##
[root@linux-01 ceshi]# tcpdump -nn -i ens33 not port 22  and host 192.168.141.1
tcpdump: verbose output suppressed, use -v or -vv for full protocol decode
listening on ens33, link-type EN10MB (Ethernet), capture size 262144 bytes
^C
0 packets captured
0 packets received by filter
0 packets dropped by kernel
[root@linux-01 ceshi]#

## Grab a package and save it to a file ##
[root@linux-01 ceshi]# tcpdump -nn -i ens33 -c 100 -w 1.cap
tcpdump: listening on ens33, link-type EN10MB (Ethernet), capture size 262144 bytes
^C4 packets captured
5 packets received by filter
0 packets dropped by kernel
[root@linux-01 ceshi]# ls
#  1.cap  1.txt  2.sh  exec.sh  passwd  passwd1  source.sh

[root@linux-01 ceshi]# tcpdump -nn -i ens33 -c 10 -w 1.cap
tcpdump: listening on ens33, link-type EN10MB (Ethernet), capture size 262144 bytes
10 packets captured
10 packets received by filter
0 packets dropped by kernel
[root@linux-01 ceshi]# file 1.cap
1.cap: tcpdump capture file (little-endian) - version 2.4 (Ethernet, capture length 262144)
[root@linux-01 ceshi]# tcpdump  -r 1.cap
reading from file 1.cap, link-type EN10MB (Ethernet)
00:57:33.051784 IP linux-01.ssh > 192.168.141.1.60176: Flags [P.], seq 144863656:144863804, ack 2117974276, win 362, length 148
00:57:33.052190 IP 192.168.141.1.60176 > linux-01.ssh: Flags [.], ack 148, win 251, length 0
00:57:34.528624 IP 192.168.141.1 > igmp.mcast.net: igmp v3 report, 1 group record(s)
00:57:34.528666 IP6 fe80::41c8:1472:340f:c8db > ff02::16: HBH ICMP6, multicast listener report v2, 1 group record(s), length 28
00:57:34.587128 IP 192.168.141.1 > igmp.mcast.net: igmp v3 report, 1 group record(s)
00:57:34.587165 IP6 fe80::41c8:1472:340f:c8db > ff02::16: HBH ICMP6, multicast listener report v2, 1 group record(s), length 28
00:57:34.587190 IP6 fe80::41c8:1472:340f:c8db.53559 > ff02::1:3.hostmon: UDP, length 33
00:57:34.587204 IP 192.168.141.1.52209 > 224.0.0.252.hostmon: UDP, length 33
00:57:34.681633 IP6 fe80::41c8:1472:340f:c8db.53559 > ff02::1:3.hostmon: UDP, length 33
00:57:34.681701 IP 192.168.141.1.52209 > 224.0.0.252.hostmon: UDP, length 33
[root@linux-01 ceshi]#
## install tshark command ##
yum install -y wireshark
## View the address of a web user accessing the server ##
shark -n -t a -R http.request -T fields -e "frame.time" -e "ip.src" -e "http.host" -e "http.request.method" -e "http.request.uri"
11.linux network related
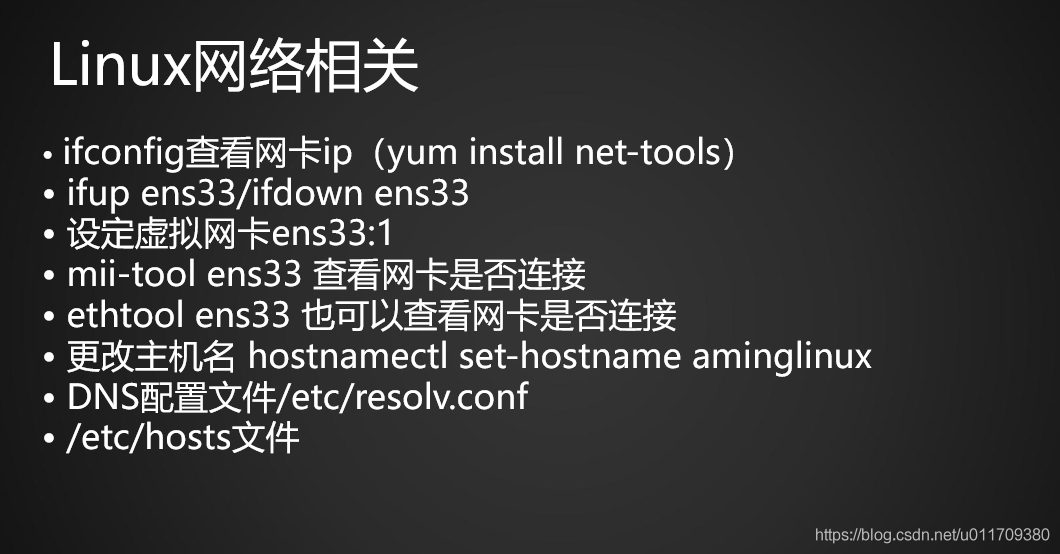
11.1 setting up a virtual network card
- To set up a virtual network card:
- A copy of the network card ifcfg-ens33 of the system is copied and renamed ifcfg-ens33:0
- Change ifcfg-ens33:0 information, network card name and ip address
- Restart the network card ens33
[root@linux-01 ceshi]# ifconfig
ens33: flags=4163<UP,BROADCAST,RUNNING,MULTICAST>  mtu 1500
        inet 192.168.141.128  netmask 255.255.255.0  broadcast 192.168.141.255
        inet6 fe80::8db4:d867:92de:d2d1  prefixlen 64  scopeid 0x20<link>
        ether 00:0c:29:6d:81:cc  txqueuelen 1000  (Ethernet)
        RX packets 352365  bytes 47836917 (45.6 MiB)
        RX errors 0  dropped 0  overruns 0  frame 0
        TX packets 151822  bytes 33225129 (31.6 MiB)
        TX errors 0  dropped 0 overruns 0  carrier 0  collisions 0

lo: flags=73<UP,LOOPBACK,RUNNING>  mtu 65536
        inet 127.0.0.1  netmask 255.0.0.0
        inet6 ::1  prefixlen 128  scopeid 0x10<host>
        loop  txqueuelen 1000  (Local Loopback)
        RX packets 0  bytes 0 (0.0 B)
        RX errors 0  dropped 0  overruns 0  frame 0
        TX packets 0  bytes 0 (0.0 B)
        TX errors 0  dropped 0 overruns 0  carrier 0  collisions 0

[root@linux-01 ~]# cd /etc/sysconfig/network-scripts/
[root@linux-01 network-scripts]# CP ifcfg-ens33: ifcfg-ens33 \: 0 / / the backslash here is for the comment colon
[root@linux-01 network-scripts]# ls
ifcfg-ens33    ifdown-bnep  ifdown-isdn    ifdown-sit       ifup          ifup-ippp  ifup-plusb   ifup-sit       ifup-wireless
ifcfg-ens33:0  ifdown-eth   ifdown-post    ifdown-Team      ifup-aliases  ifup-ipv6  ifup-post    ifup-Team      init.ipv6-global
ifcfg-lo       ifdown-ippp  ifdown-ppp     ifdown-TeamPort  ifup-bnep     ifup-isdn  ifup-ppp     ifup-TeamPort  network-functions
ifdown         ifdown-ipv6  ifdown-routes  ifdown-tunnel    ifup-eth      ifup-plip  ifup-routes  ifup-tunnel    network-functions-ipv6

[root@linux-01 network-scripts]# vim ifcfg-ens33:0
TYPE=Ethernet
PROXY_METHOD=none
BROWSER_ONLY=no
BOOTPROTO=static
DEFROUTE=yes
IPV4_FAILURE_FATAL=no
IPV6INIT=yes
IPV6_AUTOCONF=yes
IPV6_DEFROUTE=yes
IPV6_FAILURE_FATAL=no
IPV6_ADDR_GEN_MODE=stable-privacy
NAME=ens33:0
UUID=a6258a23-8add-4e49-b1f8-799e60a3bdbe
DEVICE=ens33:0
ONBOOT=yes
IPADDR=192.168.141.122
NETMASK=255.255.255.0
GATEWAY=192.168.141.2

## If you are using a remotely connected server, try not to apply ifdown ens33,To close the network card, you need to start the network card from this computer ##
[root@linux-01 network-scripts]# ifdown ens33 && ifup ens33
 Successfully disconnected the device 'ens33'.
The connection was successfully activated( D-Bus Active path:/org/freedesktop/NetworkManager/ActiveConnection/4)
[root@linux-01 network-scripts]# ifconfig
ens33: flags=4163<UP,BROADCAST,RUNNING,MULTICAST>  mtu 1500
        inet 192.168.141.128  netmask 255.255.255.0  broadcast 192.168.141.255
        inet6 fe80::8db4:d867:92de:d2d1  prefixlen 64  scopeid 0x20<link>
        ether 00:0c:29:6d:81:cc  txqueuelen 1000  (Ethernet)
        RX packets 353689  bytes 47962251 (45.7 MiB)
        RX errors 0  dropped 0  overruns 0  frame 0
        TX packets 152668  bytes 33335091 (31.7 MiB)
        TX errors 0  dropped 0 overruns 0  carrier 0  collisions 0

ens33:0: flags=4163<UP,BROADCAST,RUNNING,MULTICAST>  mtu 1500
        inet 192.168.141.122  netmask 255.255.255.0  broadcast 192.168.141.255
        ether 00:0c:29:6d:81:cc  txqueuelen 1000  (Ethernet)

lo: flags=73<UP,LOOPBACK,RUNNING>  mtu 65536
        inet 127.0.0.1  netmask 255.0.0.0
        inet6 ::1  prefixlen 128  scopeid 0x10<host>
        loop  txqueuelen 1000  (Local Loopback)
        RX packets 0  bytes 0 (0.0 B)
        RX errors 0  dropped 0  overruns 0  frame 0
        TX packets 0  bytes 0 (0.0 B)
        TX errors 0  dropped 0 overruns 0  carrier 0  collisions 0
11.2 check whether the network card is connected
[root@linux-01 network-scripts]# mii-tool ens33
ens33: negotiated 1000baseT-FD flow-control, link ok
[root@linux-01 network-scripts]#

[root@linux-01 network-scripts]# ethtool  ens33
Settings for ens33:
	Supported ports: [ TP ]
	Supported link modes:   10baseT/Half 10baseT/Full
	                        100baseT/Half 100baseT/Full å
	                        1000baseT/Full
	Supported pause frame use: No
	Supports auto-negotiation: Yes
	Supported FEC modes: Not reported
	Advertised link modes:  10baseT/Half 10baseT/Full
	                        100baseT/Half 100baseT/Full
	                        1000baseT/Full
	Advertised pause frame use: No
	Advertised auto-negotiation: Yes
	Advertised FEC modes: Not reported
	Speed: 1000Mb/s
	Duplex: Full
	Port: Twisted Pair
	PHYAD: 0
	Transceiver: internal
	Auto-negotiation: on
	MDI-X: off (auto)
	Supports Wake-on: d
	Wake-on: d
	Current message level: 0x00000007 (7)
			       drv probe link
	Link detected: yes      //Check whether the status here is yes or no
[root@linux-01 network-scripts]#
11.3 change host name
Using hostnamectl, only centos7 has the command, but centos6 does not
[root@linux-01 ~]# hostnamectl set-hostname  linux-001
[root@linux-01 ~]# hostname
linux-001
[root@linux-01 ~]# bash
[root@linux-001 ~]# exit
exit
[root@linux-01 ~]#
11.4 dns configuration file / etc / resolv conf
/etc/resolv.conf this configuration file is a dns configuration file. If you modify this configuration file, you will read the dns configuration information in the network card configuration after logging in to the system again.
[root@linux-01 ~]# cat /etc/resolv.conf
; generated by /usr/sbin/dhclient-script
search localdomain
nameserver 192.168.141.2
[root@linux-01 ~]#
11.5 hosts file
[root@linux-01 ~]# cat /etc/hosts
127.0.0.1   localhost localhost.localdomain localhost4 localhost4.localdomain4
::1         localhost localhost.localdomain localhost6 localhost6.localdomain6
[root@linux-01 ~]# vim /etc/hosts
127.0.0.1   localhost localhost.localdomain localhost4 localhost4.localdomain4
::1         localhost localhost.localdomain localhost6 localhost6.localdomain6
192.168.141.128 www.baidu.com www.qq.com

[root@linux-01 ~]# ping www.baidu.com
PING www.baidu.com (192.168.141.128) 56(84) bytes of data.
64 bytes from www.baidu.com (192.168.141.128): icmp_seq=1 ttl=64 time=0.159 ms
64 bytes from www.baidu.com (192.168.141.128): icmp_seq=2 ttl=64 time=0.120 ms
64 bytes from www.baidu.com (192.168.141.128): icmp_seq=3 ttl=64 time=0.096 ms
^C
--- www.baidu.com ping statistics ---
3 packets transmitted, 3 received, 0% packet loss, time 2000ms
rtt min/avg/max/mdev = 0.096/0.125/0.159/0.025 ms
[root@linux-01 ~]# ping www.qq.com
PING www.baidu.com (192.168.141.128) 56(84) bytes of data.
64 bytes from www.baidu.com (192.168.141.128): icmp_seq=1 ttl=64 time=0.116 ms
64 bytes from www.baidu.com (192.168.141.128): icmp_seq=2 ttl=64 time=0.095 ms
^C
--- www.baidu.com ping statistics ---
2 packets transmitted, 2 received, 0% packet loss, time 999ms
rtt min/avg/max/mdev = 0.095/0.105/0.116/0.014 ms
[root@linux-01 ~]#
After class summary
1. Three handshakes and four waves
1.1 establishing connection: three handshakes
Small example of three handshakes: In the Red Army era, company A and company B were divided on the left and right wings and agreed to launch A strike together at A certain time. This information needs to be transmitted manually through the messenger. So the commander of company A sent A correspondent. This is the first time. If the correspondent arrives at company B and tells the commander of company B when and when, the commander of company B will ask the correspondent to go back and inform the commander of company A. the poor correspondent can only return to company a at risk, because if the commander of company a can't see the return of the correspondent, he doesn't know when and when the information has been transmitted to company B. This is the second time. Now the commander of company B began to worry about whether the correspondent returned to company A. if he did not return, the commander of company B would put himself in a position and think that the commander of company a would not dare to fight if he could not see the returning correspondent. Therefore, the commander of company B most expected to see the correspondent appear in company B again, so the commander of company a would ask the correspondent to return to company B again. This is the third time. This is the third handshake Since the TCP connection is full duplex, each direction must be closed separately. This principle is that when one party completes the data transmission task, it sends a FIN to terminate the connection in this direction. Receiving a FIN only means that there is no data flow in this direction, that is, it will not receive data again, but it can still send data on this TCP connection, Until FIN is also sent in this direction. The first party performing the shutdown will perform the active shutdown, while the other party will perform the passive shutdown, as described in the figure below.
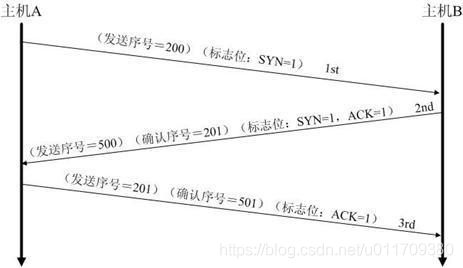
TCP connection process: in TCP/IP protocol, TCP protocol provides reliable connection service, and uses three handshakes to establish a connection. First handshake: when establishing A connection, client A sends SYN packet (SYN=j) to server B and enters SYN_SEND status, waiting for server B to confirm. The second handshake: when server B receives the SYN packet, it must confirm the SYN(ACK=j+1) of client A. at the same time, it also sends a SYN packet (SYN=k), that is, SYN+ACK packet. At this time, server B enters SYN_RECV status. The third Handshake: client A receives the SYN + ACK packet from server B and sends A confirmation packet ACK(ACK=k+1) to server B. after the packet is sent, client A and server B enter the ESTABLISHED state and complete the three handshakes. After three handshakes, the client and server start transmitting data.
SYN attack: during three handshakes, after the server sends SYN-ACK, the TCP connection before receiving the client's ACK is called half open connect). The server is in Syn_RECV status After receiving the ACK, the server turns to the ESTABLISHED state Syn attacks are attacks on clients Forge a large number of non-existent IP addresses in a short time, and constantly send syn packets to the server. The server replies to the confirmation packets and waits for the confirmation of the customer. Since the source address does not exist, the server needs to continuously resend direct messages At timeout, these forged SYN packets will occupy the unconnected queue for a long time, the normal SYN requests will be discarded, and the target system will run slowly. In serious cases, it will cause network congestion and even system paralysis. Syn attack is a typical DDOS attack. It is very convenient to detect syn attacks. When you see a large number of semi connected states on the server, especially when the source IP address is random, you can basically conclude that this is a syn attack Under Linux, the following commands can be used to detect whether SYN is attacked netstat -n -p TCP | grep SYN_RECV Generally, the newer TCP/IP protocol stack modifies this process to prevent syn attack and modify the tcp protocol implementation. The main methods include SynAttackProtect protection mechanism and syn Cookie technology, increasing maximum half connection and shortening timeout, etc However, it can not completely prevent syn attacks.
1.2 closing the connection: four waves
The removal of TCP connection requires sending four packets, so it is called four-way handshake. The client or server can initiate the wave action actively. In socket programming, either party can perform the close() operation to generate the wave operation.
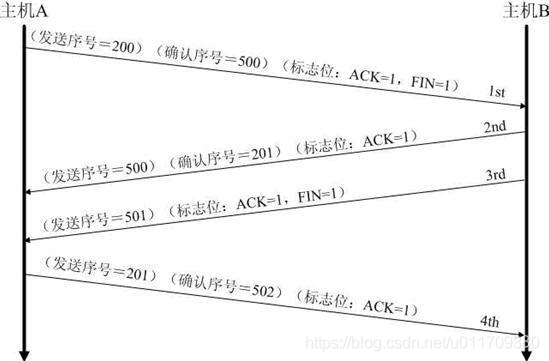
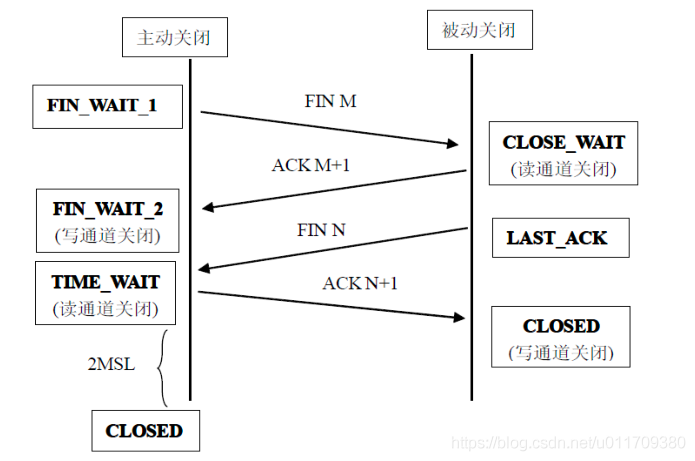
First wave: The Client sends a FIN to close the data transfer from the Client to the Server, and the Client enters the FIN_WAIT_1 status. Second wave: After receiving the FIN, the Server sends an ACK to the Client to confirm that the serial number is the received serial number + 1 (the same as SYN, one FIN occupies one serial number), and the Server enters CLOSE_WAIT status. Third wave: The Server sends a FIN to close the data transfer from the Server to the Client, and the Server enters LAST_ACK status. Fourth wave: The client sends back ACK message for confirmation, and sets the confirmation sequence number to the received sequence number plus 1
1.3 three handshakes and four waves
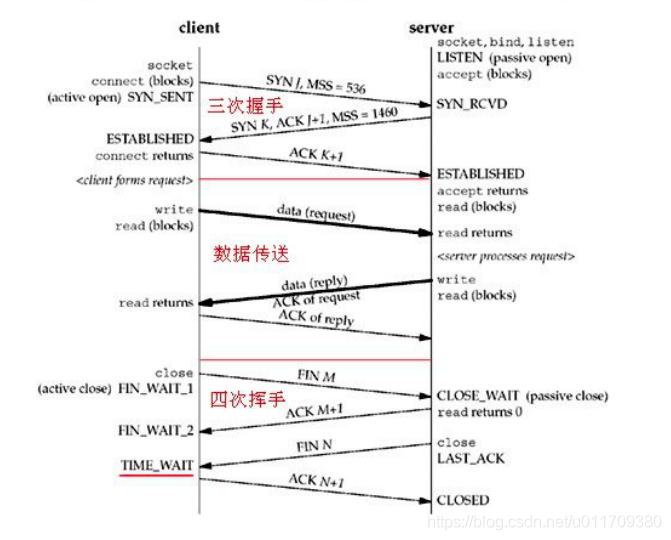
Triple handshake status:
CLOSED: initial state, indicating that the TCP connection is "CLOSED" or "not open". LISTEN: indicates that a SOCKET on the server side is listening and can accept connections from the client. SYN_RCVD: indicates that syn message has been received. Under normal circumstances, this state is an intermediate state during the three handshake sessions of the server-side SOCKET when establishing a TCP connection. It is very short. It is basically difficult to see this state with netstat, unless a monitoring program is deliberately written to not send the last ACK message during the three TCP handshakes. When the TCP connection is in this state and receives the ACK message from the client, it will enter the ESTABLISHED state. SYN_SENT: this status is associated with syn_ The RCVD status echoes. When the client SOCKET executes connect() to connect, it first sends syn message, and then enters syn_ Send status and wait for the server to send the second message of the three handshakes. SYN_SENT status indicates that the client has sent syn message. ESTABLISHED: indicates that the TCP connection has been successfully ESTABLISHED.
Four wave states:
FIN_WAIT_1: This state needs to be explained. In fact, FIN_WAIT_1 and FIN_WAIT_2. The real meaning of both States is to wait for the fin message of the other party. The difference between these two states is: FIN_WAIT_1 status actually means that when the SOCKET is in the ESTABLISHED status, it wants to actively close the connection and sends fin message to the other party. At this time, the SOCKET enters FIN_WAIT_1 status. When the other party responds to the ACK message, it enters FIN_WAIT_2 status. Of course, under the actual normal circumstances, no matter what the other party is in, it should immediately respond to the ACK message, so FIN_WAIT_1 status is generally difficult to see, while FIN_WAIT_2. Sometimes the status can still be seen with netstat. FIN_WAIT_2: The origin of this state has been explained above. In fact, FIN_WAIT_2. SOCKET in the state indicates a semi connection, that is, one party calls close() to actively request to close the connection. Note: FIN_WAIT_2 is no timeout (unlike the TIME_WAIT state). In this state, if the other party does not close (does not cooperate to complete the 4 wave processes), this FIN_WAIT_2. The status will remain until the system is restarted, and more and more FIN_WAIT_2 state will cause kernel crash. TIME_WAIT: indicates that the FIN message of the other party has been received and the ACK message has been sent. TIME_ The TCP connection in the wait state will wait for 2*MSL (Max Segment Lifetime refers to the maximum lifetime of a TCP message on the Internet. Each specific TCP protocol implementation must select a certain MSL value. RFC 1122 recommends 2 minutes, but the traditional BSD implementation takes 30 seconds. Linux can see the local value through cat /proc/sys/net/ipv4/tcp_fin_timeout) , and then you can return to the CLOSED available state. If FIN_WAIT_1. When receiving the message with FIN flag and ACK flag from the other party, you can directly enter TIME_WAIT status without going through FIN_WAIT_2 status. CLOSING: this state should be very rare in practice. It belongs to a relatively rare exception state. Under normal circumstances, when one party sends FIN message, it should receive (or receive) the other party's ACK message first, and then the other party's FIN message. However, the CLOSING status indicates that one party did not receive the other party's ACK message after sending the FIN message, but also received the other party's FIN message. Under what circumstances will this happen? That is, when both parties close() a SOCKET almost at the same time, both parties send FIN messages at the same time. This is a CLOSING state, indicating that both parties are CLOSING the SOCKET connection. CLOSE_WAIT: indicates that it is waiting for shutdown. How to understand? When the other party closes () a SOCKET and sends a FIN message to itself, your system will undoubtedly respond to an ACK message to the other party. At this time, the TCP connection enters CLOSE_WAIT status. Next, you need to check whether you still have data to send to the other party. If not, you can close() the SOCKET and send a FIN message to the other party, that is, close your connection to the other party in this direction. If there is data, it depends on the program's strategy and continues to send or discard. Simply put, when you are in close_ In the wait state, what needs to be done is waiting for you to close the connection. LAST_ACK: when the passive Closing Party waits for the other party's ACK message after sending FIN message, it is in LAST_ACK status. After receiving the ACK message from the other party, you can enter the CLOSED available state.
2. Use of IP command
- Setting and deleting IP ip addr add 192.168.10.10/24 dev eth0 ip addr show eth0 ip addr del 192.168.10.10/24 dev eth0
- Routing related settings ip route show ip route add default via 192.168.10.1 ip route add 192.168.5.0/24 dev eth0 ip route del 192.168.10.1
- In addition, use the route command to manage routes: (a) . network routing route add -net 192.168.1.0/24 gw 172.16.1.106 (b) Host routing route add -host 192.168.1.110 gw 172.16.1.106 (c) . default route route add default gw 172.16.1.106 or route add -net 0.0.0.0 gw 172.16.1.106 (d) , delete route route del -host 192.168.1.110 route del -net 192.168.1.0/24
- Display network statistics ip -s link ip -s -s link ls eth0
- Stop opening the network card ip link set eth0 down ip linke set eth0 up
3. Change the network card name
ip link set ens37 name eth1 Permanent storage: https://blog.csdn.net/jyusun/article/details/71513086