pandas, as a necessary toolkit for data processing, records the learning process
The default processing object of pandas is DataFrame, which is loaded after installation
catalogue
1, Interpretation of the meaning of code examples
(1)pd.read_csv and pandas read various pits and common parameters of csv files
4.1 Python pandas determines the missing value isnull()
4.2isnull().sum() counts the number of empty columns
(6)df ['Sentence#'].nunique(),df.Word.nunique(),df.Tag.nunique()
(7)df.groupby('Tag').size().reset_index(name='counts')
(1) Classified by keyword, if mean () is not used The sum () function is a group type data
1, Interpretation of the meaning of code examples
import pandas as pd
#The entire dataset cannot be loaded into the memory of a computer, so we selected the first 100000 records,
# The out of core learning algorithm is used to obtain and process data effectively.
df= pd.read_csv('D:\120.python\Scripts\data set\First data set\ner_dataset.csv',encoding="ISO-8859-1")#ISO-8859-1 is English by default, and ISO-8859-1 is changed to gbk support Chinese
df= df [:100000]
df.head()#df.head() will regard the first row in the excel table as the column name and output the following five rows by default. Write the number of rows you want to output directly in the brackets behind head, such as 2, 10100 and so on.
df.isnull().sum()
#Data preprocessing
#We notice that there are many NaN values in the "sense" column, and we populate NaN with the previous values.
df= df.fillna(method='ffill')
df ['Sentence#'].nunique(),df.Word.nunique(),df.Tag.nunique()#(4544,10922,17)
(1)pd.read_csv and pandas read various pits and common parameters of csv files
df= pd.read_csv('D:0.python\Scripts \ dataset \ first data \ ner_dataset.csv',encoding="ISO-8859-1")
Read xls and csv
pd.read_csv() ; pd.to_csv();
pd.read_excel() ; pd.to_excel()
So this line means reading Chinese data
pd.read_csv('xx.csv',header=None)
- Header: if the column name of the first row needs to be set to header=None, reset the column name, and set names = ['A', 'B', 'C']
- sep: set separator. For example, if \ t is used as separator, sep = '\ t'
- Encoding: encoding format. For example, encoding = 'utf-8'. Experience is that csv modified by excel in windows environment will become gbk encoding. ISO-8859-1 is English by default, and ISO-8859-1 is changed to gbk support Chinese
- na_filter: whether to check for missing values (empty string or empty value). For large files, there is no null value in the dataset. Set na_filter=False can improve the reading speed.
- error_bad_lines: error when reading the file: expect 7 fields, saw 8, etc. if this line is not important, skip this line and set error_bad_lines=False
- skip_blank_lines: if True, skip blank lines; Otherwise, it is recorded as NaN.
- parse_dates: resolves some columns into date type, and parse can be set_ dates=[‘A’]
- keep_date_col: if multiple columns are connected and the date is resolved, the columns participating in the connection will be maintained. The default is False
(2) The entire dataset cannot be loaded into the memory of a computer, so we selected the first 100000 record slices
df= df [:100000]
(3)df.head()
df.head()Will excel The first row in the table is regarded as the column name, and the following five rows are output by default head It's OK to write the number of lines you want to output directly in the brackets, such as 2, 10100 and so on.
df is the abbreviation of DataFrame, which represents the data read in. For example, the simplest example:
import pandas as pd
df = pd.read_excel(r'C:\Users\Shan\Desktop\x.xlsx')
print(df.head())
excel sheet:

Output results:
(4)df.isnull().sum()
4.1 Python pandas determines the missing value isnull()
For element level judgment, list the positions of all corresponding elements. If the element is empty or NA, it will display True, otherwise it will be False
python pandas generally uses {isnull() to judge the missing value, but it generates a true / false matrix of all data. For a huge data dataframe, it is difficult to see which data is missing, how many missing data are there, and where the missing data is located.
Praise first and then read. The original text is very good
Turn from https://blog.csdn.net/u012387178/article/details/52571725
df.isnull().any() will judge which "columns" have missing values, and one of them is true
4.2isnull().sum() counts the number of empty columns
(5) df.fillna() function, in parameter method, the values of pad ',' fill ',' backfill ',' bfill ', and None are different
Original link: https://blog.csdn.net/weixin_45456209/article/details/107951433
(6)df ['Sentence#'].nunique(),df.Word.nunique(),df.Tag.nunique()
The result is:
(4544,10922,17)
#We have 4544 sentences that contain 10922 unique words and are labeled with 17 Tags.
(7)df.groupby('Tag').size().reset_index(name='counts')
groupby
df2
      data1     data2 key1 key2
0 -0.511381  0.967094    a  one
1 -0.545078  0.060804    a  two
2  0.025434  0.119642    b  one
3  0.056192  0.133754    b  two
4  1.258052  0.922588    a  one
(1) Classified by keyword, if mean () is not used The sum () function is a group type data
df2 = pd.DataFrame({'key1':['a','a','b','b','a'],'key2':['one','two','one','two','one'],'data1':np.random.randn(5),'data2':np.random.randn(5)})<br>
df2.groupby('key1').mean()
         data1     data2
key1
a     0.067198  0.650162
b     0.040813  0.126698
df2.groupby(['key1','key2']).mean()
              data1     data2
key1 key2
a    one   0.373335  0.944841
     two  -0.545078  0.060804
b    one   0.025434  0.119642
     two   0.056192  0.133754
(2) Perform function manipulation on the group data and apply(),agg()
apply() applies all data
df2.groupby('key1').apply(np.mean)
         data1     data2
key1
a     0.067198  0.650162
b     0.040813  0.126698
(3) agg() applies a column
  group2=df2.groupby('key1')
group2
<pandas.core.groupby.DataFrameGroupBy object at 0x000001C6A964D518>
group2['data1'].agg('mean')
key1
a    0.067198
b    0.040813
I have a data frame df, and I use its columns to group by:
df['col1','col2','col3','col4'].groupby(['col1','col2']).mean()
In the above way, I almost got the table (data frame) I needed. What is missing is an additional column that contains the number of rows in each group. In other words, I'm interesting, but I also want to know how many numbers are used to obtain these means. For example, there are 8 values in the first group, 10 values in the second group, and so on.
In short: how to obtain the grouping statistics of data frames?
For those unfamiliar with this problem, in the updated version of pandas, you can call describe() on the group by object to effectively return common statistics. See this answer for more information.
Quick answer:
The easiest way to get the number of rows per group is to call size(), return Series:
df.groupby(['col1','col2']).size()
Typically, you want this result to be a dataframe (not a Series), so you can do the following:
df.groupby(['col1', 'col2']).size().reset_index(name='counts')
Refer to this article
(8)df.drop('Tag',axis= 1)
df.drop ('column name', axis=1) means to delete the column labels corresponding to 'column name' along the horizontal direction.
Understanding: simply remember that axis=0 stands for down, and axis=1 stands for across, as an adverb of method action. In other words, a value of 0 indicates that the method is executed downward along the label \ index value of each column or row; A value of 1 indicates that the corresponding method is executed along the label direction of each row or column.
Axis axis is used to define attributes for arrays with more than one dimension. Two dimensional data has two axes: axis 0 extends vertically down the row and axis 1 extends horizontally along the column.
(9) Feature transformation
v= DictVectorizer(sparse= False)
X= v.fit_transform(X.to_dict('records'))
from sklearn.feature_extraction import DictVectorizer dict_vec = DictVectorizer(sparse=False)# #sparse=False means that sparse matrices are not generated X_train = dict_vec.fit_transform(X_train.to_dict(orient='record')) X_test = dict_vec.transform(X_test.to_dict(orient='record')) print(dict_vec.feature_names_)#View converted column names print(X_train)#View converted training sets
['age','pclass=1st', 'pclass=2nd', 'pclass=3rd', 'sex=female', 'sex=male']
[[31.19418104  0.          0.          1.          0.          1.        ]
 [31.19418104  1.          0.          0.          1.          0.        ]
 [31.19418104  0.          0.          1.          0.          1.        ]
 ...
 [12.          0.          1.          0.          1.          0.        ]
 [18.          0.          1.          0.          0.          1.        ]
 [31.19418104  0.          0.          1.          1.          0.        ]]
The original pclass and sex columns are as follows:
full[['Pclass','Sex']].head()
	Pclass	Sex
0	3	male
1	1	female
2	3	female
3	1	female
4	3	male
That is, pclass and sex are transformed into numerical variables (only 0 and 1), and the numerical type of age column remains unchanged, so as to achieve the recognition purpose of machine learning.
(9)np. Usage of unique()
This function is output after removing duplicate numbers from the array and sorting.

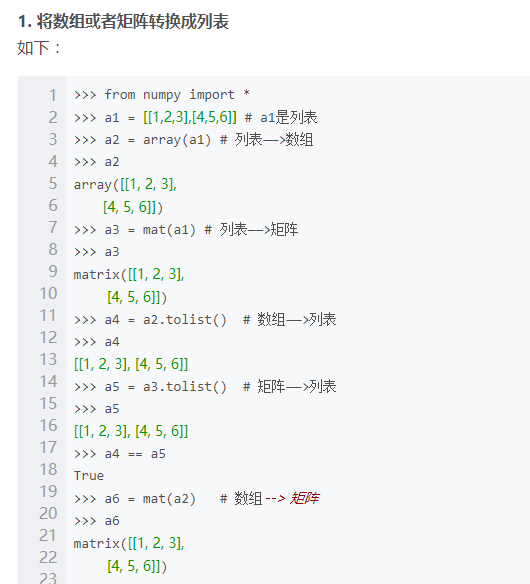
(10) tolist() in python