Pandas
Series object
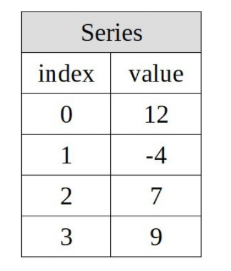
The Series object is used to represent a one-dimensional data structure. Each element of its main array will have an associated label. (roughly as shown in the figure below)
Object declaration
By PD Series(). If no label is specified, the value incremented once from 0 is used as the label by default.
s = pd.Series([12, -4, 7, 9])
print(s)
------------------------------------
0    12
1    -4
2     7
3     9
dtype: int64
s = pd.Series([12, -4, 7, 9], index=["A", "B", "C", "D"])
print(s)
-------------------------------
A    12
B    -4
C     7
D     9
dtype: int64
Of course, objects can also be declared in other forms (the operation is as follows:
Note that in this case, if the value of the original object changes, the elements in the Series object will also change.
arr = np.array([1, 2, 3, 4])
s = pd.Series(arr)
print(s)
--------------------------------
0    1
1    2
2    3
3    4
dtype: int32
Series can also be initialized using a dictionary (its format is almost the same as that of a dictionary).
my_dict = {"red":100, "blue":200,"green":300}
s = pd.Series(my_dict)
print(s)
-----------------------------------
red      100
blue     200
green    300
dtype: int64
Property acquisition
There is no doubt that you can get two properties of Seris, Index and Values.
s = pd.Series([12, -4, 7, 9], index = ["A", "B", "C", "D"])
print(s)
print("values:",s.values)
print("index:",s.index)
----------------------------------
A    12
B    -4
C     7
D     9
dtype: int64
values: [12 -4  7  9]
index: Index(['A', 'B', 'C', 'D'], dtype='object')
Object operation
Element assignment
Assign values to elements by subscript or index.
s = pd.Series([12, -4, 7, 9], index=["A", "B", "C", "D"])
print(s)
s[0] = 0
print("0:",s[0])
s["B"] = 0
print("B",s["B"])
-----------------------------------
A    12
B    -4
C     7
D     9
dtype: int64
0: 0
B 0
Element filtering
S [S > x], used to filter elements in the Series array whose element value is greater than x.
s = pd.Series([10, 5, -5, 12], index=["A", "B", "C", "D"])
print(s)
print()
print(s[s > 8])
--------------------------
A    10
B     5
C    -5
D    12
dtype: int64

A    10
D    12
dtype: int64
Element operation
Since Series can be regarded as an upgraded version of np.array, the performance of both object operation and mathematical function is the same. (addition, subtraction, multiplication and division, logarithm, etc., no more demonstration
import pandas as pd
s = pd.Series([12, 5, 4, 9])
print(s)
s = s - 2
print(s)
-------------------------
0    12
1     5
2     4
3     9
dtype: int64
0    10
1     3
2     2
3     7
dtype: int64
Element de duplication
To de duplicate a Series object, you need to call the function unique(). Note that the order may change after de duplication.
import pandas as pd
s = pd.Series([12, 5, 9, 4, 4, 5, 5])
print("Before weight removal:",s.values)
s = s.unique()
print("After weight removal",s)
--------------------------------------
Before weight removal: [12  5  9  4  4  5  5]
After weight removal [12  5  9  4]
Element occurrence frequency
The frequency of elements in the function $Series.value_counts() can be calculated.
s = pd.Series([12, 5, 5, 5, 1, 1, 2])
print(s.value_counts())
---------------------------------
5     3
1     2
12    1
2     1
dtype: int64
Ownership judgment
Use the function Series.isin() to judge. In addition, it can also be used as a filter condition.
s = pd.Series([1, 5, 8, 10, 15])
print(s.isin([5,10]))
print()
print(s[s.isin([5, 10])])
--------------------------------------
0    False
1     True
2    False
3     True
4    False
dtype: bool

1     5
3    10
dtype: int64
NaN
NaN, i.e. Not a Number, can be used when a property is lost (or not collected) during data processing. In addition, it can be used in combination with isnull() and notnull(). (No
In addition, please note that although NaN is introduced in Pandas, its declaration is np.NaN.
isnull() is a function that isnull can regard as an attribute and can be used to filter elements.
s = pd.Series([12, 5, np.NaN, 10])
print(s[pd.isnull])
print()
print(s.isnull())
print()
print(s.notnull())
-----------------------------------
2   NaN
dtype: float64

0    False
1    False
2     True
3    False
dtype: bool

0     True
1     True
2    False
3     True
dtype: bool
Operation of object
Considering the operation between Series objects, it is actually similar to the broadcast mechanism of array, but the difference is that only the attributes with a common label (index) will have results, otherwise it is Nan (non number).
s1 = pd.Series([10, 5, 2],index=["R", "G", "B"])
s2 = pd.Series([5, 2, 1],index=["G", "B", "F"])
print(s1 + s2)
----------------------------------
B     4.0
F     NaN
G    10.0
R     NaN
dtype: float64
DataFrame object
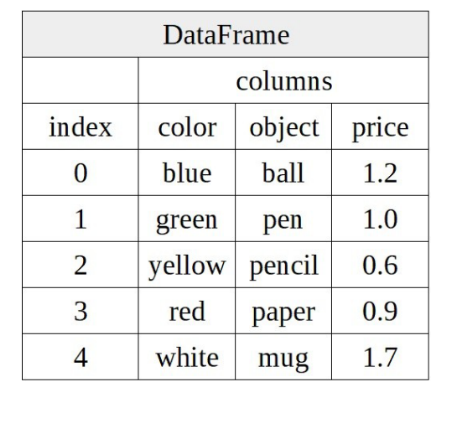
DateFrame is actually a multidimensional Series (or a combination of multiple Series). It has two indexes, row index and column index (you can think of the column index in DataFrame as the row index in a single Series).
You can also think of DataFrame as a dictionary composed of Series.
Object declaration
It can be initialized through a dictionary + list.
my_dict = {"color":["R", "G", "B"],
           "object":["you", "me", "him"],
           "value":[1, 3, 5]}

frame = pd.DataFrame(my_dict,index=["A", "B", "C"])
print(frame)
-------------------------------------
  color object  value
A     R    you      1
B     G     me      3
C     B    him      5
The attribute clolumns exists in the DataFrame, which can purify the list or be used when initializing the DataFrame.
my_dict = {"color":["R", "G", "B"],
           "object":["you", "me", "him"],
           "value":[1, 3, 5]}
frame = pd.DataFrame(my_dict, columns=["color","value"])
print(frame)
-------------------------------------
  color  value
0     R      1
1     G      3
2     B      5
frame = pd.DataFrame(np.arange(25).reshape(5, 5), columns=["A", "B", "C", "D", "E"],
                     index=["1", "2", "3", "4", "5"])
print(frame)
------------------------------------
    A   B   C   D   E
1   0   1   2   3   4
2   5   6   7   8   9
3  10  11  12  13  14
4  15  16  17  18  19
5  20  21  22  23  24
Object operation
Element selection
Considering that DataFrames have many properties, there are many methods to select elements.
DataFrame.columns: get the names of all columns (actually the top row)
dict_data = {"color":["R", "G", "B"],
             "object":["pen","pan","pencil"],
             "value":[100, 200, 300]}
frame = pd.DataFrame(dict_data)
print(frame.columns)
--------------------------------
Index(['color', 'object', 'value'], dtype='object')
DataFrame.values: get each element in it and store it as a list. ([column name 1_1, column name 1_2,...], [],...)
dict_data = {"color":["R", "G", "B"],
             "object":["pen","pan","pencil"],
             "value":[100, 200, 300]}
frame = pd.DataFrame(dict_data)
print(frame.values)
------------------------------------------
[['R' 'pen' 100]
 ['G' 'pan' 200]
 ['B' 'pencil' 300]]
DataFrame.index: get the row index (actually the row standing on the left ~)
dict_data = {"color":["R", "G", "B"],
             "object":["pen","pan","pencil"],
             "value":[100, 200, 300]}
frame = pd.DataFrame(dict_data)
print(frame.index)
-------------------------------------
RangeIndex(start=0, stop=3, step=1)
Get directly through the index (since it is [], you can certainly get pull ~)
dict_data = {"color":["R", "G", "B"],
             "object":["pen","pan","pencil"],
             "value":[100, 200, 300]}
frame = pd.DataFrame(dict_data)
print(frame["value"])
print()
print(frame.loc[1])
print()
print(frame["object"][1])
----------------------------
0    100
1    200
2    300
Name: value, dtype: int64

color       G
object    pan
value     200
Name: 1, dtype: object

pan
Multiline selection (i.e. slicing of arrays)
It should be noted here that frame[0:2] is the correct operation, while frame[0] is the wrong operation!
dict_data = {"color":["R", "G", "B"],
             "object":["pen","pan","pencil"],
             "value":[100, 200, 300]}
frame = pd.DataFrame(dict_data)
print(frame[0:2])
---------------------------------
  color object  value
0     R    pen    100
1     G    pan    200
Element assignment
The assignment of some values is like a Series object, but there is also the operation of adding columns in the DataFrame~
ps: I can't understand why here A is in the front
frame = pd.DataFrame(np.arange(25).reshape(5, 5),
                     columns=["A", "B", "C", "D", "E"],
                     index=["a", "b", "c", "d", "e"])
frame["A"]["a"] = 100
print(frame)
-------------------------------
     A   B   C   D   E
a  100   1   2   3   4
b    5   6   7   8   9
c   10  11  12  13  14
d   15  16  17  18  19
e   20  21  22  23  24
Add a new column. Simply use frame [] = [], which is similar to adding a dictionary.
However, please keep the number of elements consistent~
frame = pd.DataFrame(np.arange(25).reshape(5, 5),
                     columns=["A", "B", "C", "D", "E"],
                     index=["a", "b", "c", "d", "e"])
frame["hahaha!"] = [1, 2, 3, 4, 5]
print(frame)
---------------------------
    A   B   C   D   E  hahaha!
a   0   1   2   3   4        1
b   5   6   7   8   9        2
c  10  11  12  13  14        3
d  15  16  17  18  19        4
e  20  21  22  23  24        5
Affiliation
It is roughly the same as that in Series, which is not explained too much.
(ps: you can compare the results above and below
frame = pd.DataFrame(np.arange(25).reshape(5, 5),
                     columns=["A", "B", "C", "D", "E"],
                     index=["a", "b", "c", "d", "e"])
print(frame.isin([4, 1]))
------------------------------------
	   A      B      C      D      E  hahaha!
a  False   True  False  False   True     True
b  False  False  False  False  False    False
c  False  False  False  False  False    False
d  False  False  False  False  False     True
e  False  False  False  False  False    False
Element filtering
Same as above. (just look at the code
frame = pd.DataFrame(np.arange(25).reshape(5, 5),
                     columns=["A", "B", "C", "D", "E"],
                     index=["a", "b", "c", "d", "e"])
print(frame[frame >= 20])
#Here, the array name may also represent the variable name of each element
-------------------------------------
      A     B     C     D     E  hahaha!
a   NaN   NaN   NaN   NaN   NaN      NaN
b   NaN   NaN   NaN   NaN   NaN      NaN
c   NaN   NaN   NaN   NaN   NaN      NaN
d   NaN   NaN   NaN   NaN   NaN      NaN
e  20.0  21.0  22.0  23.0  24.0      NaN
Delete column
Call del DataFrame [column name] (it is widely used, but it is also explained)
frame = pd.DataFrame(np.arange(25).reshape(5, 5),
                     columns=["A", "B", "C", "D", "E"],
                     index=["a", "b", "c", "d", "e"])
del frame["A"]
print(frame)
-----------------------------
    B   C   D   E
a   1   2   3   4
b   6   7   8   9
c  11  12  13  14
d  16  17  18  19
e  21  22  23  24
Transpose
Transpose by calling the property T in the DataFrame.
frame = pd.DataFrame(np.arange(25).reshape(5, 5),
                     columns=["A", "B", "C", "D", "E"],
                     index=["a", "b", "c", "d", "e"])
print(frame.T)
---------------------------
   a  b   c   d   e
B  1  6  11  16  21
C  2  7  12  17  22
D  3  8  13  18  23
E  4  9  14  19  24
Index object
The Index object is the axis (horizontal and vertical) of the array used above.
Method use
Get the minimum value of the index, XXX.idxmin().
s = pd.Series([5, 10, 15, 20],index=["a1", "b2", "c3", "d4"])
print(s.index)
print(s.idxmin())
---------------------------
Index(['a1', 'b2', 'c3', 'd4'], dtype='object')
a1
Gets the maximum value of the index, XXX.idxmax().
ps: the comparison method is to compare various strings. The comparison method between strings will not be explained too much.
s = pd.Series([5, 10, 15, 20],index=["a1", "b2", "c3", "d4"])
print(s.index)
print(s.idxmax())
----------------------------------------
Index(['a1', 'b2', 'c3', 'd4'], dtype='object')
d4
Index replacement
When you are not satisfied with the current index in the array, you can use the reindex() function to replace the index of the object.
In addition, if a new index is added, NaN will be added as the value of the new index.
(in addition, why not initialize the index to your satisfaction from the beginning (No
s = pd.Series([5, 10, 15, 20],index=["a1", "b2", "c3", "d4"])
print(s)
s = s.reindex(["a1", "B", "c3", "D","d4"])
print(s)
-----------------------------
a1     5
b2    10
c3    15
d4    20
dtype: int64

a1     5.0
B      NaN
c3    15.0
D      NaN
d4    20.0
dtype: float64
reindex() has the parameter method, which is the filling method of the parameter.
If method = "fill", i.e. front fill, fill the current NaN value with the previous subscript.
method = "bfill", i.e. back fill, is opposite to the above description.
frame = pd.DataFrame(np.arange(9).reshape(3, 3),columns=["A", "B", "C"],
                     index=["a", "b", "c"])
print(frame)
frame = frame.reindex(["a", "d", "daa!", "b"],method="ffill")
print(frame)
------------------------------------------
   A  B  C
a  0  1  2
b  3  4  5
c  6  7  8

       A  B  C
a      0  1  2
d      6  7  8
daa!  6  7  8
b      3  4  5
Or, you can directly use fill_value = 0, that is, fill the default NaN to 0.
(this will not be demonstrated anymore) ▔﹏▔▔▔▔▔▔
Delete index
It is the same as del Array [], but it is handled by another function. drop().
ps: Series(DataFrame, too) seems to be immutable, so use s = s.drop("A") instead of just s.drop("A"). Remember.
s = pd.Series(np.arange(4), index=["A", "B", "C", "d"])
print(s)
print()
s = s.drop("A")
print(s)
--------------------------
A    0
B    1
C    2
d    3
dtype: int32

B    1
C    2
d    3
dtype: int32
Data alignment
As with the addition between Series, due to the length is too long, it will not be explained.
Operations between data structures
Data structures can be directly operated by arithmetic operators. Of course, the same purpose can be achieved by the following methods.
add()
sub()
div ()
sub()
Words are like people, no longer explain.
Operation
Demonstrate the principle of operation through addition.
Note that the Series here is aligned with the column names of the DataFrame, not the index.
frame = pd.DataFrame(np.arange(9).reshape(3, 3),
                     index = ["A", "B", "C"],
                     columns=["a", "b", "c"])

ser = pd.Series(np.arange(3), index=["a", "b", "c"])

print(frame + ser)
-------------------------------
   a  b   c
A  0  2   4
B  3  5   7
C  6  8  10
Other operations are the same as the above demonstration.
Function application and mapping
General function
square root
np.sqrt() can find the square root of each element in the sequence.
frame = pd.DataFrame(np.arange(9).reshape(3, 3),
                     columns=["A", "B", "C"],
                     index=["a", "B", "c"])
print(np.sqrt(frame))
--------------------------------------------
    A         B         C
a  0.000000  1.000000  1.414214
B  1.732051  2.000000  2.236068
c  2.449490  2.645751  2.828427
Summation and average
np.sum() is used to find the sum of the elements of the sequence, and np.mean() is used to find the average value of the sequence. Among them, the more important is. describe().
frame = pd.DataFrame(np.arange(9).reshape(3, 3),
                     columns=["A", "B", "C"],
                     index=["a", "B", "c"])
print(np.sum(frame))
print()
print(np.mean(frame))
print()
print(frame.describe())
------------------------------
A     9
B    12
C    15
dtype: int64

A    3.0
B    4.0
C    5.0
dtype: float64

         A    B    C
count  3.0  3.0  3.0
mean   3.0  4.0  5.0
std    3.0  3.0  3.0
min    0.0  1.0  2.0
25%    1.5  2.5  3.5
50%    3.0  4.0  5.0
75%    4.5  5.5  6.5
max    6.0  7.0  8.0
Relevance
This can be achieved through DataFrame.corr().
frame = pd.DataFrame(np.arange(25).reshape(5, 5),
                     columns = ["B", "C", "A", "D", "E"],
                     index=["a", "c", "b", "d", "e"])
print(frame.corr())
----------------------------
     B    C    A    D    E
B  1.0  1.0  1.0  1.0  1.0
C  1.0  1.0  1.0  1.0  1.0
A  1.0  1.0  1.0  1.0  1.0
D  1.0  1.0  1.0  1.0  1.0
E  1.0  1.0  1.0  1.0  1.0
Covariance
It can be realized simply through. cov() (please don't write the function yourself!
frame = pd.DataFrame(np.arange(25).reshape(5, 5),
                     columns = ["B", "C", "A", "D", "E"],
                     index=["a", "c", "b", "d", "e"])
print(frame.cov())
-------------------------------
      B     C     A     D     E
B  62.5  62.5  62.5  62.5  62.5
C  62.5  62.5  62.5  62.5  62.5
A  62.5  62.5  62.5  62.5  62.5
D  62.5  62.5  62.5  62.5  62.5
E  62.5  62.5  62.5  62.5  62.5
Sorting and ranking
Through the function dataframe sort_ Index(), which has two parameters: ascending, which is used to specify whether to sort in descending order (False) or ascending order (True and the default value); for $axis, when axis = 0, it is sorted by column (and the default value), and when axis = 1, it is sorted by row.
Note that the permutations mentioned here are for Index rather than Value.
frame = pd.DataFrame(np.arange(25).reshape(5, 5),
                     columns = ["B", "C", "A", "D", "E"],
                     index=["a", "c", "b", "d", "e"])
print(frame)
print()
print(frame.sort_index(ascending=False))
print()
print(frame.sort_index(axis=1))
----------------------------------------------
    B   C   A   D   E
a   0   1   2   3   4
c   5   6   7   8   9
b  10  11  12  13  14
d  15  16  17  18  19
e  20  21  22  23  24

    B   C   A   D   E
e  20  21  22  23  24
d  15  16  17  18  19
c   5   6   7   8   9
b  10  11  12  13  14
a   0   1   2   3   4

    A   B   C   D   E
a   2   0   1   3   4
c   7   5   6   8   9
b  12  10  11  13  14
d  17  15  16  18  19
e  22  20  21  23  24
Of course, you can also sort based on the columns you give, such as sort_values(by = ["A", "B"]), and the results will not be demonstrated.
Ranking operation
Use DataFrame.rank() to arrange seats (but I can't understand the practical significance).
frame = pd.DataFrame(np.arange(25).reshape(5, 5),
                     columns = ["B", "C", "A", "D", "E"],
                     index=["a", "c", "b", "d", "e"])
print(frame.rank())
--------------------------------------
     B    C    A    D    E
a  1.0  1.0  1.0  1.0  1.0
c  2.0  2.0  2.0  2.0  2.0
b  3.0  3.0  3.0  3.0  3.0
d  4.0  4.0  4.0  4.0  4.0
e  5.0  5.0  5.0  5.0  5.0
NaN data
NaN filtration
. dropna() and notnull() filtering can achieve the purpose of filtering out NaN elements.
When using dropna(), it should be noted that the whole row or column may be NaN, so you need to set the how parameter variable. If how = "any", the row or column will be deleted as long as there is a default value. If how = "all", it will be deleted only when all values are NaN.
frame = pd.DataFrame([[1, 2, 3], [np.nan, np.nan, np.nan], [4, 5, 6]]
                     ,columns=["A", "B", "C"],
                     index=["a", "b", "c"])
print(frame)

print()

print(frame.dropna(how="all"))
--------------------------------------
     A    B    C
a  1.0  2.0  3.0
b  NaN  NaN  NaN
c  4.0  5.0  6.0


     A    B    C
a  1.0  2.0  3.0
c  4.0  5.0  6.0
Fill NaN
Use. fillna(x) to transform the NaN of the sequence into an x value~
frame = pd.DataFrame([[1, 2, 3], [np.nan, np.nan, np.nan], [4, 5, 6]]
                     ,columns=["A", "B", "C"],
                     index=["a", "b", "c"])
print(frame)
print()
print(frame.fillna(0))
------------------------------------
     A    B    C
a  1.0  2.0  3.0
b  NaN  NaN  NaN
c  4.0  5.0  6.0

     A    B    C
a  1.0  2.0  3.0
b  0.0  0.0  0.0
c  4.0  5.0  6.0
Adjustment of hierarchical order
(it's too complicated and not commonly used. Let's skip it...)....