- About the author: daemon Wu, Linux kernel performance optimization engineer, works in a micro mobile phone factory, engaged in mobile phone performance optimization. Motto: unity of knowledge and practice.
- Original creation: all kinds of community original good articles delivered by taixiao readers.
- Copyright notice: This article was first published in the WeChat official account of "Tai Xiao technology". Please welcome the reprint and reprint. Please keep this statement at the beginning of the article.
catalogue
3. Parse the target file through readelf and llvm objdump
3.2 # print the contents of each paragraph
3.3 # parsing BPF ELF format files through llvm objdump
4. Trace and analyze eBPF program behavior through strace tool
4.1} BPF bytecode loading analysis
4.2} MAP data communication analysis
5. Introduction to bpftool usage
1. Preface
eBPF compiles C code into BPF bytecode in the Linux kernel and hangs it on hooks such as kprobe/tracepoint. When "hook" is triggered, the Linux kernel runs bytecode to track performance.
2. eBPF framework
<Linux eBPF: kprobes injection of bcc usage and principle> This chapter describes how to call the basic process between BPF and bcc.
In the Linux kernel, there are many examples of bpf programs in the {sample/bpf} directory to} tracex4_kern.c # and # tracex4_user.c , as an example.
The following figure is the framework of eBPF program, which is divided into program execution flow and data communication flow.
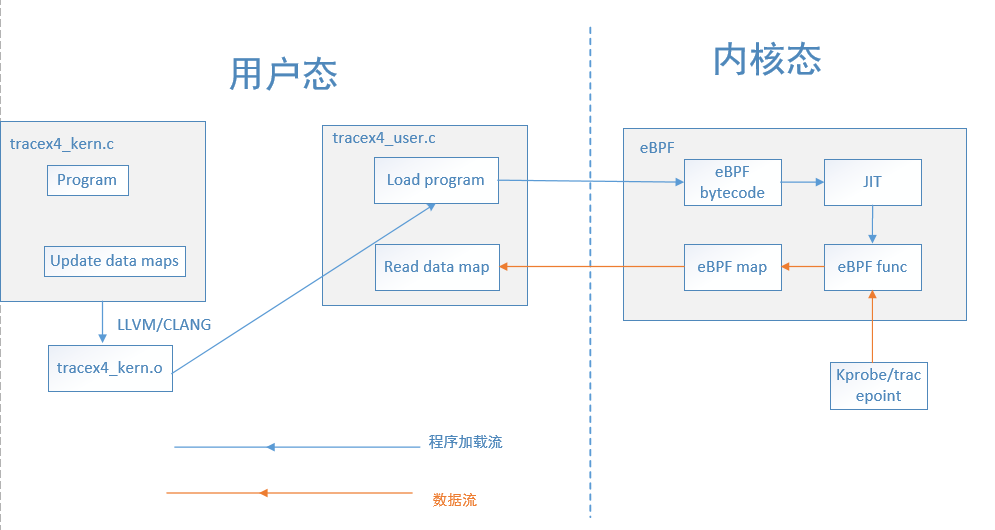
For program execution flow,
- trace_kern.c ¢ is the code called when allocating the slab and releasing the slab, which declares the hook processing function and data map. The data map is used for data communication between kernel state and user state, which is compiled into bpf bytecode by LLVM/clang compiler
- trace_user.c) it is used to load bpf bytecode and fall into the kernel state. The bpf bytecode is converted into machine sink code through JIT(just in time) compiler. When kprobe or tracepoint tracks a certain kind of event, it executes the hook processing function declared above, obtains the data map and transmits the data to userspace
2.1 tracex4_kern.c
A data map of "my_map" is defined. The data map is composed of # key/value # key value pairs. Here, value is a variable of structure, which is used to obtain the current running time and ip register. The data map is composed of__ attribute__ Declaration is a separate section. When it is compiled into an ELF format file, the structure variable exists in the "maps" section.
The next statement is to allocate the slab, release the hook processing function of the slab and put it separately in kprobe/kmem_cache_free,kretprobe/kmem_cache_alloc_node # in two code snippets.
#include <linux/version.h>
#include <uapi/linux/bpf.h>
#include "bpf_helpers.h"
struct pair {
	u64 val;
	u64 ip;
};
struct bpf_map_def SEC("maps") my_map = {
	.type = BPF_MAP_TYPE_HASH,
	.key_size = sizeof(long),
	.value_size = sizeof(struct pair),
	.max_entries = 1000000,
};
SEC("kprobe/kmem_cache_free")
int bpf_prog1(struct pt_regs *ctx)
{
	long ptr = PT_REGS_PARM2(ctx);
	bpf_map_delete_elem(&my_map, &ptr);
	return 0;
}
SEC("kretprobe/kmem_cache_alloc_node")
int bpf_prog2(struct pt_regs *ctx)
{
	long ptr = PT_REGS_RC(ctx);
	long ip = 0;
	/* get ip address of kmem_cache_alloc_node() caller */
	BPF_KRETPROBE_READ_RET_IP(ip, ctx);
	struct pair v = {
		.val = bpf_ktime_get_ns(),
		.ip = ip,
	};
	bpf_map_update_elem(&my_map, &ptr, &v, BPF_ANY);
	return 0;
}
char _license[] SEC("license") = "GPL";
u32 _version SEC("version") = LINUX_VERSION_CODE;
Compiled using clang o , file is also an ELF file. You can use llvm dump to output each section table. For example, for the above customized sections, you can use , SEC to customize a section:
#define SEC(NAME) __attribute__((section(NAME), used))
2.2 tracex4_user.c
A pair structure is defined to accept the data of the hook processing function. First, load {tracex4_kern.o. Then poll to obtain data in the dead cycle, and then print it with # printf #:
#include <stdio.h>
#include <stdlib.h>
#include <signal.h>
#include <unistd.h>
#include <stdbool.h>
#include <string.h>
#include <time.h>
#include <linux/bpf.h>
#include <sys/resource.h>
#include <bpf/bpf.h>
#include "bpf_load.h"
struct pair {
	long long val;
	__u64 ip;
};
static __u64 time_get_ns(void)
{
	struct timespec ts;
	clock_gettime(CLOCK_MONOTONIC, &ts);
	return ts.tv_sec * 1000000000ull + ts.tv_nsec;
}
static void print_old_objects(int fd)
{
	long long val = time_get_ns();
	__u64 key, next_key;
	struct pair v;
	key = write(1, "\e[1;1H\e[2J", 12); /* clear screen */
	key = -1;
	while (bpf_map_get_next_key(map_fd[0], &key, &next_key) == 0) {
		bpf_map_lookup_elem(map_fd[0], &next_key, &v);
		key = next_key;
		if (val - v.val < 1000000000ll)
			/* object was allocated more then 1 sec ago */
			continue;
		printf("obj 0x%llx is %2lldsec old was allocated at ip %llx\n",
		       next_key, (val - v.val) / 1000000000ll, v.ip);
	}
}
int main(int ac, char **argv)
{
	struct rlimit r = {RLIM_INFINITY, RLIM_INFINITY};
	char filename[256];
	int i;
	snprintf(filename, sizeof(filename), "%s_kern.o", argv[0]);
	if (setrlimit(RLIMIT_MEMLOCK, &r)) {
		perror("setrlimit(RLIMIT_MEMLOCK, RLIM_INFINITY)");
		return 1;
	}
	if (load_bpf_file(filename)) {
		printf("%s", bpf_log_buf);
		return 1;
	}
	for (i = 0; ; i++) {
		print_old_objects(map_fd[1]);
		sleep(1);
	}
}
3. Parse the target file through readelf and llvm objdump
3.1 # read ELF file header
wu@ubuntu:~/linux/samples/bpf$ readelf -h tracex4_kern.o
ELF Header:
  Magic:   7f 45 4c 46 02 01 01 00 00 00 00 00 00 00 00 00
  Class:			     ELF64
  Data: 			     2's complement, little endian
Version: 1 (current)
OS/ABI: UNIX - System V
ABI Version: 0
Type: REL (Relocatable file)
Machine: Linux BPF
Version: 0x1
Entry point address: 0x0
Start of program headers: 0 (bytes into file)
Start of section headers: 8344 (bytes into file)
Flags: 0x0
Size of this header: 64 (bytes)
Size of program headers: 0 (bytes)
Number of program headers: 0
Size of section headers: 64 (bytes)
Number of section headers: 27
Section header string table index: 1
In the readelf output:
Line 1, ELF Header: name the beginning of ELF file header.
Line 2, Magic magic number, is used to indicate that the file is an ELF target file.
- The first byte 7F is a fixed number;
- The last three bytes are the ASCII form of E, l and F.
In line 3, CLASS indicates the file type. Here is the 64 bit ELF format.
In line 4, Data indicates the format in which the Data in the file is organized (big end or small end). The Data organization format of different processor platforms may be different. For example, x86 platform is a small end storage format.
Line 5, the current ELF file header version number, where the version number is 1.
Line 6, OS/ABI, indicates the operating system type. ABI is the abbreviation of Application Binary Interface.
Line 7, ABI version number, currently 0.
In line 8, Type indicates the file Type. There are three types of ELF files, one is the Relocatable file as shown above, the other is the executable file, and the other is the shared library.
Line 9, machine platform type. Here is the bpf virtual machine line 10, the version number of the current target file.
Line 11 is the virtual address entry point of the program. Because this is not a runnable program, it is zero here.
Line 12 is the same as line 11. There is no Program Headers in this object file.
Line 13, the beginning of the sections header. Here 8344 is decimal, indicating that it starts from the address offset 0x2098.
Line 14 is a flag associated with the processor, which is 0 on x86 platforms.
Line 15, the number of bytes in the ELF file header.
In line 16, because this is not an executable program, the size here is 0. In line 19, how many section headers are there? Here are 27.
3.2 # print the contents of each paragraph
wu@ubuntu:~/linux/samples/bpf$ readelf -S tracex4_kern.o
There are 27 section headers, starting at offset 0x2098:
Section Headers:
  [Nr] Name		 Type		  Address	    Offset
       Size		 EntSize	  Flags  Link  Info  Align
  [ 0]			 NULL		  0000000000000000  00000000
       0000000000000000  0000000000000000	    0	  0	0
  [ 1] .strtab		 STRTAB 	  0000000000000000  00001f80
       0000000000000115  0000000000000000	    0	  0	1
  [ 2] .text		 PROGBITS	  0000000000000000  00000040
       0000000000000000  0000000000000000  AX	    0	  0	4
  [ 3] kprobe/kmem_cache PROGBITS	  0000000000000000  00000040
       0000000000000048  0000000000000000  AX	    0	  0	8
  [ 4] .relkprobe/kmem_c REL		  0000000000000000  00001870
       0000000000000010  0000000000000010	   26	  3	8
  [ 5] kretprobe/kmem_ca PROGBITS	  0000000000000000  00000088
       00000000000000c0  0000000000000000  AX	    0	  0	8
  [ 6] .relkretprobe/kme REL		  0000000000000000  00001880
       0000000000000010  0000000000000010	   26	  5	8
  [ 7] maps		 PROGBITS	  0000000000000000  00000148
       000000000000001c  0000000000000000  WA	    0	  0	4
  [ 8] license		 PROGBITS	  0000000000000000  00000164
       0000000000000004  0000000000000000  WA	    0	  0	1
  [ 9] version		 PROGBITS	  0000000000000000  00000168
       0000000000000004  0000000000000000  WA	    0	  0	4
  [10] .debug_str	 PROGBITS	  0000000000000000  0000016c
       00000000000001e9  0000000000000001  MS	    0	  0	1
  [11] .debug_loc	 PROGBITS	  0000000000000000  00000355
       0000000000000150  0000000000000000	    0	  0	1
  [12] .rel.debug_loc	 REL		  0000000000000000  00001890
       0000000000000050  0000000000000010	   26	 11	8
  [13] .debug_abbrev	 PROGBITS	  0000000000000000  000004a5
       0000000000000101  0000000000000000	    0	  0	1
  [14] .debug_info	 PROGBITS	  0000000000000000  000005a6
       0000000000000376  0000000000000000	    0	  0	1
  [15] .rel.debug_info	 REL		  0000000000000000  000018e0
       00000000000004b0  0000000000000010	   26	 14	8
  [16] .debug_ranges	 PROGBITS	  0000000000000000  0000091c
       0000000000000030  0000000000000000	    0	  0	1
  [17] .rel.debug_ranges REL		  0000000000000000  00001d90
       0000000000000040  0000000000000010	   26	 16	8
  [18] .BTF		 PROGBITS	  0000000000000000  0000094c
       0000000000000569  0000000000000000	    0	  0	1
  [19] .rel.BTF 	 REL		  0000000000000000  00001dd0
       0000000000000030  0000000000000010	   26	 18	8
  [20] .BTF.ext 	 PROGBITS	  0000000000000000  00000eb5
       0000000000000178  0000000000000000	    0	  0	1
  [21] .rel.BTF.ext	 REL		  0000000000000000  00001e00
       0000000000000140  0000000000000010	   26	 20	8
  [22] .eh_frame	 PROGBITS	  0000000000000000  00001030
       0000000000000050  0000000000000000   A	    0	  0	8
  [23] .rel.eh_frame	 REL		  0000000000000000  00001f40
       0000000000000020  0000000000000010	   26	 22	8
  [24] .debug_line	 PROGBITS	  0000000000000000  00001080
       0000000000000147  0000000000000000	    0	  0	1
  [25] .rel.debug_line	 REL		  0000000000000000  00001f60
       0000000000000020  0000000000000010	   26	 24	8
  [26] .symtab		 SYMTAB 	  0000000000000000  000011c8
       00000000000006a8  0000000000000018	    1	 66	8
The third column represents the Type:
- ”NULL ": not used, such as the first empty segment of the segment table
- "PROGBITS": program data, such as text,. data,. rodata;
- Table "relocating", such as. REL rel.text;
- "NOBITS": program space without data temporarily, such as bss;
- "strtab": string table, such as strtab,. shstrtab;
- "symtab": symbol table, such as symtab, including all relevant symbolic information used, such as function name and variable name.
3.3 # parsing BPF ELF format files through llvm objdump
wu@ubuntu:~/linux/samples/bpf$ llvm-objdump -h tracex4_kern.o
tracex4_kern.o: file format ELF64-BPF
Sections:
Idx Name				Size	 VMA		  Type
  0					00000000 0000000000000000
  1 .strtab				00000115 0000000000000000
  2 .text				00000000 0000000000000000 TEXT
  3 kprobe/kmem_cache_free		00000048 0000000000000000 TEXT
  4 .relkprobe/kmem_cache_free		00000010 0000000000000000
  5 kretprobe/kmem_cache_alloc_node	000000c0 0000000000000000 TEXT
  6 .relkretprobe/kmem_cache_alloc_node 00000010 0000000000000000
  7 maps				0000001c 0000000000000000 DATA
  8 license				00000004 0000000000000000 DATA
  9 version				00000004 0000000000000000 DATA
... ...
You can use the llvm tool to decompile the eBPF program, tracex4_kern.o # is a file in ELF format, which is divided into two code segments, as follows:
wu@ubuntu:~/linux/samples/bpf$ llvm-objdump -d -r -print-imm-hex tracex4_kern.o
tracex4_kern.o: file format ELF64-BPF
Disassembly of section kprobe/kmem_cache_free:
0000000000000000 bpf_prog1:
       0:	79 11 68 00 00 00 00 00 r1 = *(u64 *)(r1 + 0x68)
       1:	7b 1a f8 ff 00 00 00 00 *(u64 *)(r10 - 0x8) = r1
       2:	bf a2 00 00 00 00 00 00 r2 = r10
       3:	07 02 00 00 f8 ff ff ff r2 += -0x8
       4:	18 01 00 00 00 00 00 00 00 00 00 00 00 00 00 00 r1 = 0x0 ll
		0000000000000020:  R_BPF_64_64	my_map
       6:	85 00 00 00 03 00 00 00 call 0x3
       7:	b7 00 00 00 00 00 00 00 r0 = 0x0
       8:	95 00 00 00 00 00 00 00 exit
Disassembly of section kretprobe/kmem_cache_alloc_node:
0000000000000000 bpf_prog2:
       0:	79 12 50 00 00 00 00 00 r2 = *(u64 *)(r1 + 0x50)
       1:	7b 2a f8 ff 00 00 00 00 *(u64 *)(r10 - 0x8) = r2
       2:	b7 02 00 00 00 00 00 00 r2 = 0x0
       3:	7b 2a f0 ff 00 00 00 00 *(u64 *)(r10 - 0x10) = r2
       4:	79 13 20 00 00 00 00 00 r3 = *(u64 *)(r1 + 0x20)
       5:	07 03 00 00 08 00 00 00 r3 += 0x8
       6:	bf a1 00 00 00 00 00 00 r1 = r10
       7:	07 01 00 00 f0 ff ff ff r1 += -0x10
       8:	b7 02 00 00 08 00 00 00 r2 = 0x8
       9:	85 00 00 00 04 00 00 00 call 0x4
      10:	85 00 00 00 05 00 00 00 call 0x5
      11:	7b 0a e0 ff 00 00 00 00 *(u64 *)(r10 - 0x20) = r0
      12:	79 a1 f0 ff 00 00 00 00 r1 = *(u64 *)(r10 - 0x10)
      13:	7b 1a e8 ff 00 00 00 00 *(u64 *)(r10 - 0x18) = r1
      14:	bf a2 00 00 00 00 00 00 r2 = r10
      15:	07 02 00 00 f8 ff ff ff r2 += -0x8
      16:	bf a3 00 00 00 00 00 00 r3 = r10
      17:	07 03 00 00 e0 ff ff ff r3 += -0x20
      18:	18 01 00 00 00 00 00 00 00 00 00 00 00 00 00 00 r1 = 0x0 ll
		0000000000000090:  R_BPF_64_64	my_map
      20:	b7 04 00 00 00 00 00 00 r4 = 0x0
      21:	85 00 00 00 02 00 00 00 call 0x2
      22:	b7 00 00 00 00 00 00 00 r0 = 0x0
      23:	95 00 00 00 00 00 00 00 exit
	     ........
Next, check the contents of other segments, such as maps and license:
wu@ubuntu:~/linux/samples/bpf$ llvm-objdump --section=maps  -s tracex4_kern.o
tracex4_kern.o: file format ELF64-BPF
Contents of section maps:
 0000 01000000 08000000 10000000 40420f00  ............@B..
 0010 00000000 00000000 00000000	   ............
wu@ubuntu:~/linux/samples/bpf$ llvm-objdump --section=license  -s tracex4_kern.o
tracex4_kern.o: file format ELF64-BPF
Contents of section license:
 0000 47504c00				   GPL.
The bytecode of the above bpf program cannot be used in x86_ It is directly executed on 64 platform. When loading bpf program, JIT(just in time) compiler needs to be used to translate bpf bytecode into sink code recognized by the host. However, for most opcodes, eBPF instruction set can be mapped with X86 or aarch64 instruction set one by one.
bpf program has customized a set of instructions, which are different from x86, ARM64 and so on. Moreover, the instruction set is not as rich as the two, and there is no floating-point calculation. However, the functions of registers are similar, as follows:
| eBPF register | describe |
|---|---|
| R1-R5 | Parameters passed into kernel function by eBPF program |
| R0 | Return value of kernel function ebpf program exit value |
| R6-R9 | It is used as data storage and follows the usage rules of the callee |
| R10 | Stack frame |
4. Trace and analyze eBPF program behavior through strace tool
Execute the following command to see the assigned address and time of the slab object:
wu@ubuntu:~/linux/samples/bpf$ sudo strace -v -f -s 128 -o tracex4.txt ./tracex4
obj 0xffff9637e3175cc0 is  1sec old was allocated at ip ffffffff99679a9a
obj 0xffff9637e31750c0 is  1sec old was allocated at ip ffffffff99679a9a
obj 0xffff9637e3175e00 is  1sec old was allocated at ip ffffffff99679a9a
obj 0xffff9637e3175780 is  1sec old was allocated at ip ffffffff99679a9a
... ...
The key system calls traced by strace are as follows:
execve("./tracex4", ["./tracex4"], ["LANG=en_US.UTF-8", "LS_COLORS=rs=0:di=01;34:ln=01;36:mh=00:pi=40;33:so=01;35:do=01;35:bd=40;33;01:cd=40;33;01:or=40;31;01:mi=00:su=37;41:sg=30;43:ca"..., "TERM=xterm", "DISPLAY=localhost:12.0", "PATH=/usr/local/sbin:/usr/local/bin:/usr/sbin:/usr/bin:/sbin:/bin:/snap/bin", "MAIL=/var/mail/root", "LOGNAME=root", "USER=root", "HOME=/root", "SHELL=/bin/bash", "SUDO_COMMAND=/usr/bin/strace -v -f -s 128 -o tracex4.txt ./tracex4", "SUDO_USER=wu", "SUDO_UID=1000", "SUDO_GID=1000"]) = 0
... ...
bpf(BPF_MAP_CREATE, {map_type=BPF_MAP_TYPE_HASH, key_size=8, value_size=16, max_entries=1000000, map_flags=0, inner_map_fd=0, map_name="my_map", map_ifindex=0, btf_fd=0, btf_key_type_id=0, btf_value_type_id=0}, 112) = 4
bpf(BPF_PROG_LOAD, {prog_type=BPF_PROG_TYPE_KPROBE, insn_cnt=9, insns=[{code=BPF_LDX|BPF_DW|BPF_MEM, dst_reg=BPF_REG_1, src_reg=BPF_REG_1, off=104, imm=0}, {code=BPF_STX|BPF_DW|BPF_MEM, dst_reg=BPF_REG_10, src_reg=BPF_REG_1, off=-8, imm=0}, {code=BPF_ALU64|BPF_X|BPF_MOV, dst_reg=BPF_REG_2, src_reg=BPF_REG_10, off=0, imm=0}, {code=BPF_ALU64|BPF_K|BPF_ADD, dst_reg=BPF_REG_2, src_reg=BPF_REG_0, off=0, imm=0xfffffff8}, {code=BPF_LD|BPF_DW|BPF_IMM, dst_reg=BPF_REG_1, src_reg=BPF_REG_1, off=0, imm=0x4}, {code=BPF_LD|BPF_W|BPF_IMM, dst_reg=BPF_REG_0, src_reg=BPF_REG_0, off=0, imm=0}, {code=BPF_JMP|BPF_K|BPF_CALL, dst_reg=BPF_REG_0, src_reg=BPF_REG_0, off=0, imm=0x3}, {code=BPF_ALU64|BPF_K|BPF_MOV, dst_reg=BPF_REG_0, src_reg=BPF_REG_0, off=0, imm=0}, {code=BPF_JMP|BPF_K|BPF_EXIT, dst_reg=BPF_REG_0, src_reg=BPF_REG_0, off=0, imm=0}], license="GPL", log_level=0, log_size=0, log_buf=NULL, kern_version=KERNEL_VERSION(5, 4, 0), prog_flags=0, prog_name="", prog_ifindex=0, expected_attach_type=BPF_CGROUP_INET_INGRESS, prog_btf_fd=0, func_info_rec_size=0, func_info=NULL, func_info_cnt=0, line_info_rec_size=0, line_info=NULL, line_info_cnt=0, attach_btf_id=0}, 112) = 5
openat(AT_FDCWD, "/sys/kernel/debug/tracing/kprobe_events", O_WRONLY|O_APPEND) = 6
write(6, "p:kmem_cache_free kmem_cache_free", 33) = 33
close(6)
openat(AT_FDCWD, "/sys/kernel/debug/tracing/events/kprobes/kmem_cache_free/id", O_RDONLY) = 6
read(6, "2145\n", 256)		 = 5
close(6)
perf_event_open({type=PERF_TYPE_TRACEPOINT, size=0 /* PERF_ATTR_SIZE_??? */, config=2145, sample_period=1, sample_type=PERF_SAMPLE_RAW, read_format=0, disabled=0, inherit=0, pinned=0, exclusive=0, exclusive_user=0, exclude_kernel=0, exclude_hv=0, exclude_idle=0, mmap=0, comm=0, freq=0, inherit_stat=0, enable_on_exec=0, task=0, watermark=0, precise_ip=0 /* arbitrary skid */, mmap_data=0, sample_id_all=0, exclude_host=0, exclude_guest=0, exclude_callchain_kernel=0, exclude_callchain_user=0, mmap2=0, comm_exec=0, use_clockid=0, context_switch=0, write_backward=0, namespaces=0, wakeup_events=1, config1=0}, -1, 0, -1, 0) = 6
... ...
openat(AT_FDCWD, "/sys/kernel/debug/tracing/kprobe_events", O_WRONLY|O_APPEND) = 8
write(8, "r:kmem_cache_alloc_node kmem_cache_alloc_node", 45) = 45
openat(AT_FDCWD, "/sys/kernel/debug/tracing/events/kprobes/kmem_cache_alloc_node/id", O_RDONLY) = 8
read(8, "2146\n", 256)		 = 5
close(8)			 = 0
perf_event_open({type=PERF_TYPE_TRACEPOINT, size=0 /* PERF_ATTR_SIZE_??? */, config=2146, sample_period=1, sample_type=PERF_SAMPLE_RAW, read_format=0, disabled=0, inherit=0, pinned=0, exclusive=0, exclusive_user=0, exclude_kernel=0, exclude_hv=0, exclude_idle=0, mmap=0, comm=0, freq=0, inherit_stat=0, enable_on_exec=0, task=0, watermark=0, precise_ip=0 /* arbitrary skid */, mmap_data=0, sample_id_all=0, exclude_host=0, exclude_guest=0, exclude_callchain_kernel=0, exclude_callchain_user=0, mmap2=0, comm_exec=0, use_clockid=0, context_switch=0, write_backward=0, namespaces=0, wakeup_events=1, config1=0}, -1, 0, -1, 0) = 8
ioctl(8, PERF_EVENT_IOC_ENABLE, 0) = 0
ioctl(8, PERF_EVENT_IOC_SET_BPF, 7) = 0
write(1, "\33[1;1H\33[2J\0\0", 12) = 12
bpf(BPF_MAP_GET_NEXT_KEY, {map_fd=4, key=0x7ffffaf162b0, next_key=0x7ffffaf162b8}, 112) = 0
bpf(BPF_MAP_LOOKUP_ELEM, {map_fd=4, key=0x7ffffaf162b8, value=0x7ffffaf162d0, flags=BPF_ANY}, 112) = 0
... ...
4.1} BPF bytecode loading analysis
When the first parameter of BPF system is CMDS = BPF_ PROG_ When loading , it means loading the file in , ELF64-BPF , format. Carefully analyze the second parameter , attr. The prototype of this structure is as follows. It is found that the BPF bytecode is saved:
struct {    /* Used by BPF_PROG_LOAD */
	__u32	      prog_type;
	__u32	      insn_cnt;
	__aligned_u64 insns;	  /* 'const struct bpf_insn *' */
	__aligned_u64 license;	  /* 'const char *' */
	__u32	      log_level;  /* verbosity level of verifier */
	__u32	      log_size;   /* size of user buffer */
	__aligned_u64 log_buf;	  /* user supplied 'char *'
buffer */
	__u32	      kern_version;
				/* checked when prog_type=kprobe
(since Linux 4.1) */
};
 __attribute__((aligned(8)));
When the bpf program is loaded, BPF_PROG_LOAD ^ represents the specific bpf instruction of the program, corresponding to ^ bpf_prog1} This code snippet.
The instructions traced by strace are as follows. The opcode of each instruction consists of six parts:
- Code (operation code)
- dst_ Reg (destination register)
- src_ Reg (source register)
- Off (offset)
- IMM (immediate)
See:
insns=[
{code=BPF_LDX|BPF_DW|BPF_MEM, dst_reg=BPF_REG_1, src_reg=BPF_REG_1, off=104, imm=0},
{code=BPF_STX|BPF_DW|BPF_MEM, dst_reg=BPF_REG_10, src_reg=BPF_REG_1, off=-8, imm=0},
{code=BPF_ALU64|BPF_X|BPF_MOV, dst_reg=BPF_REG_2, src_reg=BPF_REG_10, off=0, imm=0},
{code=BPF_ALU64|BPF_K|BPF_ADD, dst_reg=BPF_REG_2, src_reg=BPF_REG_0, off=0, imm=0xfffffff8},
{code=BPF_LD|BPF_DW|BPF_IMM, dst_reg=BPF_REG_1, src_reg=BPF_REG_1, off=0, imm=0x4},
{code=BPF_LD|BPF_W|BPF_IMM, dst_reg=BPF_REG_0, src_reg=BPF_REG_0, off=0, imm=0},
{code=BPF_JMP|BPF_K|BPF_CALL, dst_reg=BPF_REG_0, src_reg=BPF_REG_0, off=0, imm=0x3},
{code=BPF_ALU64|BPF_K|BPF_MOV, dst_reg=BPF_REG_0, src_reg=BPF_REG_0, off=0, imm=0},
{code=BPF_JMP|BPF_K|BPF_EXIT, dst_reg=BPF_REG_0, src_reg=BPF_REG_0, off=0, imm=0}
]
The instruction format is shown in the figure below. BPF currently has 102 instructions, mainly including three categories:
- ALU (64bit and 32bit)
- Memory operation
- Branch operation
The format of instruction is mainly composed of the following parts:
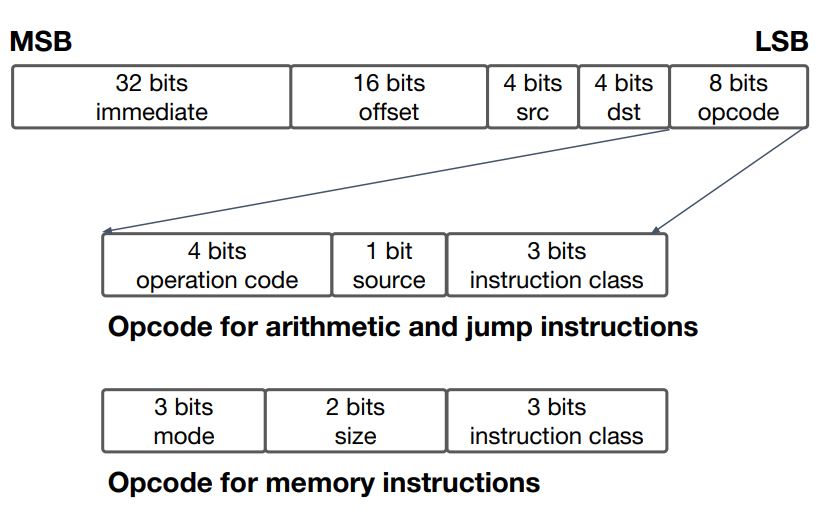
The lower 3 bits of opcode indicate the instruction type, BPF_LDX,BPF_REG_10. Wait for these macros in the kernel directory, \ tools / include / UAPI / Linux / BPF Definition in H:
#define 	BPF_LDX 	0x01
#define 	BPF_MEM 	0x60
#define 	BPF_DW		0x18
... ...
Take the first bpf instruction as an example:
{code=BPF_LDX|BPF_DW|BPF_MEM, dst_reg=BPF_REG_1, src_reg=BPF_REG_1, off=104, imm=0}It exactly corresponds to the first instruction parsed by llvm objdump, which is a memory access instruction:
0:       79 11 68 00 00 00 00 00 r1 = *(u64 *)(r1 + 0x68)
BPF_LDX|BPF_MEM|BPF_DW=0x79
This instruction is defined in the kernel as:
/* Memory load, dst_reg = *(uint *) (src_reg + off16) */
#define BPF_LDX_MEM(SIZE, DST, SRC, OFF)			\
	((struct bpf_insn) {					\
		.code  = BPF_LDX | BPF_SIZE(SIZE) | BPF_MEM,	\
		.dst_reg = DST, 				\
		.src_reg = SRC, 				\
		.off   = OFF,					\
		.imm   = 0 })
4.2} MAP data communication analysis
When the first parameter of bpf system is CMDS = bpf_ MAP_ When creating , it means creating a data map. Carefully analyze the second parameter , attr. The prototype of this structure includes map type, key size, value e size, etc
union bpf_attr {
struct {    /* Used by BPF_MAP_CREATE */
	__u32	      map_type;
	__u32	      key_size;    /* size of key in bytes */
	__u32	      value_size;  /* size of value in bytes */
	__u32	      max_entries; /* maximum number of entries
in a map */
};
According to the log analysis captured by strace, the type of map is BPF_MAP_TYPE_HASH, the size of key is 8, the size of value is 16, and the access map is bpf_prog1 # the 5th bytecode, in which the imm immediate number is 4, representing map_fd, this is a pseudo instruction, which is a relocatable instruction:
bpf(BPF_MAP_CREATE, {map_type=BPF_MAP_TYPE_HASH, key_size=8, value_size=16, max_entries=1000000, map_flags=0, inner_map_fd=0, map_name="my_map", map_ifindex=0, btf_fd=0, btf_key_type_id=0, btf_value_type_id=0}, 112) = 4
 0000000000000020:  R_BPF_64_64  my_map
{code=BPF_LD|BPF_DW|BPF_IMM, dst_reg=BPF_REG_1, src_reg=BPF_REG_1, off=0, imm=0x4}
bpf programs can use bpf to access all types of maps_ map_ lookup_ Elem () and bpf_ map_ update_ The elem() function, socket maps, and some other extra maps are used for special purposes.
When the first parameter of bpf system is cmds=BPF_MAP_GET_NEXT_KEY or BPF_MAP_LOOKUP_ELEM , means traversing the map. Carefully analyze the second parameter , attr. The prototype of this structure contains the map_fd is the first parameter of bpf system call. cmd=BPF_MAP_CREATE return value, key value, value value, etc.:
struct {    /* Used by BPF_MAP_*_ELEM and BPF_MAP_GET_NEXT_KEY
commands */
	__u32	      map_fd;
	__aligned_u64 key;
	union {
	__aligned_u64 value;
	__aligned_u64 next_key;
	};
	__u64	      flags;
};
bpf(BPF_MAP_GET_NEXT_KEY, {map_fd=4, key=0x7ffffaf162b0, next_key=0x7ffffaf162b8}, 112) = 0
bpf(BPF_MAP_LOOKUP_ELEM, {map_fd=4, key=0x7ffffaf162b8, value=0x7ffffaf162d0, flags=BPF_ANY}, 112) = 0
5. Introduction to bpftool usage
Bpftool can be used by compiling it with make under the directory of # tools/bpf/bpftool / in the kernel. Check the currently running bpf program, as shown below. You can see that the currently running bpf program is # kprobe event # and # map id:
wu@ubuntu:~/linux/samples/bpf$ sudo bpftool prog show
[sudo] password for wu:
... ...
205: kprobe  tag a6cfc4a29f52a193  gpl
	loaded_at 2021-01-19T11:51:26+0000  uid 0
	xlated 72B  jited 62B  memlock 4096B  map_ids 72
206: kprobe  tag d16c41919f3b767a  gpl
	loaded_at 2021-01-19T11:51:26+0000  uid 0
	xlated 192B  jited 119B  memlock 4096B	map_ids 72
By checking the id of the map, you can see that the hash map is currently used:
wu@ubuntu:~/linux$ sudo bpftool map show
72: hash  name my_map  flags 0x0
	key 8B	value 16B  max_entries 1000000	memlock 88788992B
View all the contents of the map and the value of the corresponding key:
wu@ubuntu:~/linux$ sudo bpftool map dump id 72
key: 80 35 43 e5 26 95 ff ff  value: b9 f3 f3 9e 87 6b 00 00  9a 9a c7 86 ff ff ff ff
key: 80 9c 5f f6 25 95 ff ff  value: 98 85 ac c7 8c 6b 00 00  9a 9a c7 86 ff ff ff ff
key: 00 4c 9b e4 25 95 ff ff  value: e6 8d c2 b7 7e 6b 00 00  9a 9a c7 86 ff ff ff ff
key: 80 21 15 f8 26 95 ff ff  value: 60 df 01 fc 5c 6b 00 00  9a 9a c7 86 ff ff ff ff
key: 80 f5 46 5f 26 95 ff ff  value: 5e e1 73 7b 8d 6b 00 00  9a 9a c7 86 ff ff ff ff
... ...
wu@ubuntu:~/linux$ sudo bpftool map lookup id 72 key 0x80 0x35 0x43 0xe5 0x26 0x95 0xff 0xff
key: 80 35 43 e5 26 95 ff ff  value: b9 f3 f3 9e 87 6b 00 00  9a 9a c7 86 ff ff ff ff
6. References
- <BPF In Depth: The BPF Bytecode and the BPF Verifier>
- https://www.kernel.org/doc/Documentation/networking/filter.txt
Related reading
- <Detailed explanation of iptables (1): iptables concept>
- <iptables (2): routing table>
- <eBPF.io eBPF document: extended packet filter (BPF)>
- <Introduce Calico eBPF data plane: Linux kernel network, security and tracing (Kubernetes, Kube proxy)>
- <Linux eBPF and XDP high-speed processing of data packets; Write XDP network filter using EBPF; High performance ACL>
- <Deeply understand Cilium's eBPF packet sending and receiving path>
- <Understanding (and Troubleshooting) the eBPF Datapath in Cilium>
- <kubernetes (K8s): manage containerized applications on multiple hosts in the cloud platform>