1. Review
Log is the most commonly used and effective tool to understand the internal operation of an application. Logs are generally divided into debugging, information, warning, error and other different levels. Usually, the production environment only turns on the warning level log, which generally does not cause I/O problems. However, when troubleshooting problems occasionally, we may need to open the debugging log. After debugging, you may forget to adjust the log level back. At this time, a large number of debugging logs may cause I/O performance problems. You can use iostat to confirm whether there is an I/O performance bottleneck. Then use strace and lsof to locate the application and the log file path it is writing to. Finally, the log level is adjusted through the application interface to perfectly solve the I/O problem. However, if the application does not have the function of dynamically adjusting the log level, you also need to modify the application configuration and restart the application to make the configuration take effect.
Today, let's look at a new case. This case is a Web application based on Python Flask framework. It provides an API for querying word popularity, but the response speed of the API is not satisfactory.
2. Cases
- Ubuntu 18.04
- Machine configuration: 2 CPU, 8GB memory
- Pre install docker, sysstat and other tools, such as apt install docker io sysstat
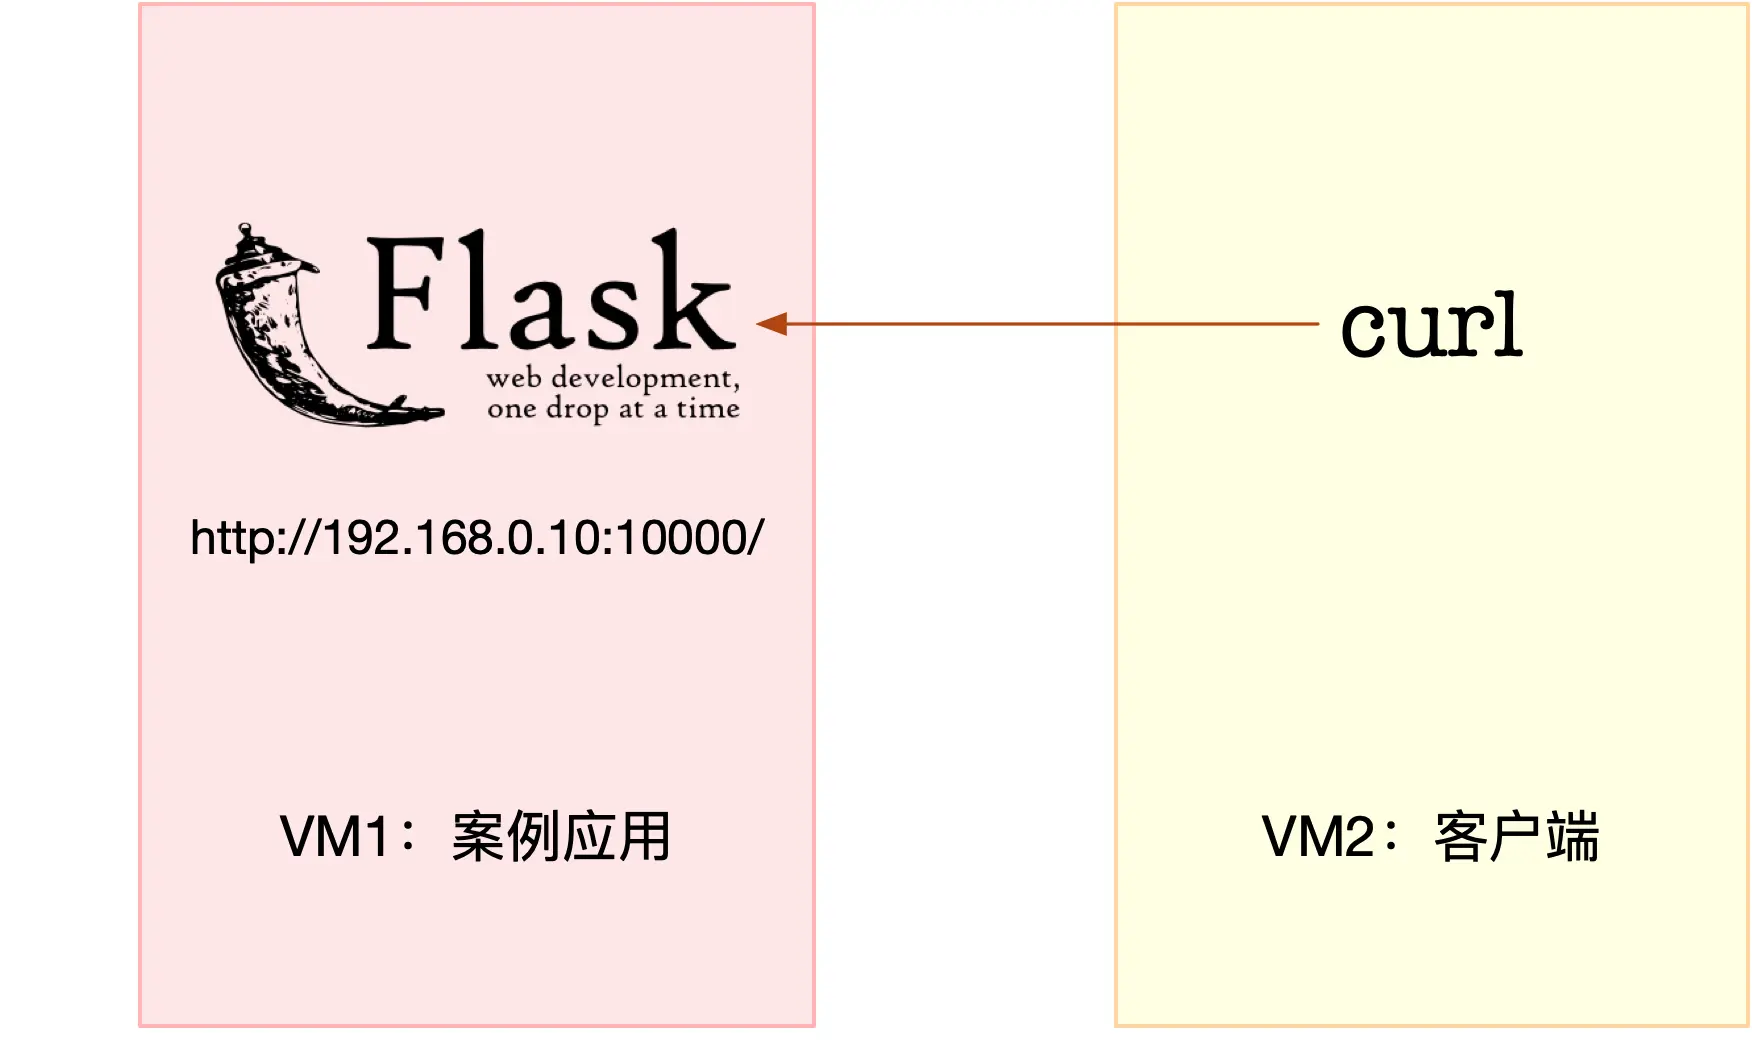
Today's case requires two virtual machines, one of which is the target machine of the case analysis. It runs the flash application, and its IP address is 192.168.0.10; The other one, as the client, requests the heat of the word. I drew a diagram to show their relationship, as follows:
$ docker run --name=app -p 10000:80 -itd feisky/word-pop
Then, run the curl command in the second terminal to access http://192.168.0.10:1000/ , confirm that the case starts normally. You should be able to see a hello world output in the curl output interface:
$ curl http://192.168.0.10:10000/
hello world
Next, in the second terminal, access the word heat interface of the case application, that is http://192.168.0.10:1000/popularity/word .
$ curl http://192.168.0.10:1000/popularity/word
After a while, you will find that this interface has not responded for such a long time. What's the matter? Let's go back to the terminal and analyze it. Let's try to execute a command casually in the first terminal, such as df command, and check the usage of the file system. It's strange that such a simple command has to wait for a long time to output.
$ df
Filesystem     1K-blocks    Used Available Use% Mounted on
udev             4073376       0   4073376   0% /dev
tmpfs             816932    1188    815744   1% /run
/dev/sda1       30308240 8713640  21578216  29% /
Through df, we know that the system still has enough disk space. So why is the response slow? It seems that we still have to observe the resource usage of the system, such as the specific usage of CPU, memory and disk I/O. In fact, the idea here is similar to that of the previous case. We can first use top to observe the CPU and memory usage, and then use iostat to observe the disk I/O. In order to avoid the sudden end of curl request during analysis, we return to terminal 2 and press Ctrl+C to stop the application just now; Then, put the curl command into a loop to execute; This time, we will add a time command to observe the execution time of each time:
$ while true; do time curl http://192.168.0.10:10000/popularity/word; sleep 1; done
Continue back to the terminal to analyze the performance. We run the top command in terminal 1 to observe the CPU and memory usage:
$ top
top - 14:27:02 up 10:30,  1 user,  load average: 1.82, 1.26, 0.76
Tasks: 129 total,   1 running,  74 sleeping,   0 stopped,   0 zombie
%Cpu0  :  3.5 us,  2.1 sy,  0.0 ni,  0.0 id, 94.4 wa,  0.0 hi,  0.0 si,  0.0 st
%Cpu1  :  2.4 us,  0.7 sy,  0.0 ni, 70.4 id, 26.5 wa,  0.0 hi,  0.0 si,  0.0 st
KiB Mem :  8169300 total,  3323248 free,   436748 used,  4409304 buff/cache
KiB Swap:        0 total,        0 free,        0 used.  7412556 avail Mem

  PID USER      PR  NI    VIRT    RES    SHR S  %CPU %MEM     TIME+ COMMAND
12280 root      20   0  103304  28824   7276 S  14.0  0.4   0:08.77 python
   16 root      20   0       0      0      0 S   0.3  0.0   0:09.22 ksoftirqd/1
1549 root      20   0  236712  24480   9864 S   0.3  0.3   3:31.38 python3
Looking at the output of top, we can find that the iowait of both CPUs is very high. In particular, CPU0 and iowait have reached 94%, and there are 3GB of remaining memory, which seems to be sufficient. Looking down, there is a python process in the process part. The CPU utilization rate is a little high, up to 14%. Although 14% is not a performance bottleneck, it is a bit suspicious -- it may be related to the increase of iowait. Is this Python process with PID number 12280 our case application? In the first terminal, press Ctrl+C to stop the top command; Then execute the following ps command to find the case application app PID number of Py:
$ ps aux | grep app.py
root     12222  0.4  0.2  96064 23452 pts/0    Ss+  14:37   0:00 python /app.py
root     12280 13.9  0.3 102424 27904 pts/0    Sl+  14:37   0:09 /usr/local/bin/python /app.py
From the output of ps, you can see that this process with high CPU utilization is our case application. However, don't worry about analyzing the CPU problem. After all, iowait has reached 94%, and the I/O problem is our primary solution. Next, in terminal 1, run the following iostat command, where:
- -d option is to display the performance index of I/O;
- -The x option means that extended statistics are displayed (that is, all I/O metrics are displayed).
$ iostat -d -x 1
Device            r/s     w/s     rkB/s     wkB/s   rrqm/s   wrqm/s  %rrqm  %wrqm r_await w_await aqu-sz rareq-sz wareq-sz  svctm  %util
loop0            0.00    0.00      0.00      0.00     0.00     0.00   0.00   0.00    0.00    0.00   0.00     0.00     0.00   0.00   0.00
sda              0.00   71.00      0.00  32912.00     0.00     0.00   0.00   0.00    0.00 18118.31 241.89     0.00   463.55  13.86  98.40
After you understand the meaning of the indicator, you can observe the output of iostat. You can find that the I/O utilization of disk sda has reached 98%, which is close to saturation. Moreover, the response time of write request is up to 18 seconds, and the write data per second is 32 MB. Obviously, the write disk has encountered a bottleneck. How do you know which processes cause these I/O requests? I think you still remember the pidstat we used in the last section. In terminal 1, run the following pidstat command to observe the I/O status of the process:
$ pidstat -d 1
14:39:14      UID       PID   kB_rd/s   kB_wr/s kB_ccwr/s iodelay  Command
14:39:15        0     12280      0.00 335716.00      0.00       0  python
From the output of pidstat, we see the result with PID number 12280 again. This shows that it is the case application that causes the performance bottleneck of I/O.
$ strace -p 12280
strace: Process 12280 attached
select(0, NULL, NULL, NULL, {tv_sec=0, tv_usec=567708}) = 0 (Timeout)
stat("/usr/local/lib/python3.7/importlib/_bootstrap.py", {st_mode=S_IFREG|0644, st_size=39278, ...}) = 0
stat("/usr/local/lib/python3.7/importlib/_bootstrap.py", {st_mode=S_IFREG|0644, st_size=39278, ...}) = 0
From strace, you can see a large number of stat system calls, most of which are python files. However, please note that there are no write system calls here. Since there are many outputs from strace, we can use grep to filter write, for example:
$ strace -p 12280 2>&1 | grep write
Unfortunately, there is still no output here. Is there no performance problem at this time? Re execute the top and iostat commands just now, and you will unfortunately find that the performance problem still exists.
We have to combine strace, pidstat and iostat to analyze. Obviously, you should find the contradiction here: iostat has proved that disk I/O has a performance bottleneck, and pidstat has also proved that this bottleneck is caused by process 12280, but strace tracks this process but does not find any write system calls.
That's strange. Can't you find it because the programming language used in the case is Python and Python is interpretive? Or is it because the case runs in Docker? Leave a suspense here. Think for yourself. When writing a file, there should be a corresponding write system call, but no trace can be found with existing tools. At this time, it's time to think about changing tools. How can I know where to write the file?
Here I'll introduce you to a new tool, filetop . It is a part of bcc software package. Based on the eBPF (extended Berkeley Packet Filters) mechanism of Linux kernel, it mainly tracks the reading and writing of files in the kernel, and outputs thread ID (TID), reading and writing size, reading and writing type and file name. You don't need to delve into the working principle of eBPF for the time being. We will gradually come into contact with the following contents. We can use it first. As for the installation method of old friend bcc, you can refer to its Github website https://github.com/iovisor/bcc . For example, in Ubuntu 16 or above, you can run the following command to install it:
sudo apt-key adv --keyserver keyserver.ubuntu.com --recv-keys 4052245BD4284CDD
echo "deb https://repo.iovisor.org/apt/$(lsb_release -cs) $(lsb_release -cs) main" | sudo tee /etc/apt/sources.list.d/iovisor.list
sudo apt-get update
sudo apt-get install bcc-tools libbcc-examples linux-headers-$(uname -r)
All the tools provided by bcc are installed in the directory / usr/share/bcc/tools. Next, let's use this tool to observe the reading and writing of files. First, run the following command in terminal 1:
# Switch to tool catalog
$ cd /usr/share/bcc/tools

# -The C option means that the screen is not cleared when new content is output
$ ./filetop -C

TID    COMM             READS  WRITES R_Kb    W_Kb    T FILE
514    python           0      1      0       2832    R 669.txt
514    python           0      1      0       2490    R 667.txt
514    python           0      1      0       2685    R 671.txt
514    python           0      1      0       2392    R 670.txt
514    python           0      1      0       2050    R 672.txt

...

TID    COMM             READS  WRITES R_Kb    W_Kb    T FILE
514    python           2      0      5957    0       R 651.txt
514    python           2      0      5371    0       R 112.txt
514    python           2      0      4785    0       R 861.txt
514    python           2      0      4736    0       R 213.txt
514    python           2      0      4443    0       R 45.txt
You will see that filetop outputs 8 columns, including thread ID, thread command line, read / write times, read / write size (in KB), file type and read / write file name.
In these contents, you may see a lot of dynamic link libraries, but this is not our focus. Just ignore it for the time being. Our focus is on a python application, so we should pay special attention to Python related content. After observing for a while, you will find that every once in a while, python applications with thread number 514 will first write a large number of txt files and then read a large number of txt files.
Which process does the thread with thread number 514 belong to? We can use the ps command to view. First, in terminal 1, press Ctrl+C to stop filetop; Then, run the following ps command. The second column of this output is the process number we want to know:
$ ps -efT | grep 514
root     12280  514 14626 33 14:47 pts/0    00:00:05 /usr/local/bin/python /app.py
This thread is the thread of the case application 12280. Finally, I can breathe a sigh of relief, but it's not over yet. filetop only gives the file name, but there is no file path. I have to keep looking. Let me introduce another easy-to-use tool, opensnoop. It belongs to bcc software package, which can dynamically track the open system call in the kernel. In this way, we can find the path of these txt files. Next, in terminal 1, run the following opensnoop command:
$ opensnoop
12280  python              6   0 /tmp/9046db9e-fe25-11e8-b13f-0242ac110002/650.txt
12280  python              6   0 /tmp/9046db9e-fe25-11e8-b13f-0242ac110002/651.txt
12280  python              6   0 /tmp/9046db9e-fe25-11e8-b13f-0242ac110002/652.txt
This time, through the output of opensnoop, you can see that these txt paths are located in the / tmp directory. You can also see that the number of files it opens, numbered from 0 txt increases to 999 txt, which can be much more than the number seen earlier with filetop.
Combining filetop and opensnoop, we can further analyze. We can boldly guess that the case application reads these contents into memory for processing after writing 1000 txt files. Let's check whether there are really 1000 files in this directory:
$ ls /tmp/9046db9e-fe25-11e8-b13f-0242ac110002 | wc -l
ls: cannot access '/tmp/9046db9e-fe25-11e8-b13f-0242ac110002': No such file or directory
0
After the operation, I found that the directory did not exist. What's going on? Let's go back to opensnoop and observe for a while:
$ opensnoop
12280  python              6   0 /tmp/defee970-fe25-11e8-b13f-0242ac110002/261.txt
12280  python              6   0 /tmp/defee970-fe25-11e8-b13f-0242ac110002/840.txt
12280  python              6   0 /tmp/defee970-fe25-11e8-b13f-0242ac110002/136.txt
Originally, the path at this time has become another directory. This shows that these directories are dynamically generated by the application and deleted when they are used up. Combined with all the previous analysis, we can basically judge that the case application will dynamically generate a batch of files for temporary storage of data, and they will be deleted when used up. Unfortunately, it is the reading and writing of these files that cause the performance bottleneck of I/O and the whole processing process is very slow.
Of course, we also need to test this conjecture. The old way is to check the source code of the application app.py,
@app.route("/popularity/<word>")
def word_popularity(word):
  dir_path = '/tmp/{}'.format(uuid.uuid1())
  count = 0
  sample_size = 1000

  def save_to_file(file_name, content):
    with open(file_name, 'w') as f:
    f.write(content)

  try:
    # initial directory firstly
    os.mkdir(dir_path)

    # save article to files
    for i in range(sample_size):
        file_name = '{}/{}.txt'.format(dir_path, i)
        article = generate_article()
        save_to_file(file_name, article)

    # count word popularity
    for root, dirs, files in os.walk(dir_path):
        for file_name in files:
            with open('{}/{}'.format(dir_path, file_name)) as f:
                if validate(word, f.read()):
                    count += 1
    finally:
        # clean files
        shutil.rmtree(dir_path, ignore_errors=True)

    return jsonify({'popularity': count / sample_size * 100, 'word': word})
As can be seen from the source code, this case application will generate a batch of temporary files during the processing of each request, then read them into memory for processing, and finally delete the whole directory. This is a common technique of using disk space to process a large amount of data. However, in this case, the I/O request is too heavy, resulting in excessive disk I/O utilization. To solve this, it is actually an algorithm optimization problem. For example, when the memory is sufficient, all data can be processed in the memory, which can avoid the performance problem of I/O.
You can check it and access it separately in terminal 2 http://192.168.0.10:10000/popularity/word And http://192.168.0.10:10000/popular/word , compare the effects before and after:
$ time curl http://192.168.0.10:10000/popularity/word
{
  "popularity": 0.0,
  "word": "word"
}
real    2m43.172s
user    0m0.004s
sys    0m0.007s
$ time curl http://192.168.0.10:10000/popular/word
{
  "popularity": 0.0,
  "word": "word"
}

real    0m8.810s
user    0m0.010s
sys    0m0.000s
The new interface can return in 8 seconds, which is much better than the first 3 minutes. Of course, this is only the first step of optimization, and the method is not perfect. Further optimization can be done. However, in the actual system, most of us do similar things. First use the simplest method to solve the online problems as soon as possible, and then continue to think about better optimization methods.
3. Summary
Today, we analyzed a case of word heat with slow response. First, we use top and iostat to analyze the CPU and disk usage of the system. We found the disk I/O bottleneck and knew that the bottleneck was caused by the case application.
Then, we tried to copy the method of the previous case and use strace to observe the system call of the process, but this time we were unlucky and didn't find any write system call. Therefore, we used a new tool to find out the problem of case application with the help of filetop and opensnoop in the dynamic tracking toolkit bcc. We found that the root cause is a large number of reading and writing temporary files.
After finding out the problem, the optimization method is relatively simple. If the memory is sufficient, the simplest way is to put the data in the faster memory, so there is no bottleneck of disk I/O. Of course, further, you can also use various algorithms such as Trie tree to further optimize the efficiency of word processing.