Create symbolic breakpoints
Click the + button in the lower left corner of Xcode Breakpoint Navigator to create different types of breakpoints:
- Swift Error Breakpoint
- Exception Breakpoint...
- Symbolic Breakpoint...
- OpenGL ES Error Breakpoint
- Runtime Issue Breakpoint
- Constraint Error Breakpoint
- Test Failure Breakpoint
Although the above seven breakpoints have different application scenarios, their configurations are similar. Take the configuration of symbolic breakpoints as an example:
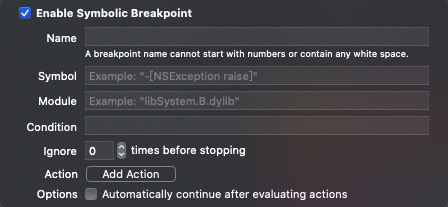
The meaning of each field is as follows:
-
Name: breakpoint name. To distinguish from the breakpoint number, the breakpoint name cannot start with a number and cannot contain any spaces
-
Symbol: symbol name. Fill in the name of the method or function to set the breakpoint (for example: - [NSException raise], - represents the object method, and + represents the class method)
-
Module: module name. Fill in the module to which the method or function to set the breakpoint belongs (for example: libSystem.B.dylib). It is not filled in by default to search all modules in the process
-
Condition: trigger condition. The return value of the filled expression must be of type bool. For example:
- Judge whether the method caller is an instance of the given class (isMemberOfClass:)
- Judge whether the method caller is in the inheritance system of the given class (isKindOfClass:)
- Judge whether a given object can respond to a given method (respondsToSelector:)
- Judge whether the given object follows the given protocol (conformsToProtocol:)
- Get the address of the method implementation (methodForSelector:)
- Or other expressions whose return value is bool
-
Ignore: ignore the first n hits of the breakpoint. The priority is above the Condition, that is, the Condition is met first, and then ignore is calculated
-
Action: breakpoint behavior. Xcode provides the following six behaviors for breakpoints:
- AppleScript, launched by apple, is a powerful scripting language built into macOS
- Capture GPU Frame, Capture GPU Frame
- Debugger Command, execute LLDB related commands
- Log Message to output log information
- Shell Command, execute Shell Command
- Sound: play sound
-
Options: breakpoint options. It is used to control whether the breakpoint automatically continues to run the program after executing the Action. Check the Automatically continue after evaluating actions check box, and the breakpoint will automatically continue to run the program after executing the Action
The configuration of symbolic breakpoints in Xcode is as follows:
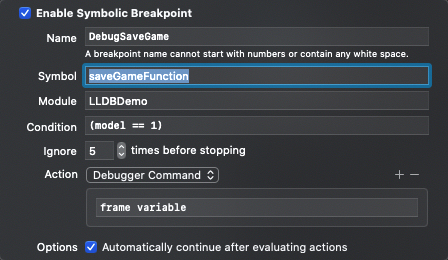
Equivalent to the following LLDB command:
# Create breakpoint
(lldb) breakpoint set --breakpoint-name DebugSaveGame --name saveGameFunction --shlib LLDBDemo --condition '(model == 1)'  --ignore-count 5 --command 'frame variable' --auto-continue true
Breakpoint 1: where = LLDBDemo`saveGameFunction + 24 at ViewController.m:39:5, address = 0x0000000100855048
# When viewing breakpoints, the meanings of the output fields are as follows
# name = 'saveGameFunction', the symbol name is saveGameFunction
# module = LLDBDemo, and the module name is LLDBDemo
# locations = 1. The number of breakpoint locations matched according to the constraint conditions of the breakpoint (total number of breakpoints) is 1
# resolved = 1, the number of breakpoints resolved (number of breakpoints available) is 1
# hit count = 0, and the number of breakpoints hit is 0
# Options: ignore: 5 enabled auto continue, breakpoint options: ignore the first 5 hits of the breakpoint, and automatically continue to run the program after executing the breakpoint command
# Breakpoint commands: frame variable. After hitting the breakpoint, execute the frame variable command
# Condition: (model == 1), the condition to hit the breakpoint is model == 1
# Names: DebugSaveGame. The name of the breakpoint is identified as DebugSaveGame
(lldb) breakpoint list
Current breakpoints:
1: name = 'saveGameFunction', module = LLDBDemo, locations = 1, resolved = 1, hit count = 0 Options: ignore: 5 enabled auto-continue
    Breakpoint commands:
      frame variable

Condition: (model == 1)

  Names:
    DebugSaveGame

  1.1: where = LLDBDemo`saveGameFunction + 24 at ViewController.m:39:5, address = 0x0000000100855048, resolved, hit count = 0
hcg note:
LLDB will always create a breakpoint from your constraint, even if LLDB does not find any code location matching the constraint (that is, LLDB will create a breakpoint even if the code location of the point we want to break is not found). When the breakpoint you set cannot be resolved, LLDB will report the breakpoint as pending
(lldb) breakpoint set --name nonFunction
Breakpoint 1: no locations (pending).
WARNING:  Unable to resolve breakpoint to any actual locations.
About the debug area at the bottom of Xcode
The program will pause when it hits the breakpoint. At this time, the debugging area at the bottom of Xcode will be opened to allow us to interact with LLDB
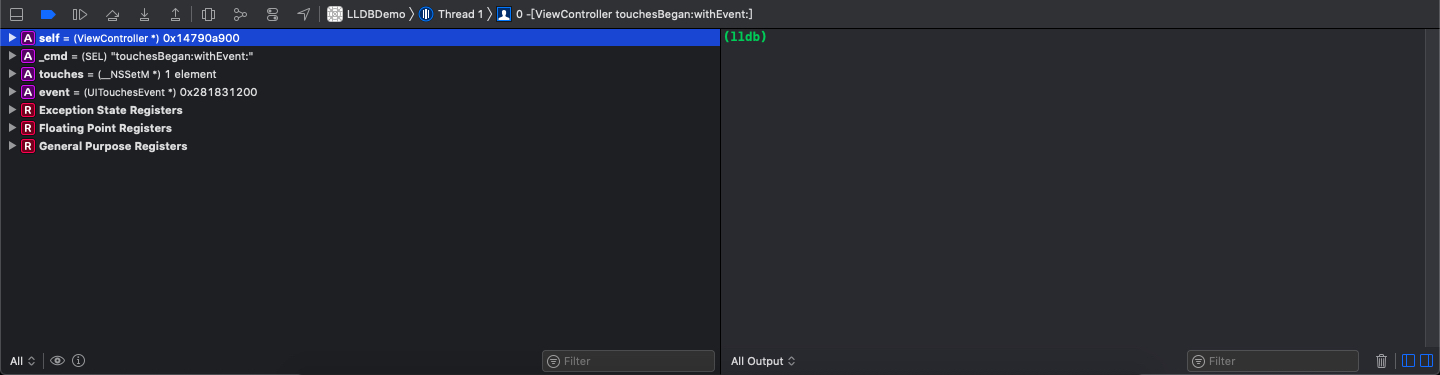
The commissioning area is mainly composed of three parts:
-
The (debug bar) at the top contains the following buttons:
-
Hide the Debug area / Show the Debug area
-
Deactivate breakpoints / Activate breakpoints, disable all breakpoints / enable all breakpoints
Equivalent to LLDB command breakpoint disable / breakpoint enable -
Continue program execution / Pause program execution
It is equivalent to LLDB command process continue / process interrupt -
Step over, single step execution at the source level, will cross the call of function or method, and will single step all threads
Equivalent to LLDB command thread step overThe instruction of control will be executed step by step, and the instruction of control will be executed step by step
Equivalent to LLDB command thread step Inst overStep over thread (hold control shift), a single step execution at the source level, will step over the call of a function or method and only execute the current thread in a single step
Equivalent to LLDB command thread step over -- run mode this thread -
Step into, single step execution at the source level, will enter the call of function or method, and will single step all threads
Equivalent to LLDB command thread step inStep into instruction (hold Control), single step execution at the assembly instruction level, will enter the call of assembly function, and will single step execute all threads
Equivalent to LLDB command thread step InstStep into thread (hold control shift). Single step execution at the source level will enter the call of function or method, and only single step the current thread
Equivalent to LLDB command thread step in -- run mode this thread -
Step out, execute the current stack frame and pause after returning
Equivalent to LLDB command thread step out -
Debug View Hierarchy to view the view hierarchy
-
Debug Memory Graph to view memory allocation, which can be used to check memory leakage
-
Environment Overrides: environment reset. The environment here refers to the device environment rather than environment variables
For example: whether the appearance of the device is in Light mode or Dark mode, the font size of the device, and other accessible items of the device -
Simulate Location, which is used to debug applications with positioning function
-
Choose stack frame (hold Command to show full backtrace). Select the current stack frame according to the hierarchical relationship of process - thread - stack frame
Hold down the Command key to display all stack frames of the current thread
-
-
The (variables view) on the left shows a list of variables that can be viewed within the current location in the code. This list is a publicly available hierarchy. You can display the values of all parts of the variable structure by gradually clicking the small triangle to the left of the variable. In addition, the variable view has the following functions:
-
Choose a scope option to select the variable under which scope to display:
- Auto to display the most recently accessed variables
- Local Variables to display only Local Variables
- All Variables, Registers, globals and statistics to display all local variables, Registers, global variables and static variables
-
Open Quick Look opens the quick view page for the selected variable
-
Print Description: print the description method of the selected variable
-
Filter the results
-
Hide the Variables View / Show the Variables View
-
-
The (console) on the right contains a text area of the interactive terminal, which can be used to interact directly with LLDB. In addition, the console has the following functions:
-
Choose an output option to select which type of output to display:
- All Output to display all types of output
- Debugger Output, which displays only the output of the debugger
- Target Output, which displays only the output of the program
-
Filter the results
-
Clear Console to clear the console
-
Hide the Console / Show the Console
-
When using the expression command to execute a method, you need to cast the sent message to the return value type of the method
(lldb) expression NSArray* $array = @[@"Saturday", @"Sunday", @"Monday"]
(lldb) expression [$array count]
(NSUInteger) $0 = 3
# Sometimes LLDB fails to execute the expression command because it cannot recognize the method
(lldb) expression [[$array objectAtIndex:0] uppercaseString]
error: <user expression 6>:1:27: no known method '-uppercaseString'; cast the message send to the method's return type
[[$array objectAtIndex:0] uppercaseString]
~~~~~~~~~~~~~~~~~~~~~~~~~~^~~~~~~~~~~~~~~~
# At this point, you need to cast the sent message to the return value type of the method
(lldb) expression (NSString *)[[$array objectAtIndex:0] uppercaseString]
(NSTaggedPointerString *) $1 = 0x9f0ca30e86dba9b3 @"SATURDAY"
About the output format of p and po
int value = 97;
char str[] = {'h', 'e', 'l', 'l', 'o', '\0'};
# hcg note:
# For details, please refer to GDB format in general parameter type explanation
# The output formats of p and po can only use the format letter in GDB format, not the repeat count and size letter in GDB format

# Output the return value in the default format
(lldb) p value
(int) $0 = 97

# /o: output the return value in octal format (the letter o indicates octal)
(lldb) p/o value
(int) $1 = 0141

# /x: output the return value in hexadecimal format (the letter x indicates hexadecimal)
(lldb) p/x value
(int) $2 = 0x00000061

# /d: output the return value in signed decimal format (the letter d indicates decimal)
(lldb) p/d value
(int) $3 = 97
(lldb) p/d 'a'
(int) $4 = 97

# /u: output the return value in unsigned decimal format (the letter u indicates unsigned decimal)
(lldb) p/u value
(int) $5 = 97

# /t: output the return value in binary format (the letter t indicates binary)
(lldb) p/t value
(int) $6 = 0b00000000000000000000000001100001

# /f: output the return value in the format of floating point number (the letter f indicates float)
(lldb) p/f value
(int) $7 = 1.35925951E-43

# /i: output the return value in the format of instruction (the letter i indicates instruction)
(lldb) p/i value
(int) $8 = 0x00000061   udf    #0x61

# /c: output the return value in the format of character constant (the letter c represents char)
(lldb) p/c value
(int) $9 = a\0\0\0
(lldb) p/c str
(char [6]) $10 = "hello"

# /s: output the return value in the format of string (the so-called string, that is, the character array ending with the null character '\ 0') (the letter s represents string)
(lldb) p/s str
(char [6]) $11 = "hello"

# /A: output the return value in the format of address (the letter a indicates address)
(lldb) p/a value
(int) $12 = 0x00000061
(lldb) p/a str
(char [6]) $13 = "hello"

# /T: output the return value in the format of system type (the letter T indicates OSType)
(lldb) p/T value
(int) $14 = '\0\0\0a'

# /A: output the return value in hexadecimal floating-point number format (the letter a indicates float as hex)
(lldb) p/A value
(int) $15 = 0x0.0000c2p-126
Read, set and operate the value of the register through the expression command
In the command space of LLDB, all registers exist in the form of global variables. Take the CPU of arm64 as an example:
The x0 register corresponds to the global variable $x0,
The X1 register corresponds to the global variable $x1,
And so on
# Set the value of x0 register to 1 through the expression command
(lldb) expression $x0 = 1
(unsigned long) $0 = 1
# Read the value of x0 register through register read command, and it is 1 as expected
(lldb) register read x0
       x0 = 0x0000000000000001
# Set the value of x0 register to 2 through register write command
(lldb) register write x0 2
# Read the value of x0 register through the expression command, and it is 2
(lldb) expression $x0
(unsigned long) $1 = 2
You can not only read and set the value of the register itself through the expression command, but also operate the value pointed to by the register through the expression command
# Get the plaintext data pointed to by the x1 register (assuming that the x1 register points to a memory area of NSData type)
(lldb) expression [[NSString alloc] initWithData:(NSData *)$x1 encoding:NSUTF8StringEncoding]
(NSTaggedPointerString *) $5 = 0xe6d4a5b08059bc5e @"hcg"
# Call the sayHello method of the Person object pointed to by the x2 register (assuming that the x2 register points to a memory area of Person type)
(lldb) po [(Person *)$x2 sayHello]
2022-01-22 16:29:43.017872+0800 LLDBDemo[77517:18697227] hello, my name is hcg, I am 20 years old !
The expression command can only execute expressions in the current thread. The expression command cannot execute expressions across threads
The following Objective-C Code:
...
int main_a = 10;
NSLog(@"%d", main_a);

dispatch_async(dispatch_get_global_queue(DISPATCH_QUEUE_PRIORITY_DEFAULT, 0), ^{
   int local_variable = 11; // Set a breakpoint here
   NSLog(@"🎉🎉🎉 local_variable = %d", local_variable);
});
...
Execute the program and hit the breakpoint. If you execute Po main at this time_ A command (equivalent to executing an expression across threads), the following error will be printed:
(lldb) p main_a
error: <user expression 0>:1:1: use of undeclared identifier 'main_a'
main_a
^
Get target and action of UIButton
# 1. Obtain the memory address of UIButton object through interface analysis
(lldb) po self.view.subviews
<__NSArrayM 0x283c1b9c0>(
<UIButton: 0x104f15040; frame = (176 187; 62 30); opaque = NO; autoresize = RM+BM; layer = <CALayer: 0x2832410e0>>,
<UIButton: 0x104f158f0; frame = (176 262; 62 30); opaque = NO; autoresize = RM+BM; layer = <CALayer: 0x283240e20>>,
<UIButton: 0x104f15bc0; frame = (176 331; 62 30); opaque = NO; autoresize = RM+BM; layer = <CALayer: 0x283240d40>>,
<_UILayoutGuide: 0x104f15e90; frame = (0 0; 0 44); hidden = YES; layer = <CALayer: 0x283240c60>>,
<_UILayoutGuide: 0x104f16420; frame = (0 862; 0 34); hidden = YES; layer = <CALayer: 0x283240b80>>
)
# 2. Get all target s of UIButton object
(lldb) po [(UIButton *)0x104f15040 allTargets]
{(
	<ViewController: 0x104f0bcc0>
)}
# 3. Get the UIButton object, specify the target, and specify the action of the click event
(lldb) po [(UIButton *)0x104f15040 actionsForTarget:(ViewController *)0x104f0bcc0 forControlEvent:0]
<__NSArrayM 0x283c2c630>(
	saveGameBtnDidClick:
)
About rendering services (backboard)
# Get the view of the root controller through the expression command and change its background color to orange
# Generally, the change of the interface will be seen only after the program continues to run. Because the changed content must be sent to the rendering service, and then the display of the screen will be updated
(lldb) expression UIView* $currentView = [UIApplication sharedApplication].keyWindow.rootViewController.view
(lldb) expression (void)[$currentView setBackgroundColor:[UIColor orangeColor]]
# The rendering service is actually another process (called backboard)
# In other words, even if the process of the interface we are debugging is interrupted, the process of the rendering service (backboard) continues to run
# This means that you can run the following command without running the program, and you can see the change of background color:
# hcg note: This is the implementation principle of caflush command in Chisel
(lldb) expression (void)[CATransaction flush]
Gets the current ASLR offset of the specified mirror
# Print the ASLR offset of the 0th image (that is, the macho of the main program)
po _dyld_get_image_vmaddr_slide(0)
Use the watchpoint command to monitor the reading and writing of the specified member variables of the specified object
Suppose we have an object of type Person, and we don't know why_ The age variable is overridden. Because this does not involve accessor methods for properties, symbolic breakpoints cannot be used. Instead, we need to monitor when this address is written
Mode 1:
(lldb) expression Person* $aPerson = (Person *)0x00000002803a8300
# Get member variable_ The offset of age relative to the $aPerson object
(lldb) expression Ivar* $ivar_age = (Ivar *)class_getInstanceVariable([Person class], "_age")
(lldb) expression ptrdiff_t $offset_age = (ptrdiff_t)ivar_getOffset($ivar_age)
(lldb) po $offset_age
8
# Get member variable_ Size of age
(lldb) po (const char *)ivar_getTypeEncoding($ivar_age)
"i"
(lldb) po sizeof(int)
4
# Use the watchpoint set expression command to monitor access to the $aPerson object_ Write of age member variable
(lldb) watchpoint set expression --size 4 -- (char *)$aPerson + $offset_age
Watchpoint created: Watchpoint 1: addr = 0x2803a8308 size = 4 state = enabled type = w
   new value: 0x0000000000000014
Mode 2:
# Monitor the p object through the watchpoint set variable command_ Write of age member variable
(lldb) watchpoint set variable p->_age
Watchpoint created: Watchpoint 1: addr = 0x281210b48 size = 4 state = enabled type = w
   declare @ '/Users/Airths/Desktop/Training/LLDBDemo/LLDBDemo/ViewController.m:110'
   watchpoint spec = 'p->_age'
   new value: 20