3. Local Method Stack
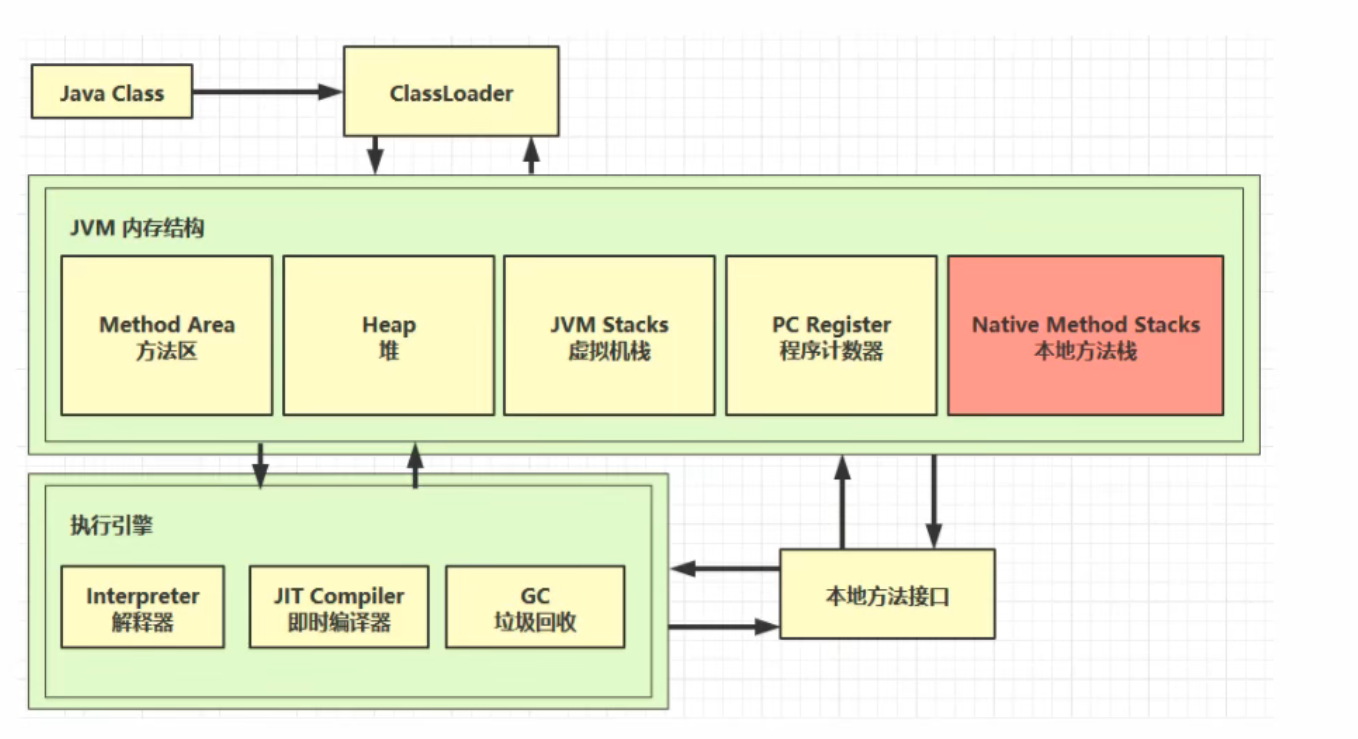
The local method stack is java The virtual machine needs to provide memory space for some local methods when they are called, which refers to those that are not java How to write code, because
 Ours java Code has some limitations, it sometimes can't deal directly with the bottom level of our operating system, so it needs some help c or c++Write native methods to work with the operating system
 Underlying api To deal with, java Code can indirectly invoke some of the underlying functions through local methods, which run in memory called local method stacks.
How many local methods are there? The answer is very many, no matter some java In the base class library or in the execution engine, they all call these local methods
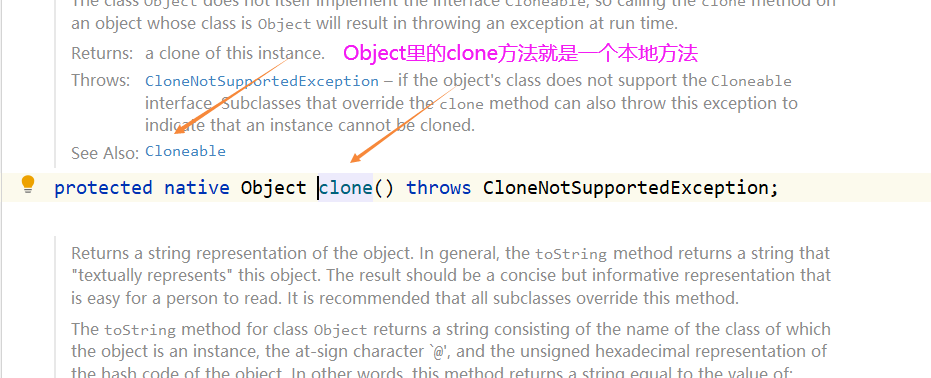
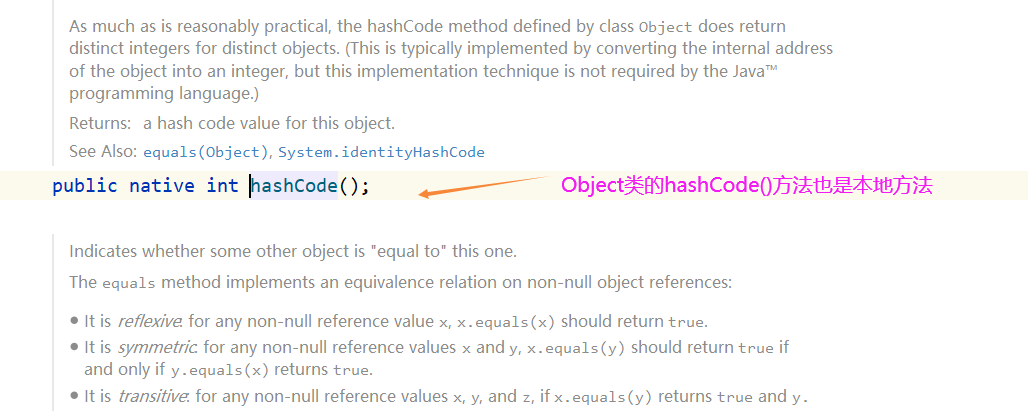
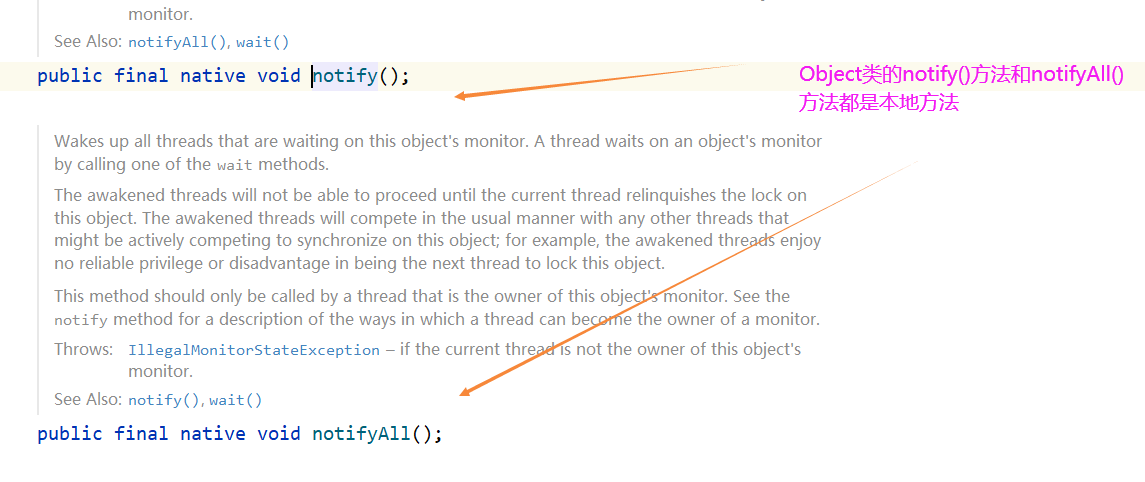
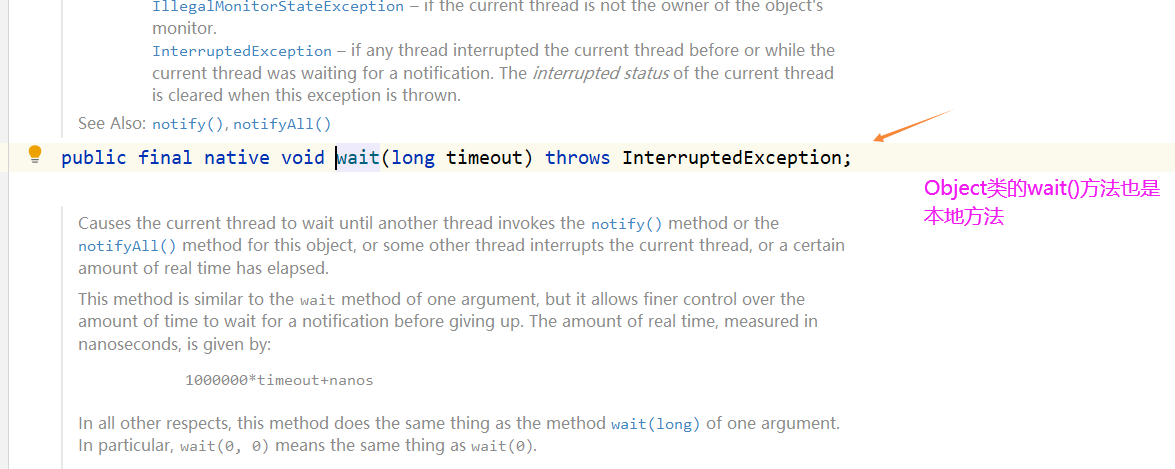
Object Inside Class clone()A method is a clone of an object, and you can see that its method statement is native,such native There is no way to implement it.
Its method implementation is achieved by c or c++Language written, our Java The code calls the real indirectly through the local method interface c and c++It can be implemented in many ways.
such as Object In class hashCode()The method is local. Object Class notify()Methods and notifyAll()The method is also local,Object class
 Of wait()Method is also local
The purpose of the local method stack is to provide a memory space for the local method to run
4. Heap
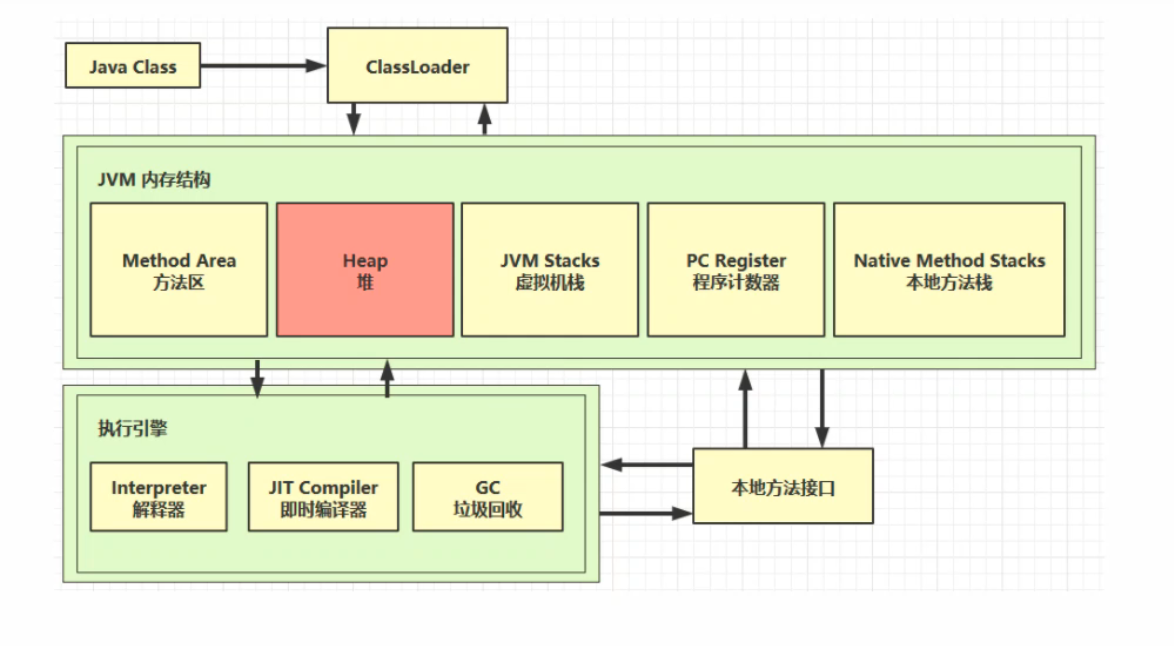
The program counters, virtual machine stacks, and local method stacks that we talked about earlier have a common feature. They are
 Threads are private, and the heap we'll start explaining now and the method area that follows can be seen as yes
 Thread shared area, let's look at the definition of heap next.
4.1 Definition
Heap heap
- With the new keyword, objects created use heap memory
Characteristic
-
It is shared by threads, and objects in the heap need to consider thread security.
Previously we talked about virtual machine stacks in which some local variables are thread-private, as long as your local variables
 Do not escape the scope of the method; it is thread safe.
But our heaps are different because the objects in the heap are generally thread-safe, because they are shared by threads, with exceptions, of course.
We'll talk about
-
Garbage Collection Mechanism
Objects that are no longer referenced in the heap are recycled as garbage to free up idle memory, rather than being blown up by objects created in the memory.
4.2 heap memory overflow
// Run the following code
import java.util.ArrayList;
import java.util.List;
/**
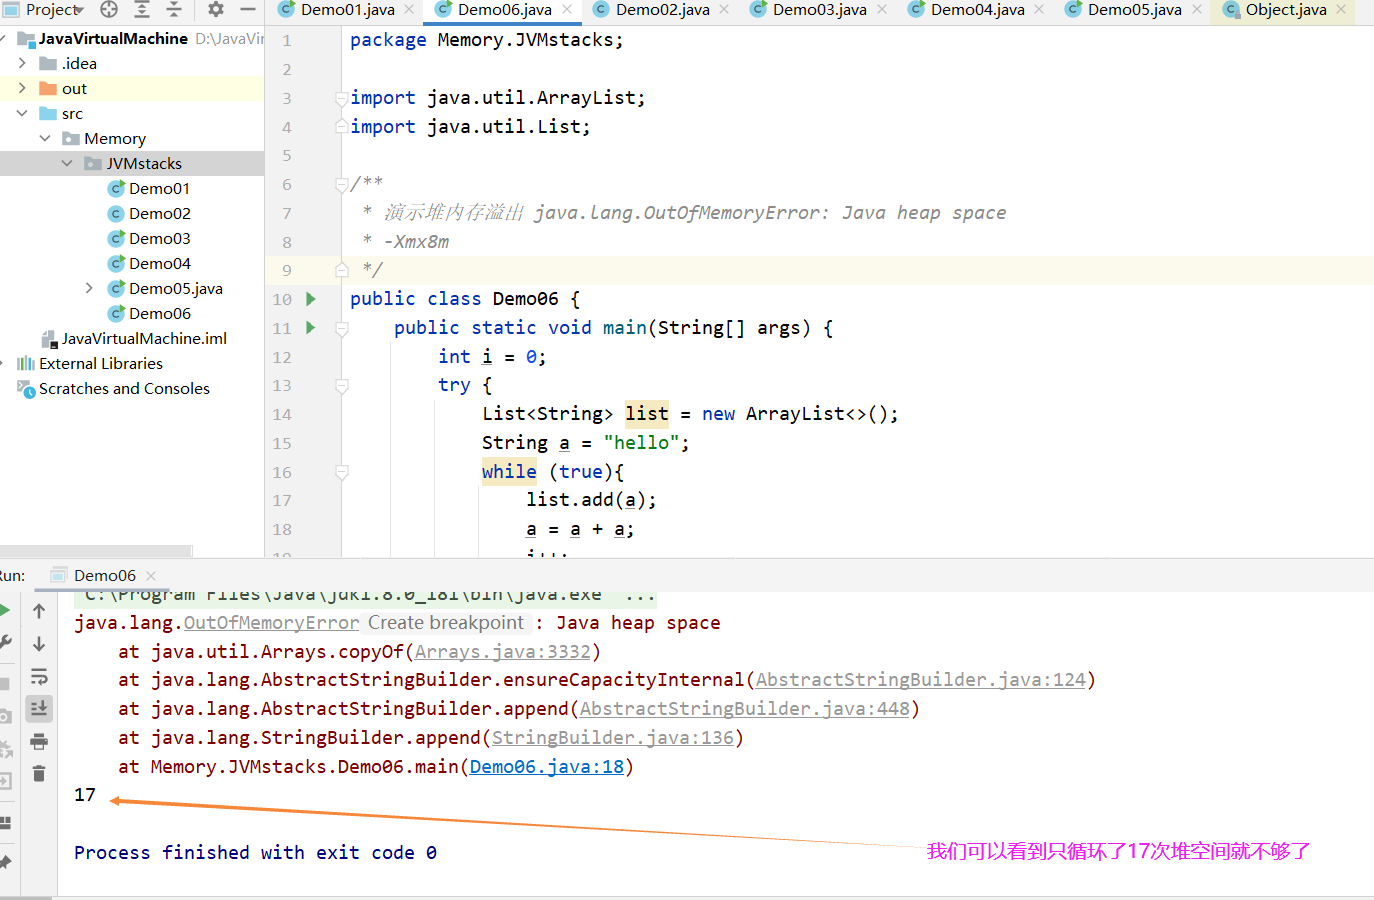
* Demo heap memory overflow java.lang.OutOfMemoryError: Java heap space
* -Xmx8m
*/
public class Demo06 {
public static void main(String[] args) {
int i = 0;
try {
List<String> list = new ArrayList<>();
String a = "hello";
while (true){
list.add(a);
a = a + a;
i++;
}
} catch (Throwable e) {
e.printStackTrace();
System.out.println(i);
}
}
}
The results are as follows:
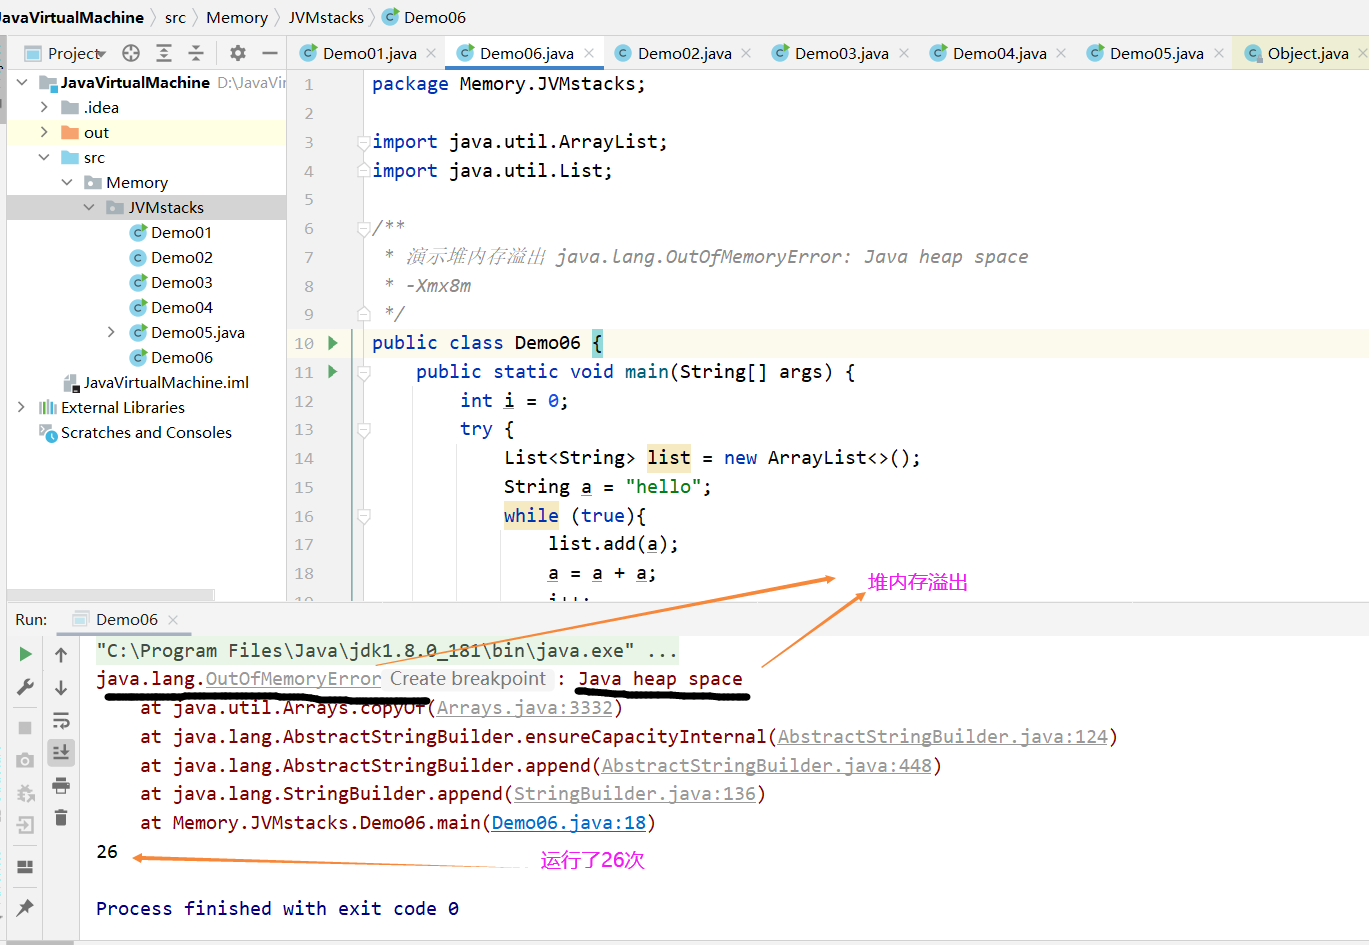
Let's analyze this case to see why it caused a heap memory overflow.
a Strings are incremental, while a Append all the way to list The tail of the set, continually turning hello String object added to list In a collection, and list Set its lifespan declared from it
 Start until catch In front of the block, it is a valid range, so it cannot be garbage collected, that is, the program has not yet reached it catch Before, it was always working
 So it's always valid, and the string objects inside it are appended to list Inside the collection, so these string objects are equivalent to someone using them, and they can't
 Is garbage collected, so as more and more string objects, it will take up our heap space, which is an analysis of our heap space overflow.
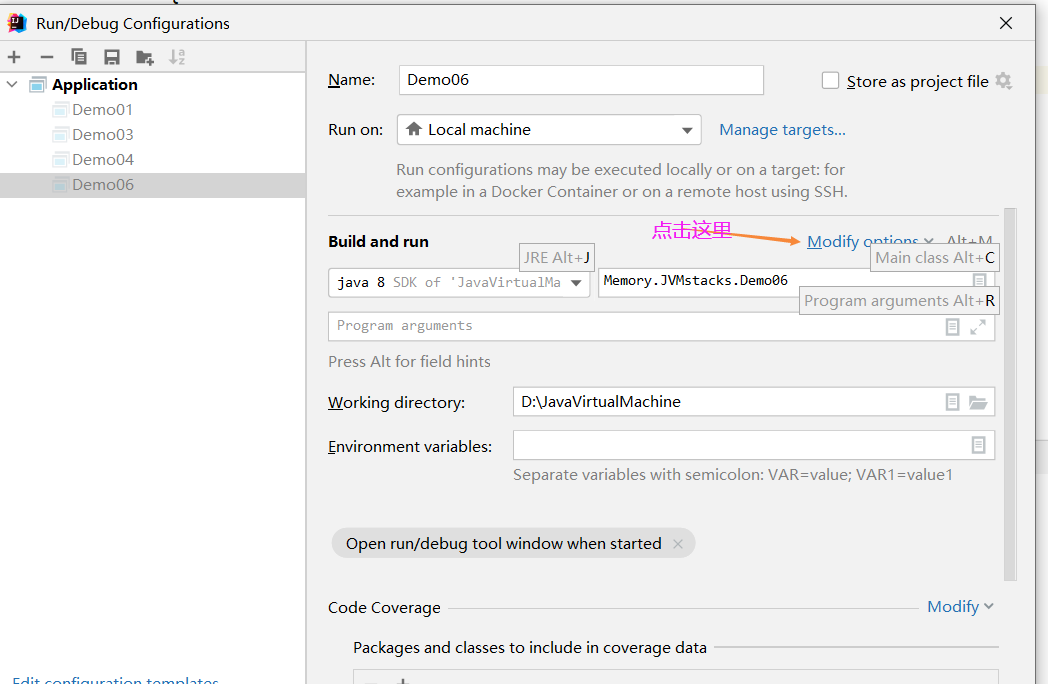
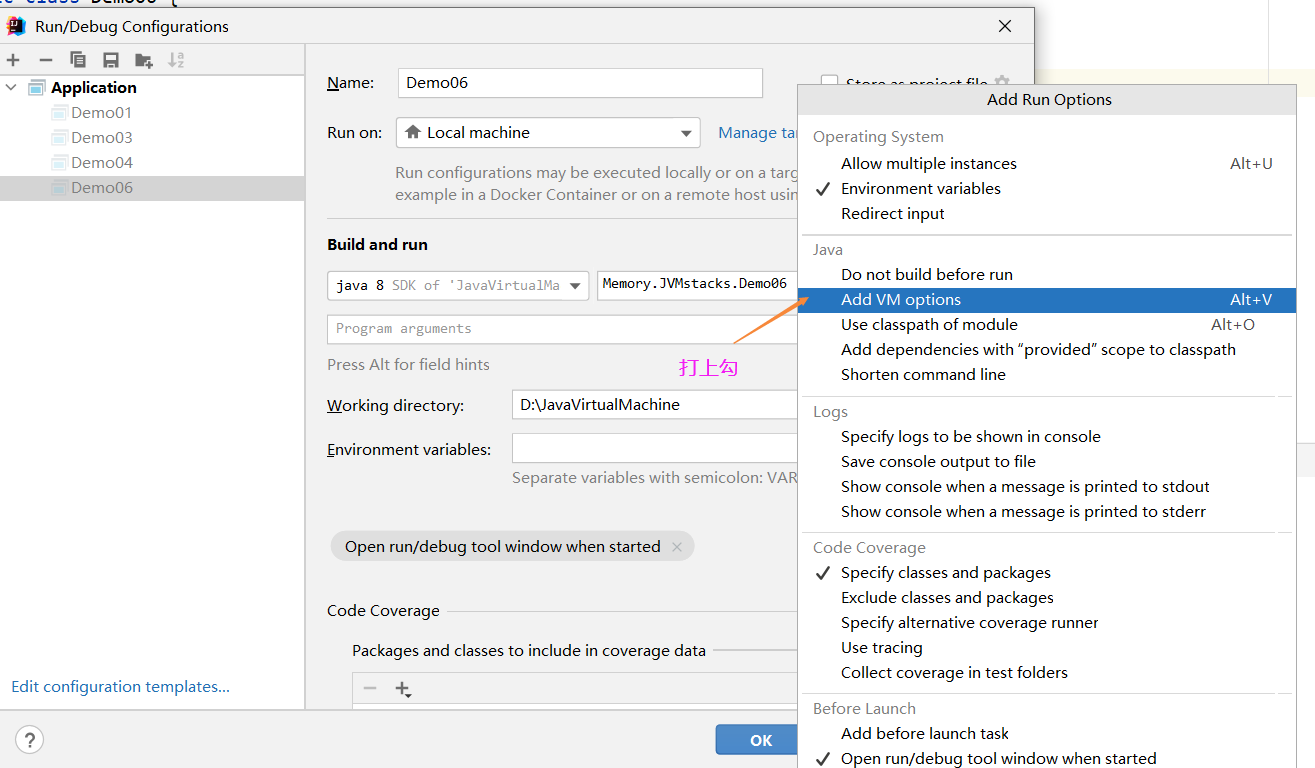
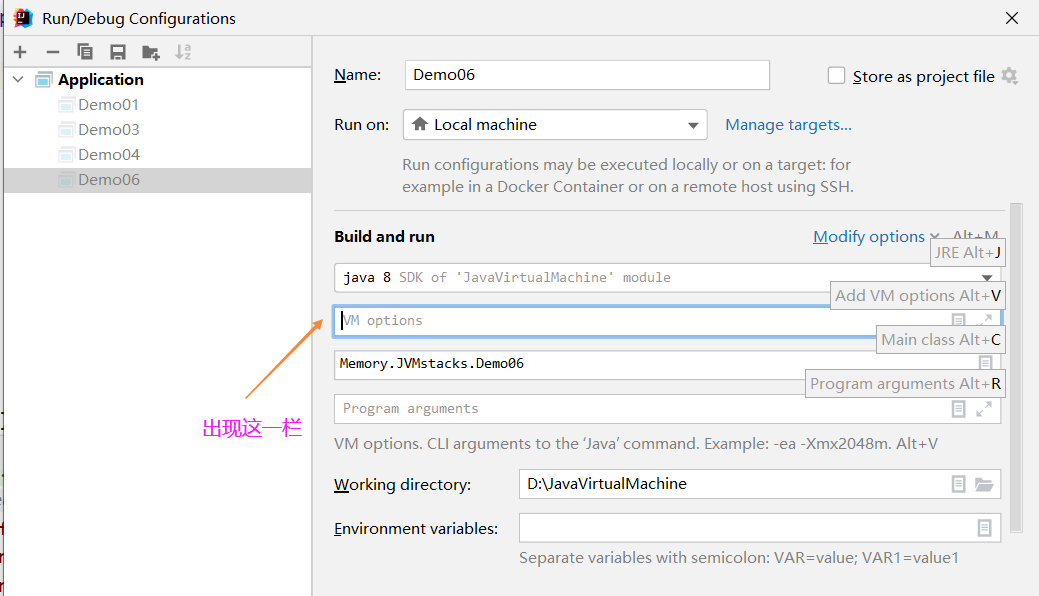
Next, let's talk about a parameter: -Xmx8m
 This parameter controls the maximum heap space, so now let's set the heap space to 8 m
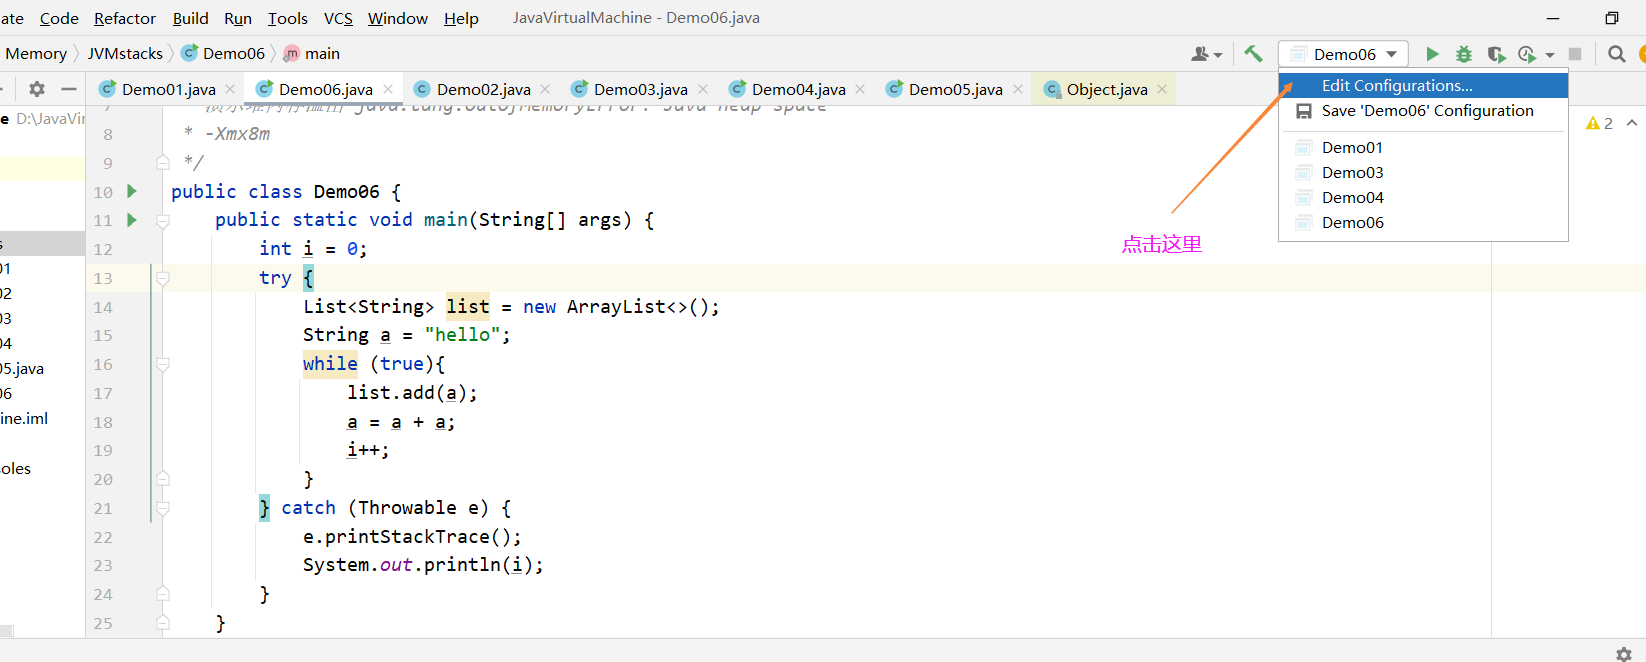
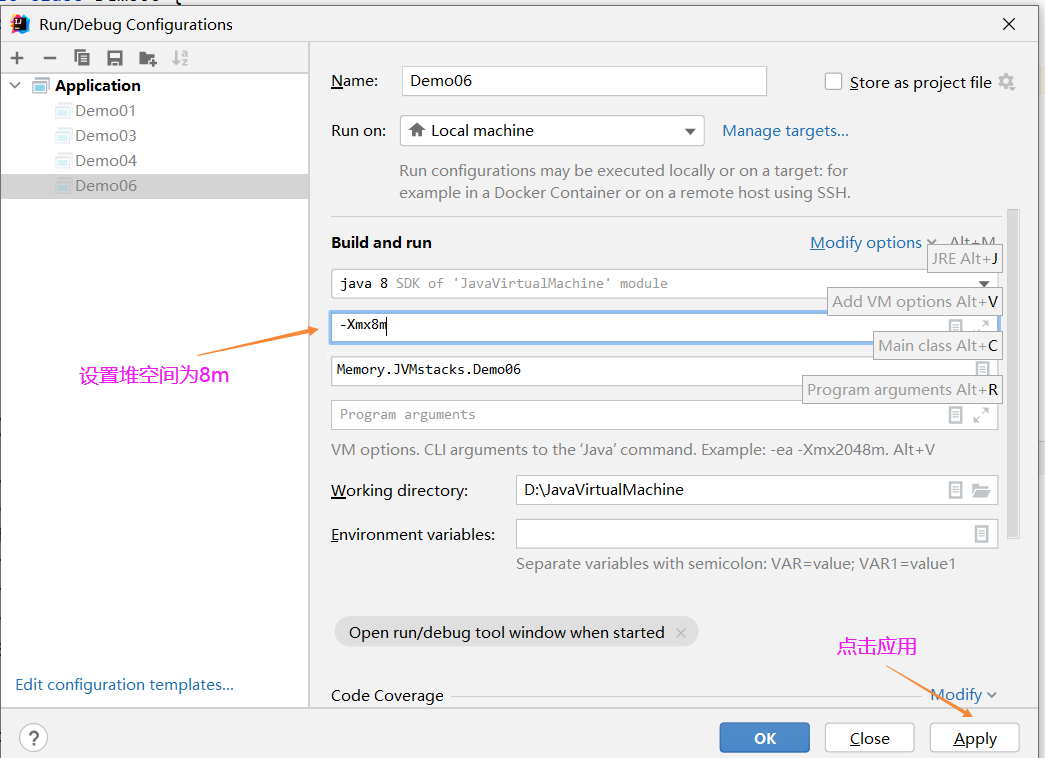
When we set heap space to 8 m After that, we run the above program again
Sometimes when the memory is very large, it may not be easy to expose this memory overflow problem. It may eventually cause your memory to overflow over time, but because of your memory
 Larger, maybe you have been running for a short period of time, you think it is OK, because the heap memory is still enough in a short period of time, so to troubleshoot this kind of heap memory overflow problem, you'd better put your
 The heap memory is set slightly smaller, which may expose possible heap memory overflow problems as soon as possible.
4.3 heap memory diagnostics
Here are some heap memory diagnostics related tools that can be typed directly on the command line window
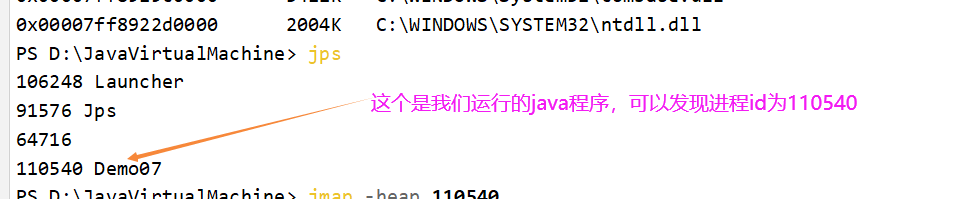
- jps tool
- See which java processes are in the current system and display their process numbers.
Once we get the id of the Java process, we can view the java process heap memory usage using the jmap tool
- jmap tool
- View heap memory usage jmap-heap process id
jmap You can only see its heap memory usage at a certain point in time. If you want to do a continuous monitoring of heap memory usage over time, you need to use one
 More complex jconsole Tools for monitoring.
- jconsole tool
- GUI
jconsole Tools are graphical interfaces, and the first two tools are command line methods, and jconsole It is a multifunctional monitoring tool that not only monitors heap memory usage,
It can also monitor threads, cpu These can be achieved by jconsole To monitor, and it can also achieve this continuous monitoring, let's look at these tools in a few specific cases
 Their use.
Let's look at this case:
/**
* Demo heap memory
*/
public class Demo07 {
public static void main(String[] args) throws InterruptedException {
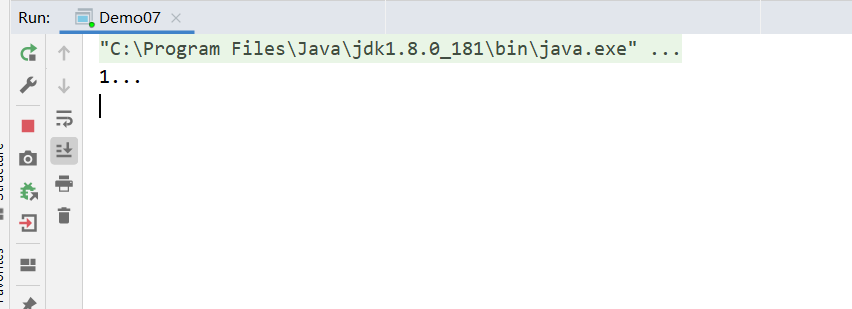
System.out.println("1...");
// Threads are sleeping for 30 seconds here to give us time to enter commands
Thread.sleep(30000);
// new 10M data
byte[] array = new byte[1024 * 1024 * 10]; // 10 MB, 1K 1M 10M
// Output 2... Indicates that the data has been new10M
System.out.println("2...");
// Threads are sleeping for 30 seconds here to give us time to enter commands
Thread.sleep(30000);
array = null;
System.gc();
// Output 3... Indicates that garbage collection has been performed
System.out.println("3...");
Thread.sleep(1000000L);
}
}
First, let's run the program, then use the jps tool to see the process id of the java program we're running
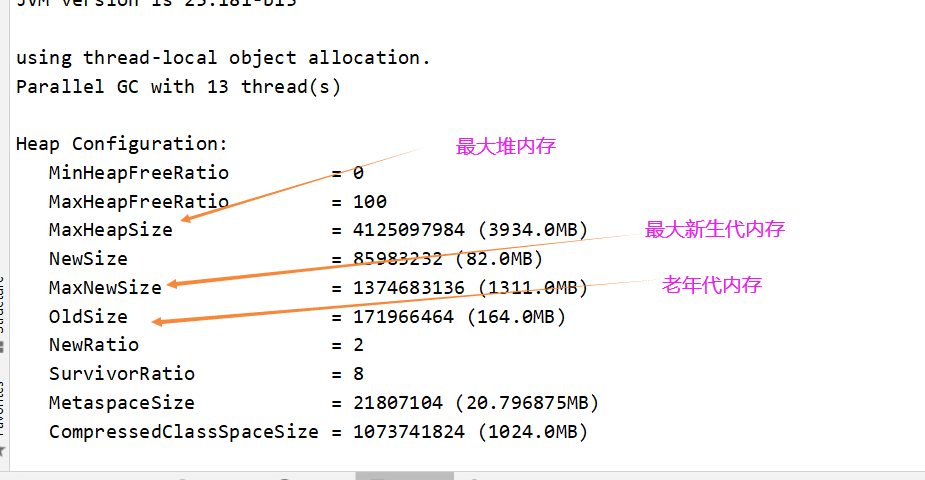
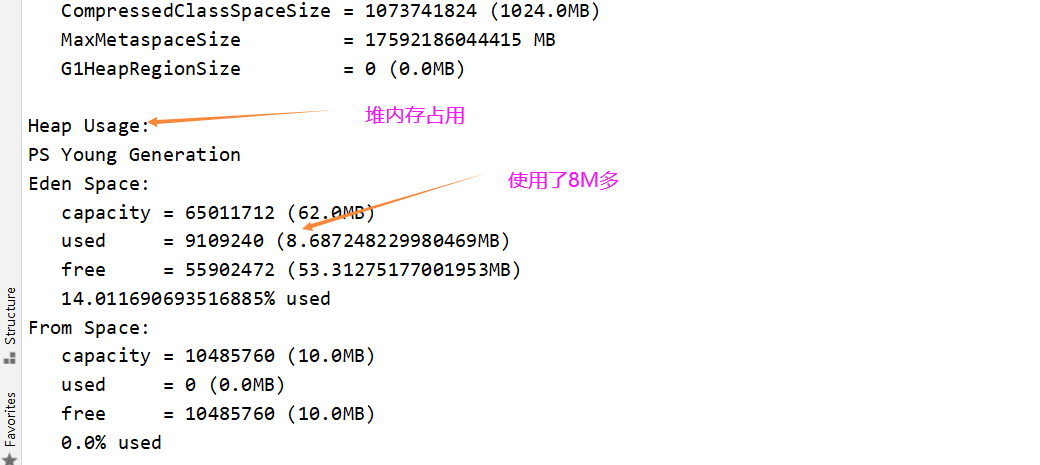
Then we use the jmap-heap ThreadID command when the program outputs 1...to see how much heap memory is being used by the java program we're running
This is the jmap-heap 110540 command
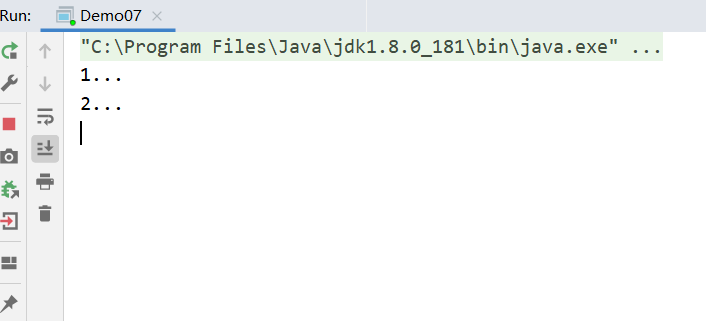
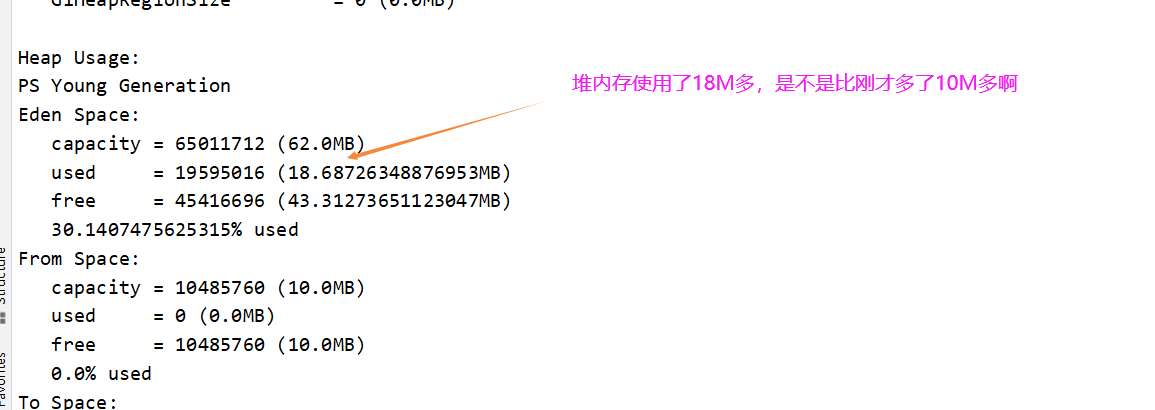
Execute to 2, that is, after the new array 10M has been allocated heap space, let's monitor it again
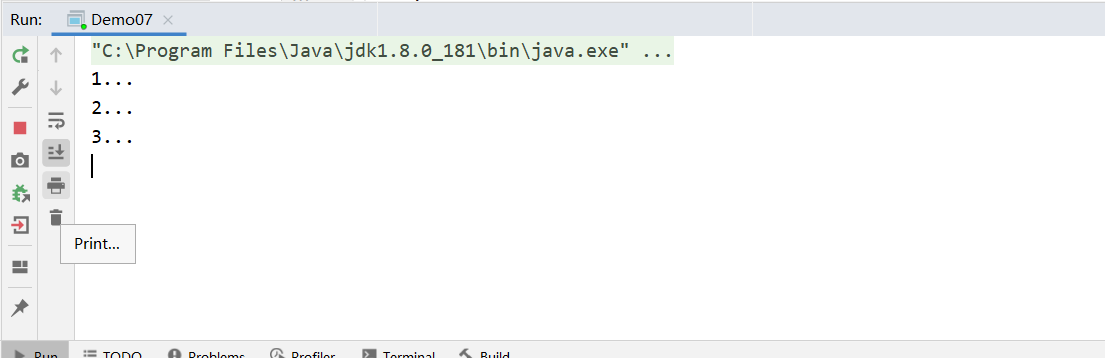
Let's move on to 3, after the garbage collection, and we'll monitor it again
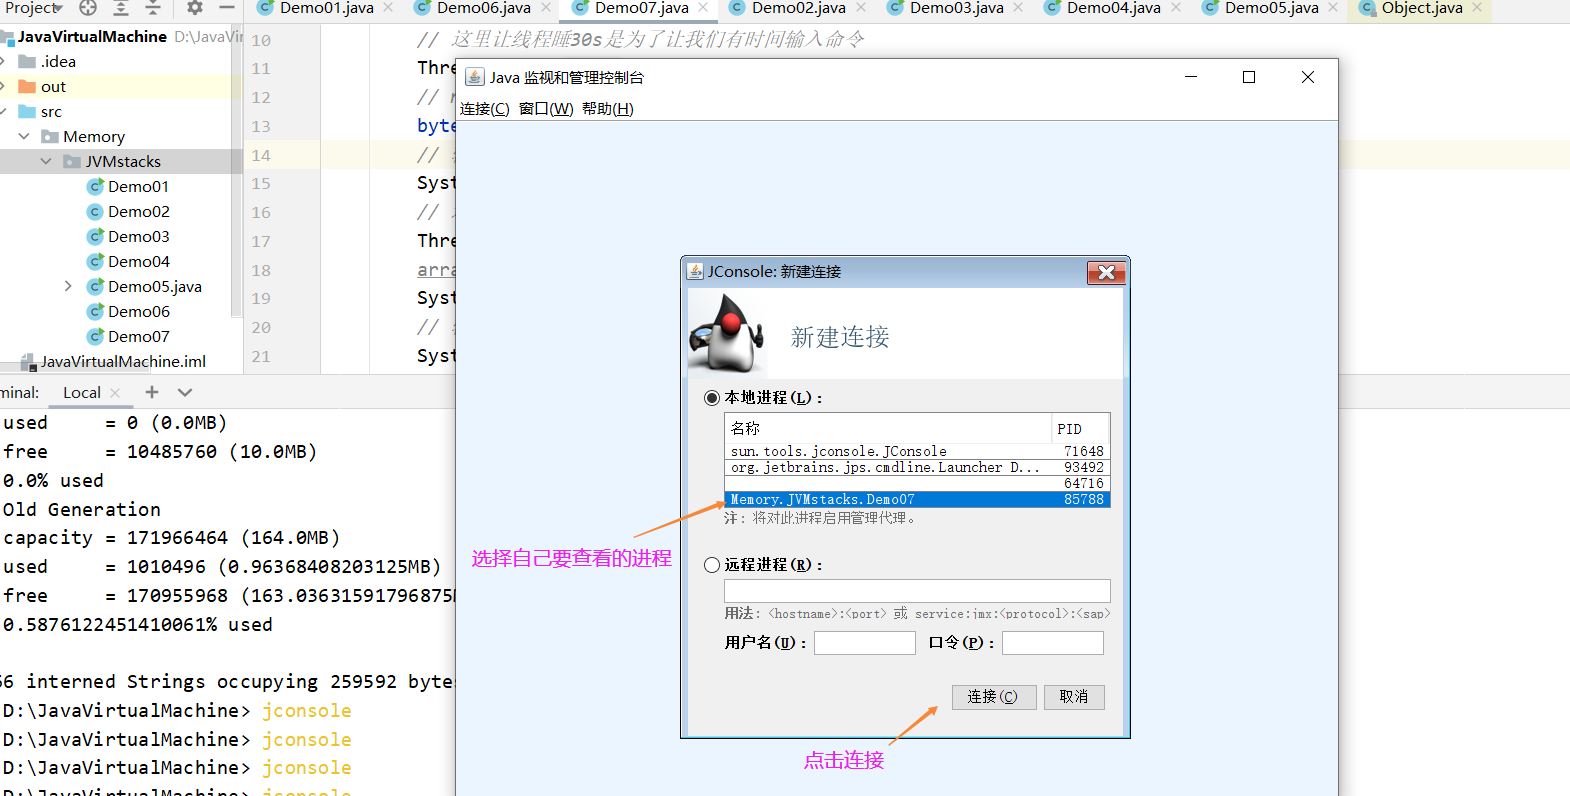
After reviewing the use of jps and jmap tools, let's take a look at the use of jconsole tools.
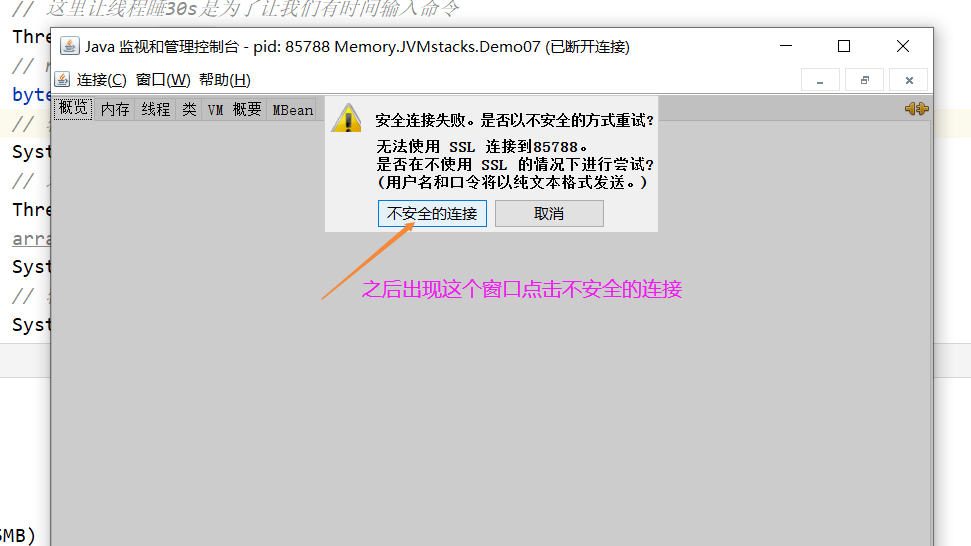
The window of the jconsole tool appears when you type jconsole on the command line
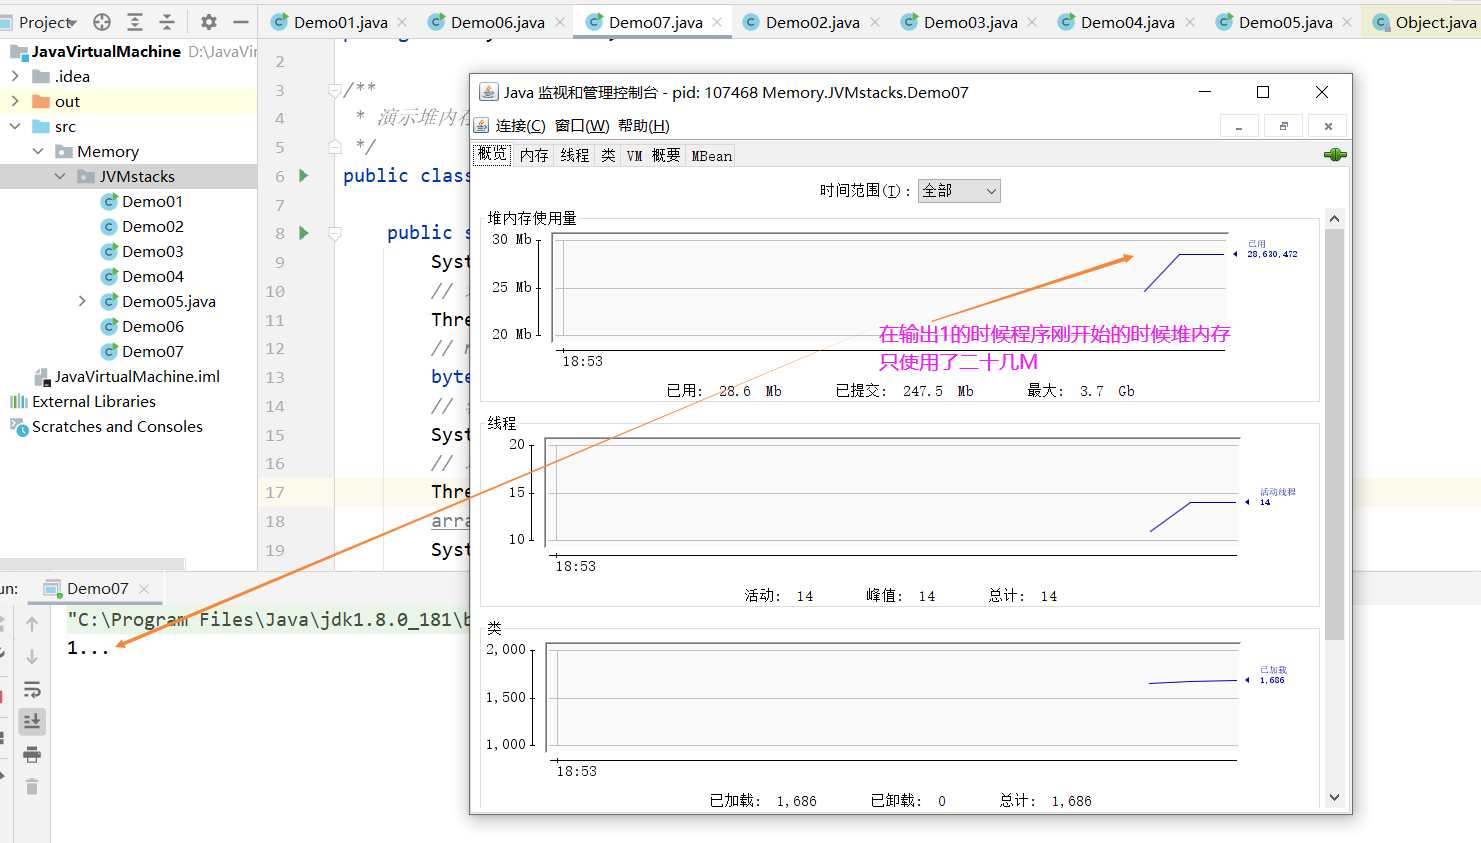
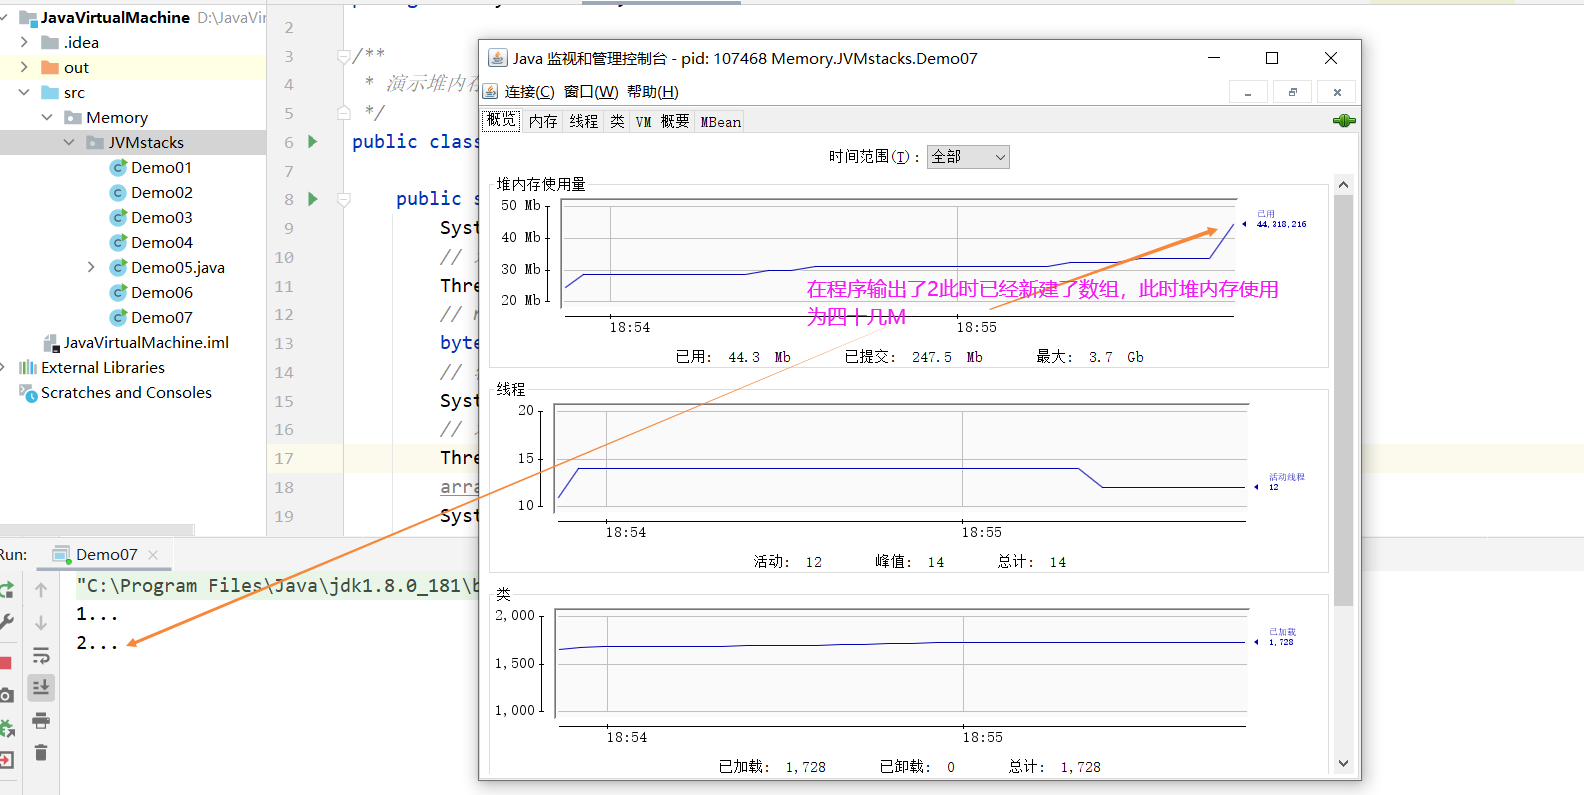
Let's then dynamically monitor heap memory usage during java program execution
First, let's look at output 1, where the heap memory usage is more than twenty M before the program starts running and the array is created.
A new array has been created at the time of program output 2, where the heap memory usage is over forty M. We can see that the heap memory usage is over ten M higher than that at output 1.
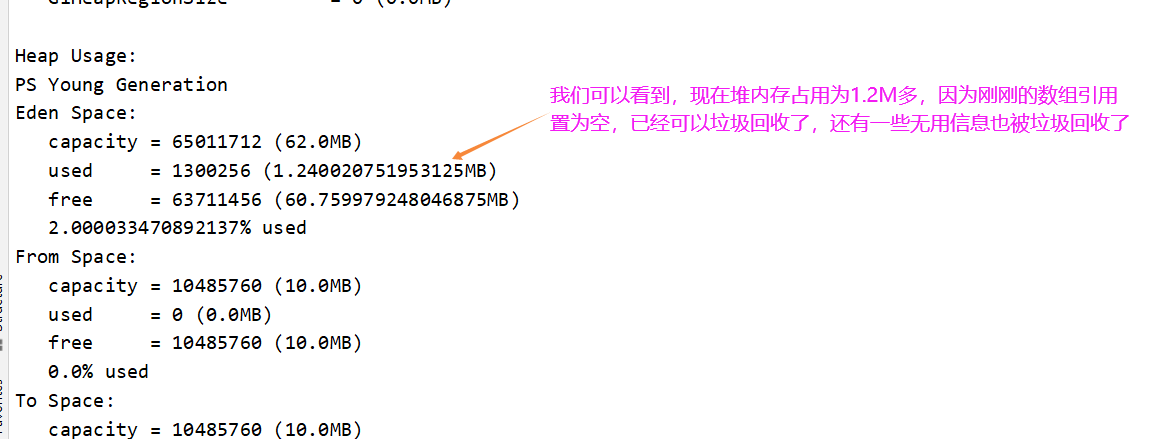
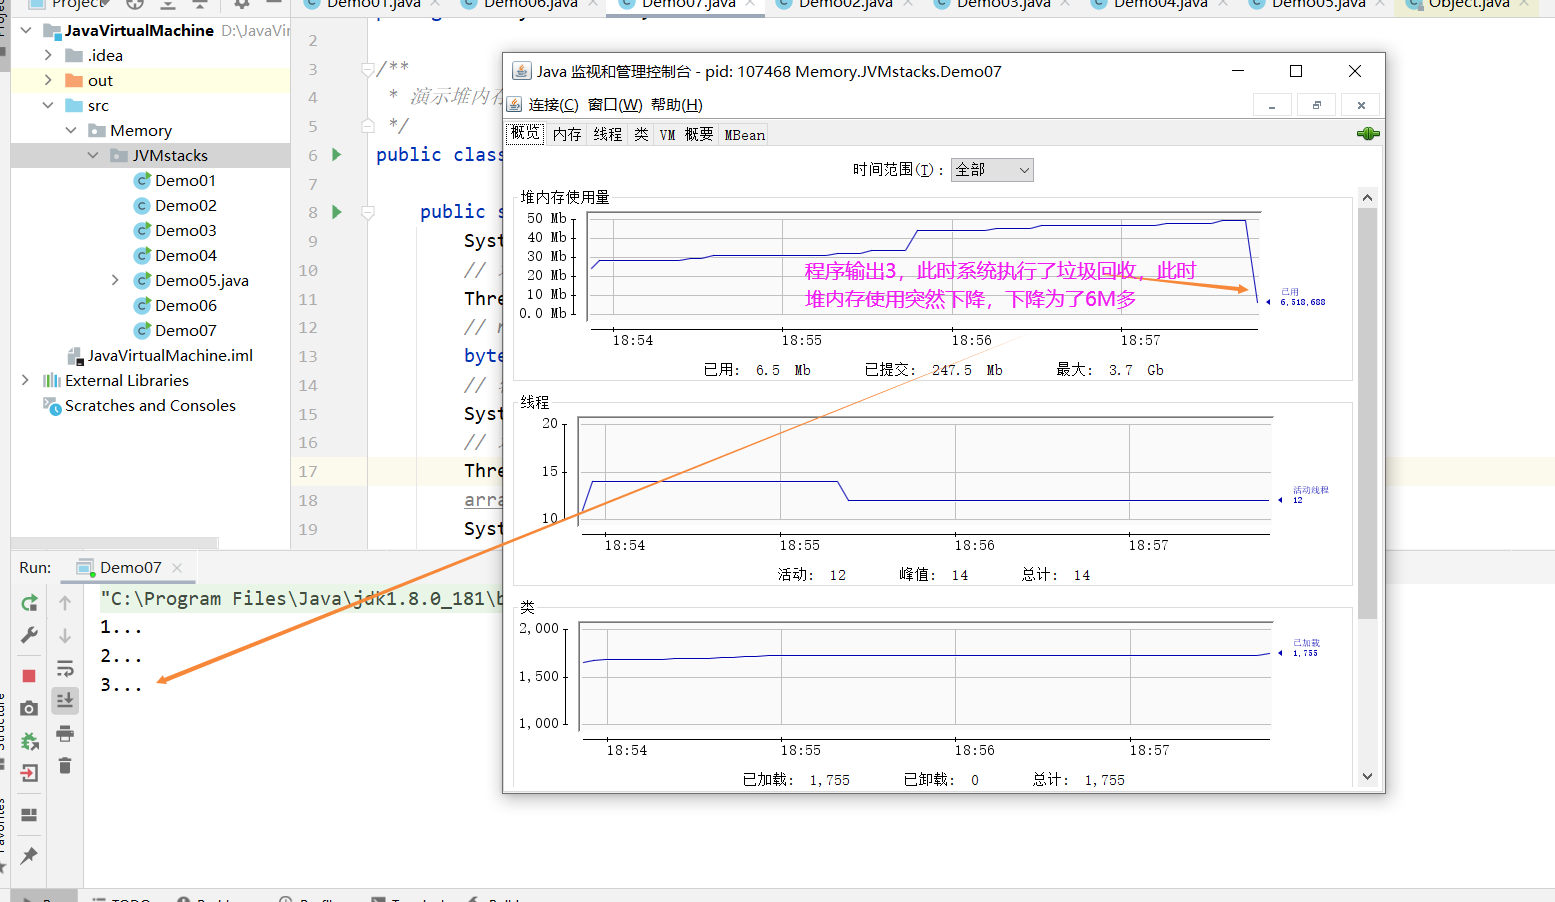
Finally, when the program output 3, the heap memory was more than 6M, we had already done garbage collection, and at this time, because the array reference was empty, the array was also recycled as garbage.
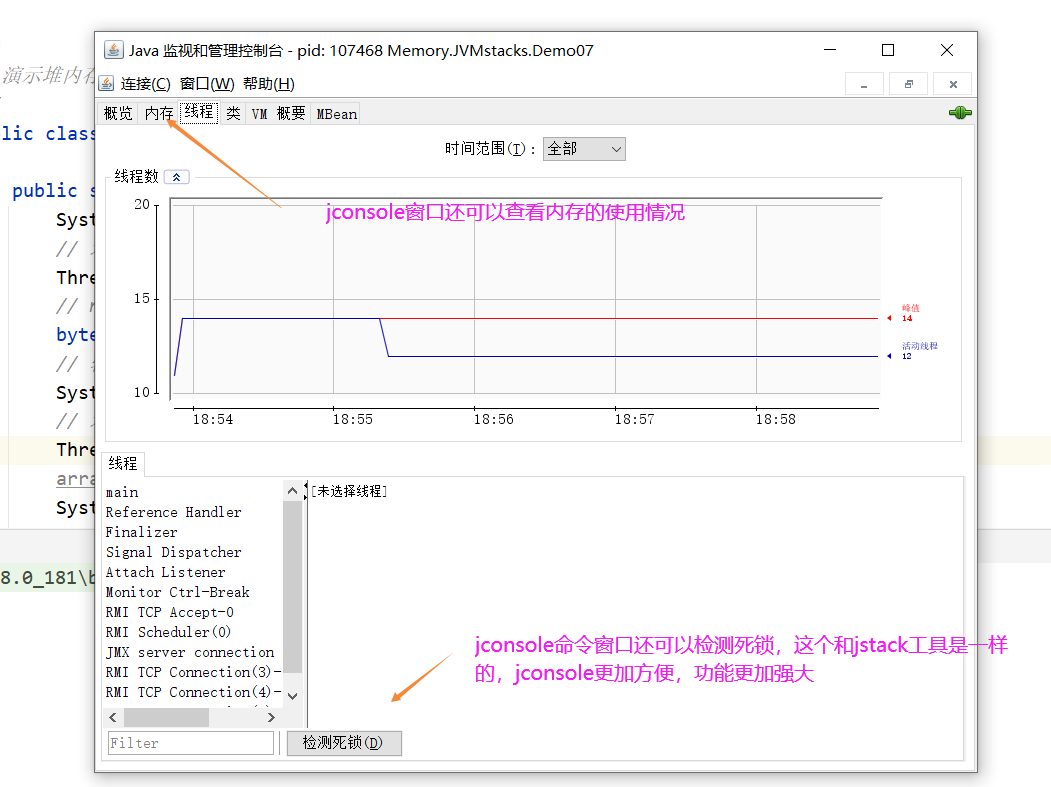
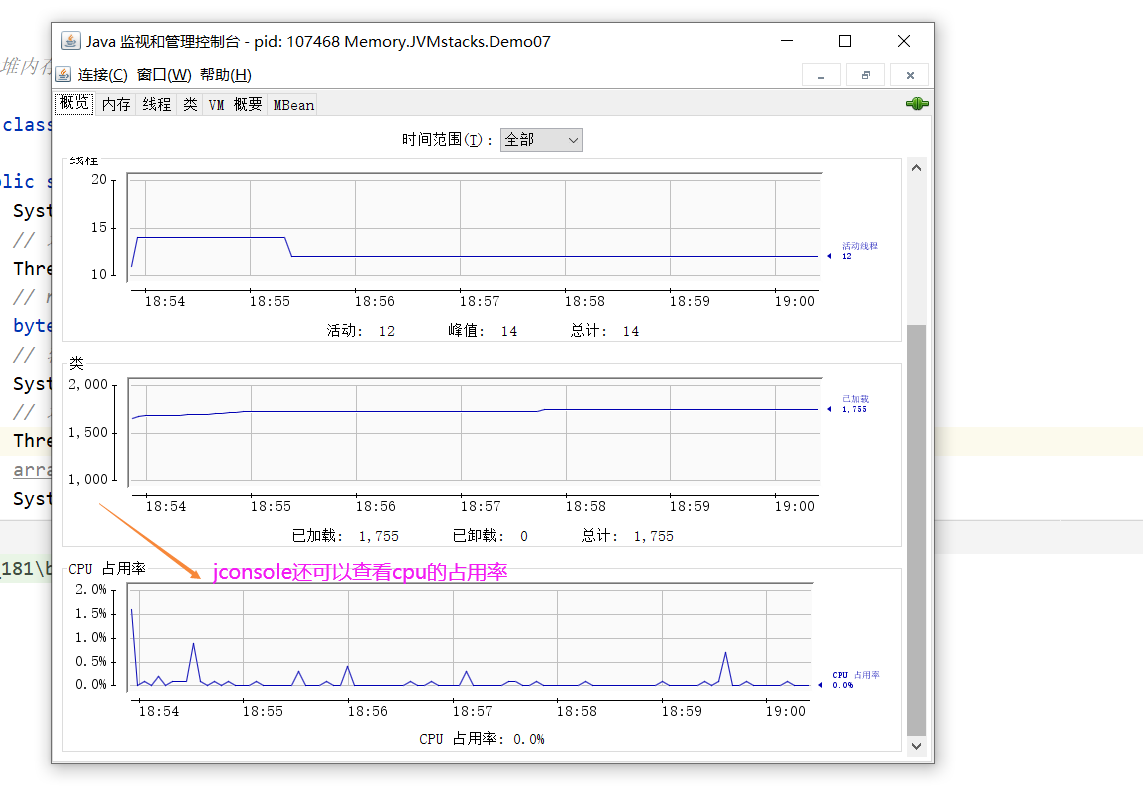
In addition, the jconsole window can view memory usage and cpu usage
Next, let's introduce another case to learn jvisualvm
case
- Memory usage remains high after garbage collection
Let's run the following program
import java.util.ArrayList;
import java.util.List;
/**
* Demonstrate viewing the number of objects heap dump dump (grab a memory snapshot)
*/
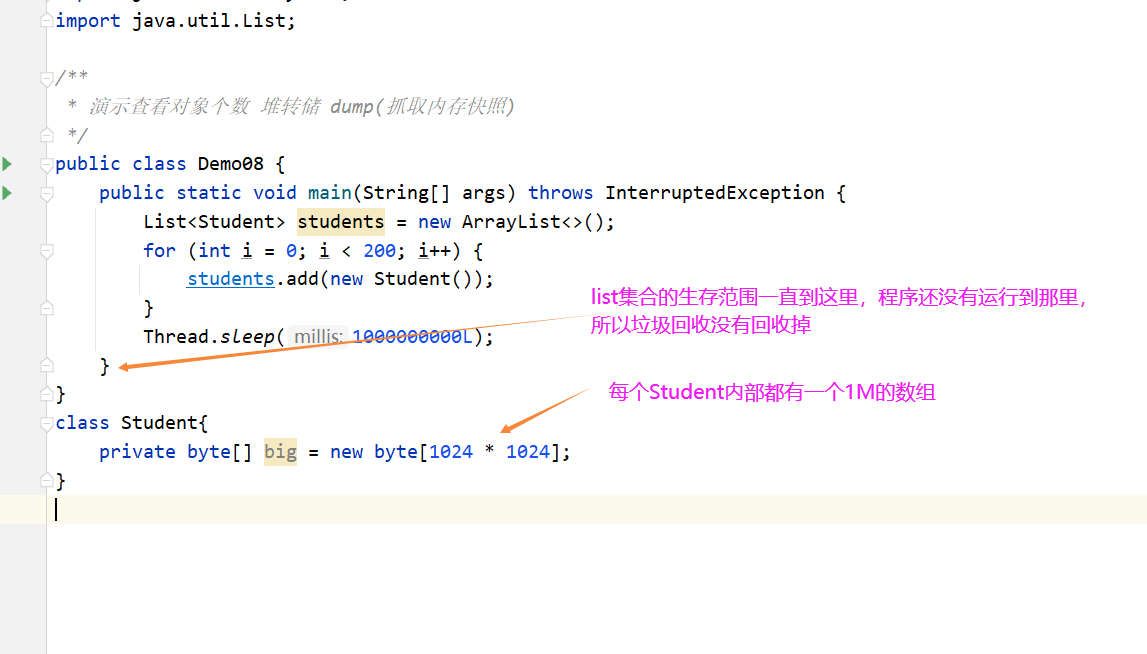
public class Demo08 {
public static void main(String[] args) throws InterruptedException {
List<Student> students = new ArrayList<>();
for (int i = 0; i < 200; i++) {
students.add(new Student());
}
Thread.sleep(1000000000L);
}
}
class Student{
private byte[] big = new byte[1024 * 1024];
}
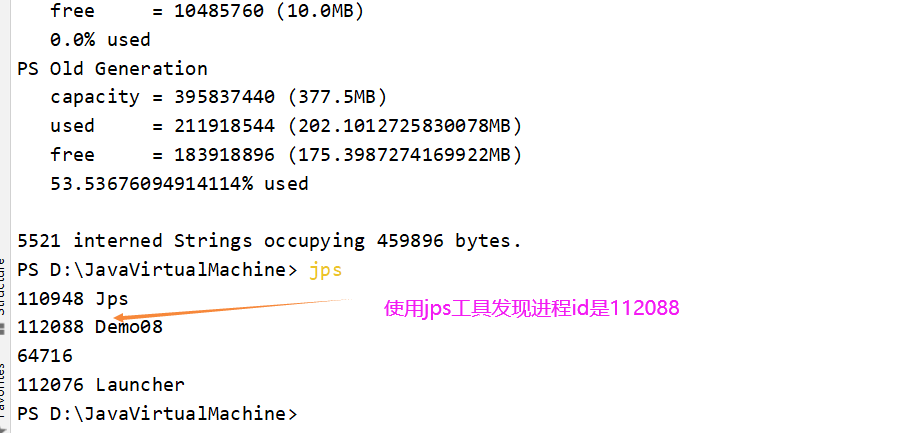
First we look at the process id through the jps tool. From the following figure we can see that the process id is 11288
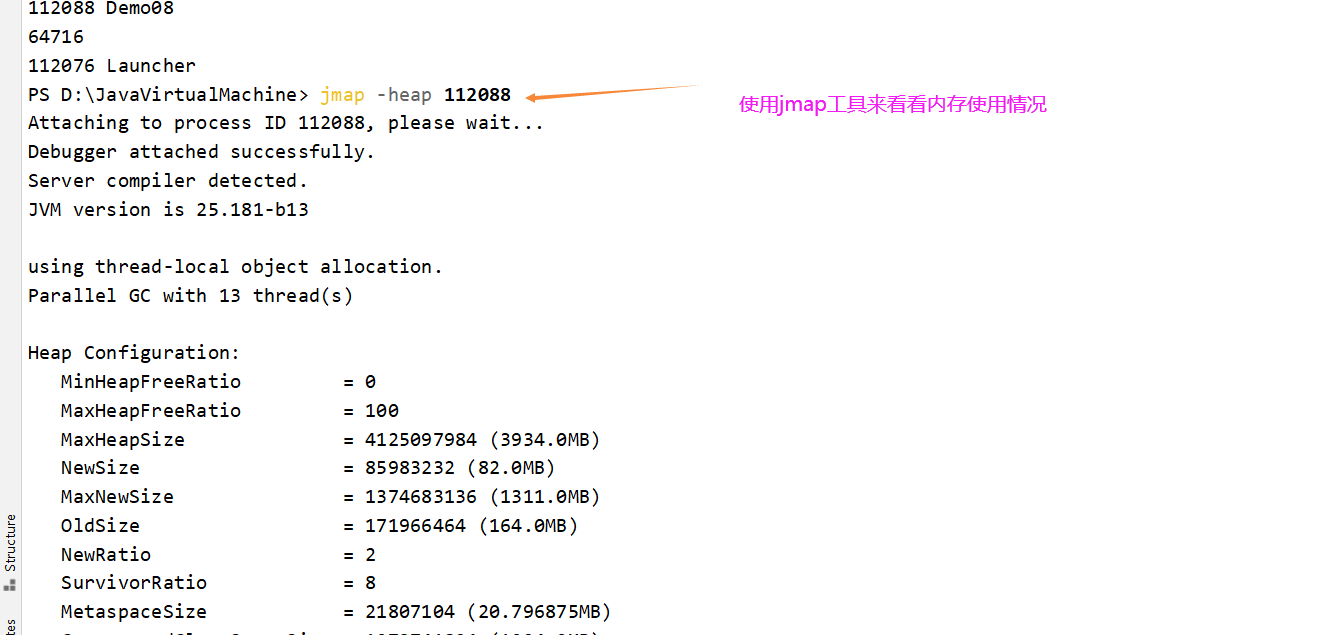
Use jmap-heap 112088 to see this thread's memory usage
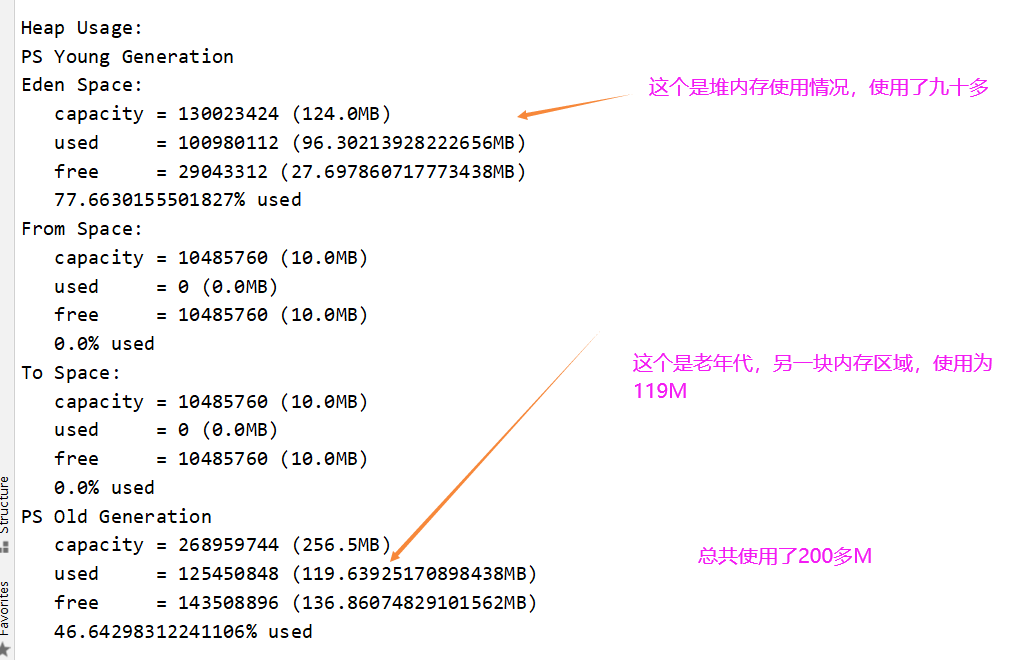
We can see that a total of over 200 M M of memory was used
Next let's do a garbage collection using jconsole
jconsole The use of tools has already passed before, if you forget, you can turn over the previous knowledge.
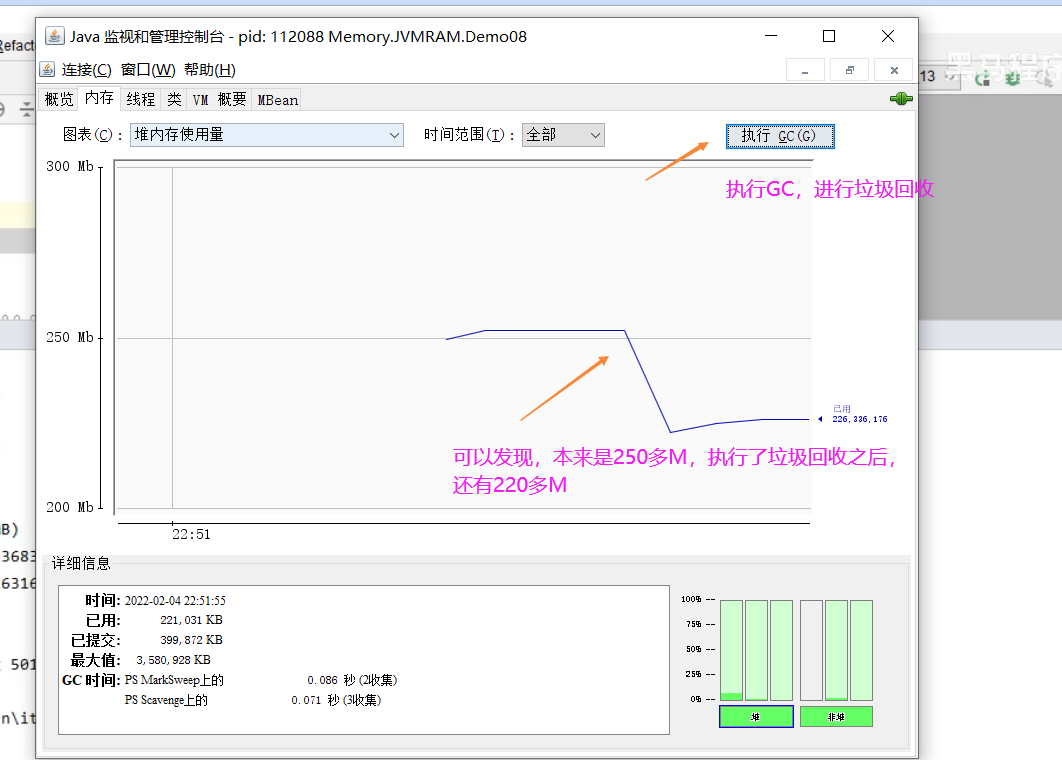
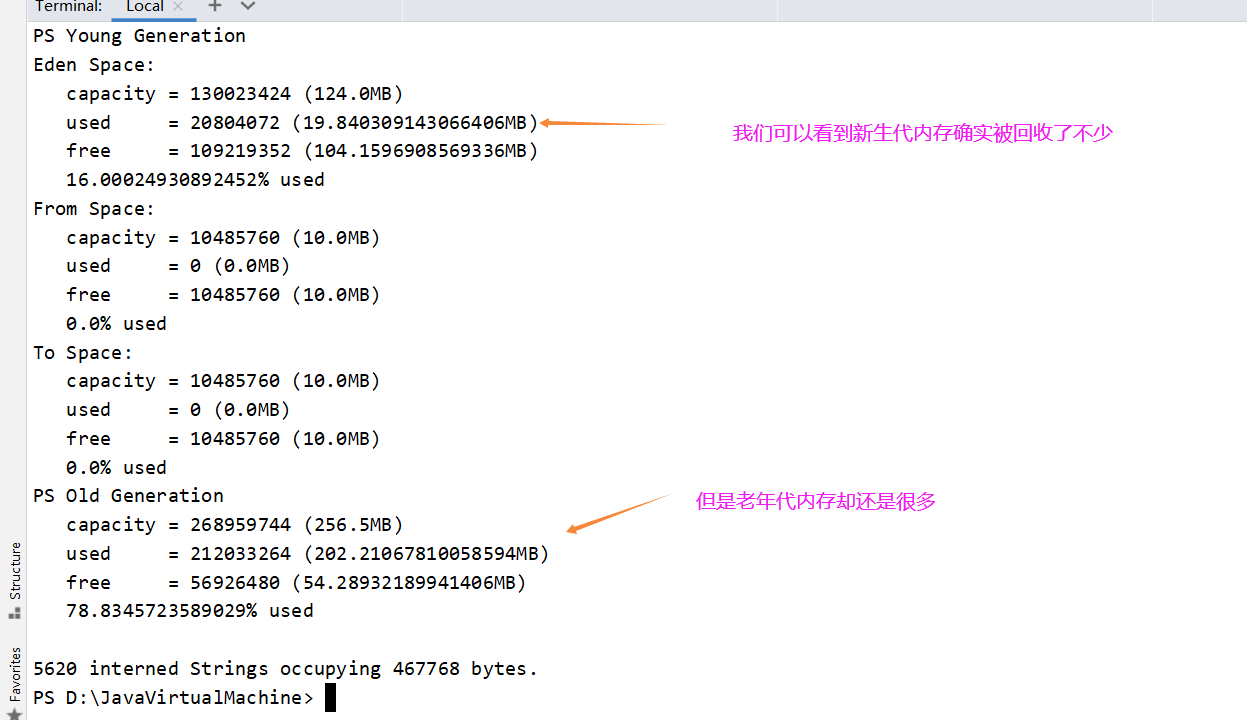
Now let's look at memory usage again with the jmap tool, and we can see that the new generation does have a lot of memory recycled, but the older generation does have a lot
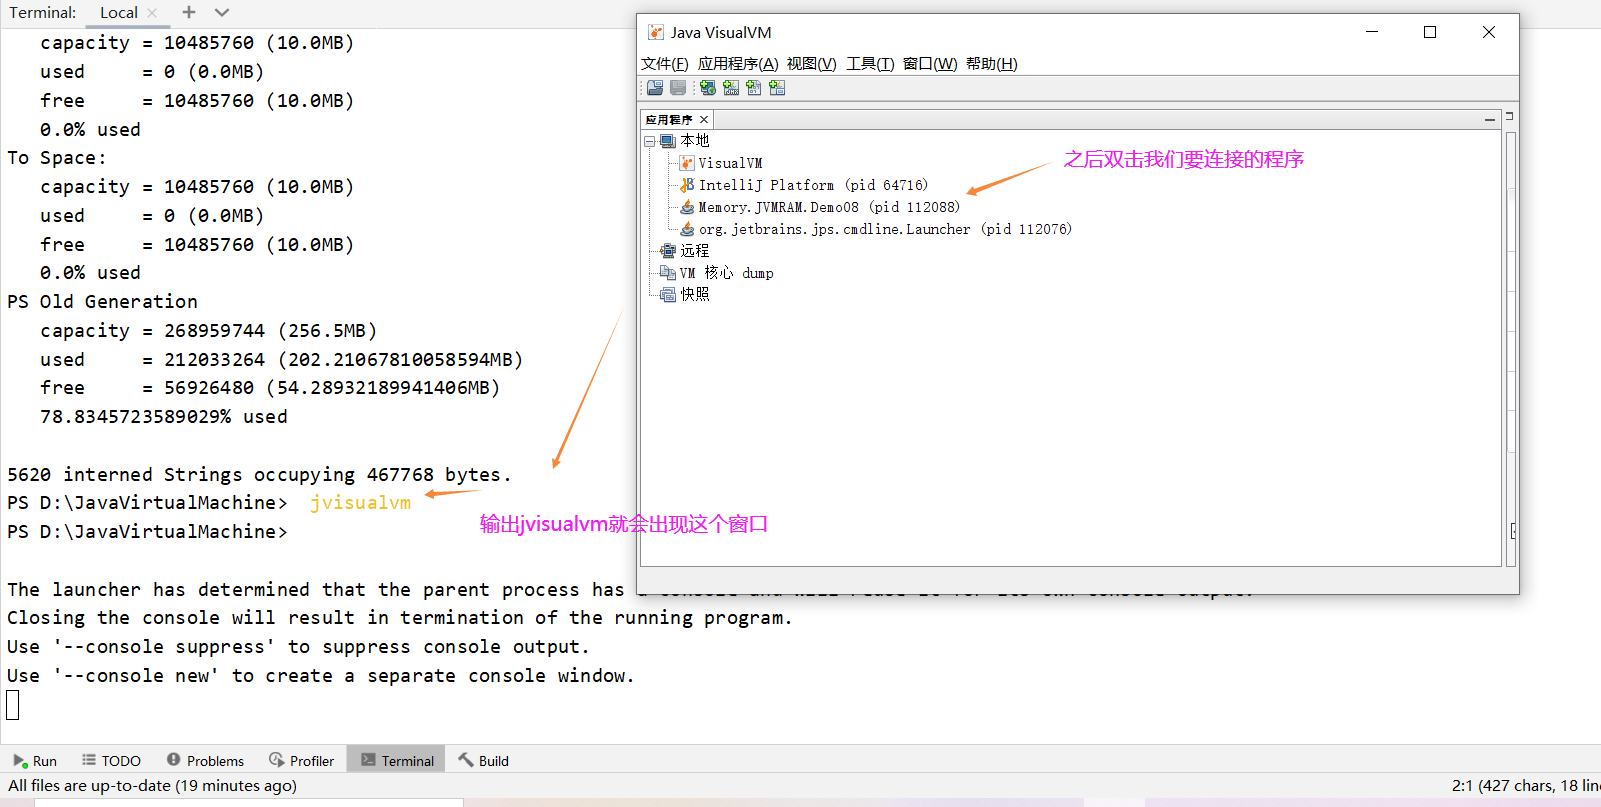
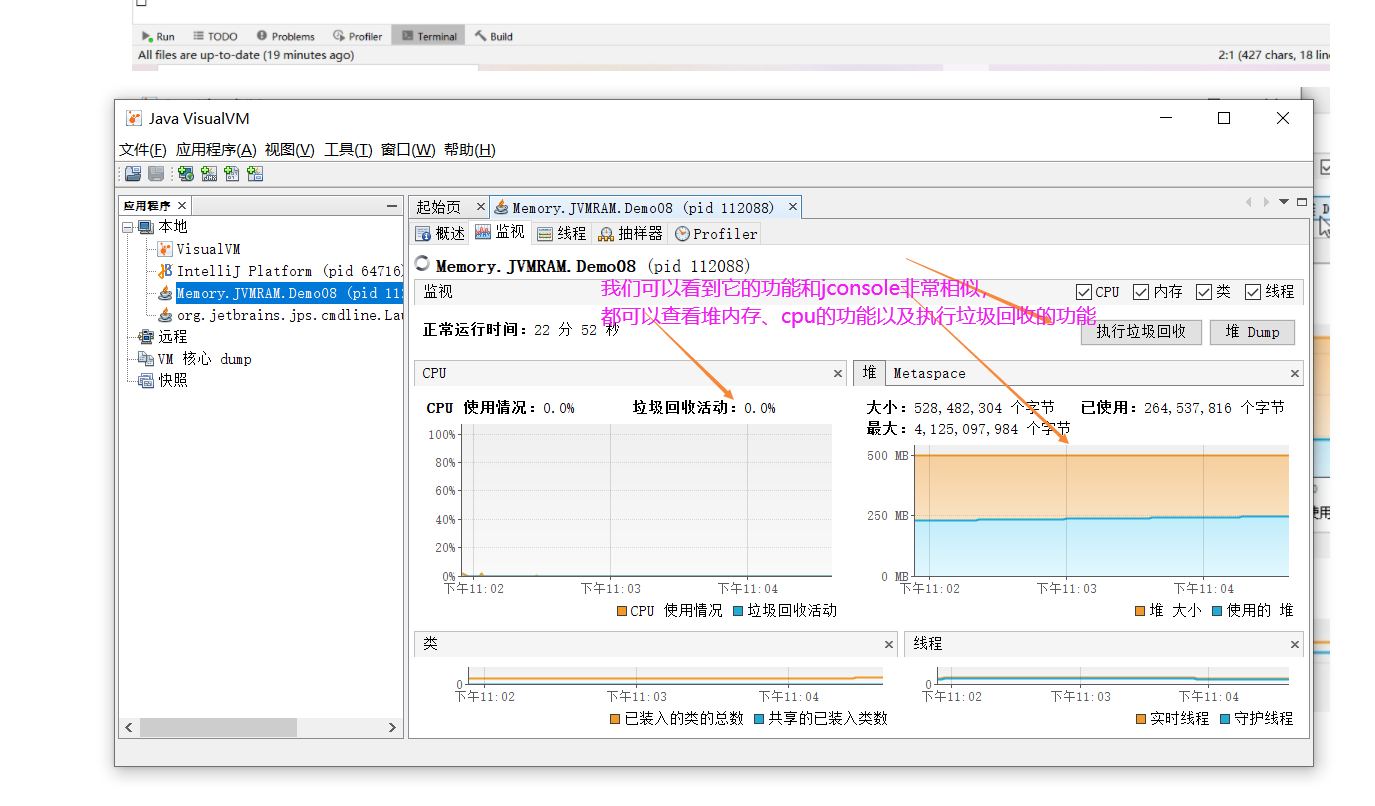
We're wondering why memory hasn't been recycled. Are some objects referenced all the time because of our programming mistake and can't be freed? Next, we'll introduce a tool, jvisualvm, which means to visualize the contents of a virtual machine.
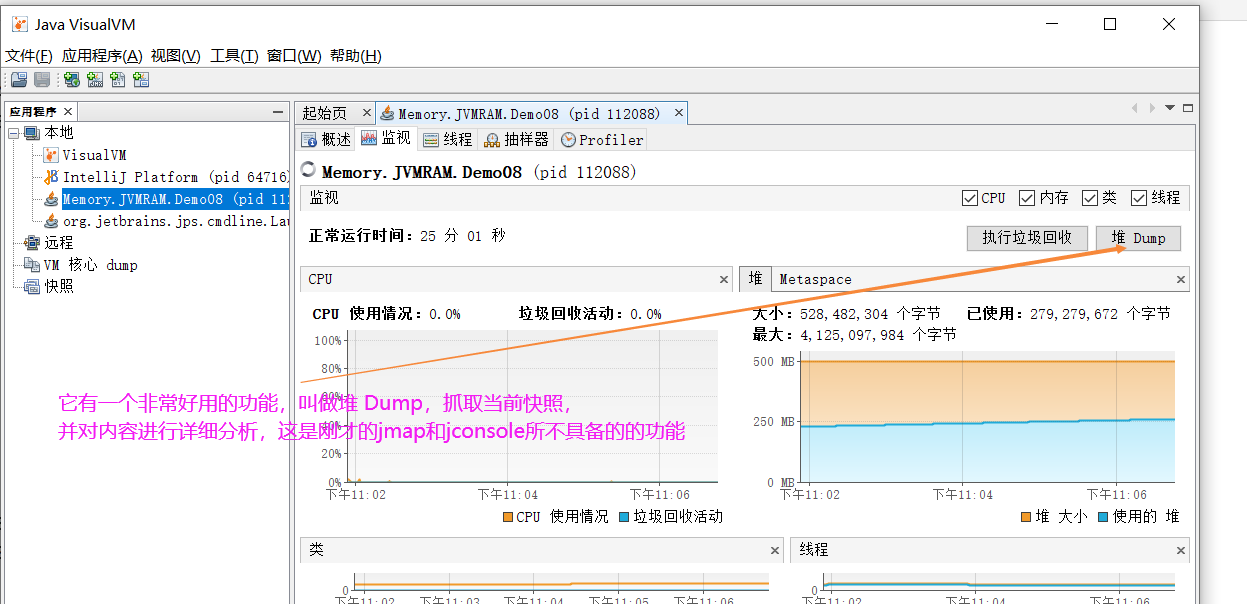
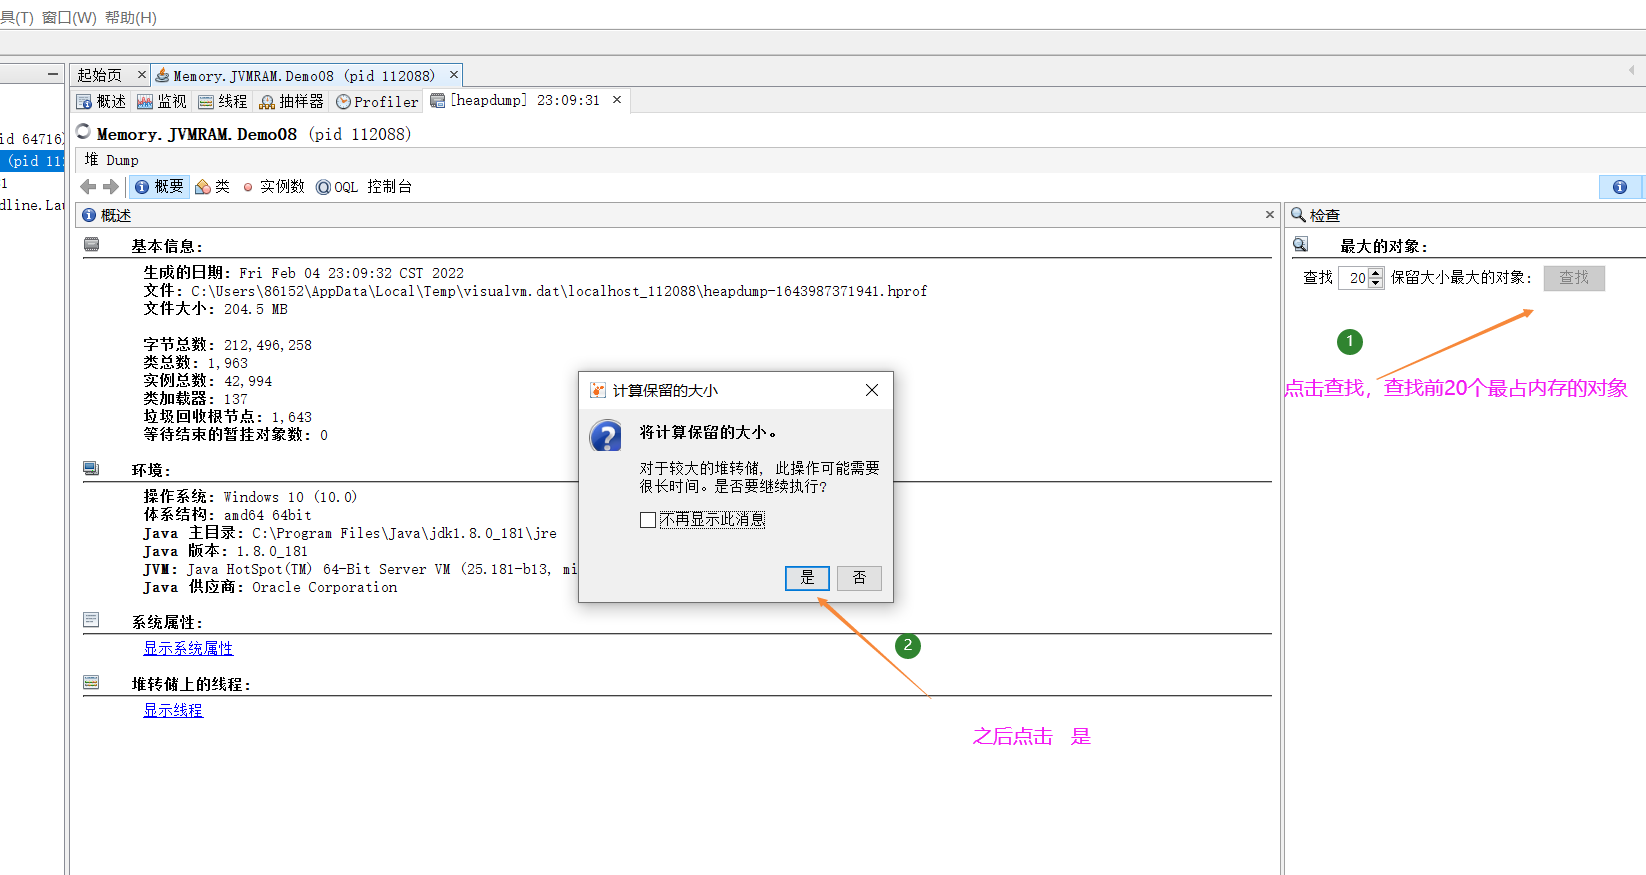
We then used the heap Dump feature, which is a snapshot of the current state and a detailed analysis of its contents, which is not a feature of jmap and jconsole
Then we looked for the top 20 most memory-consuming objects
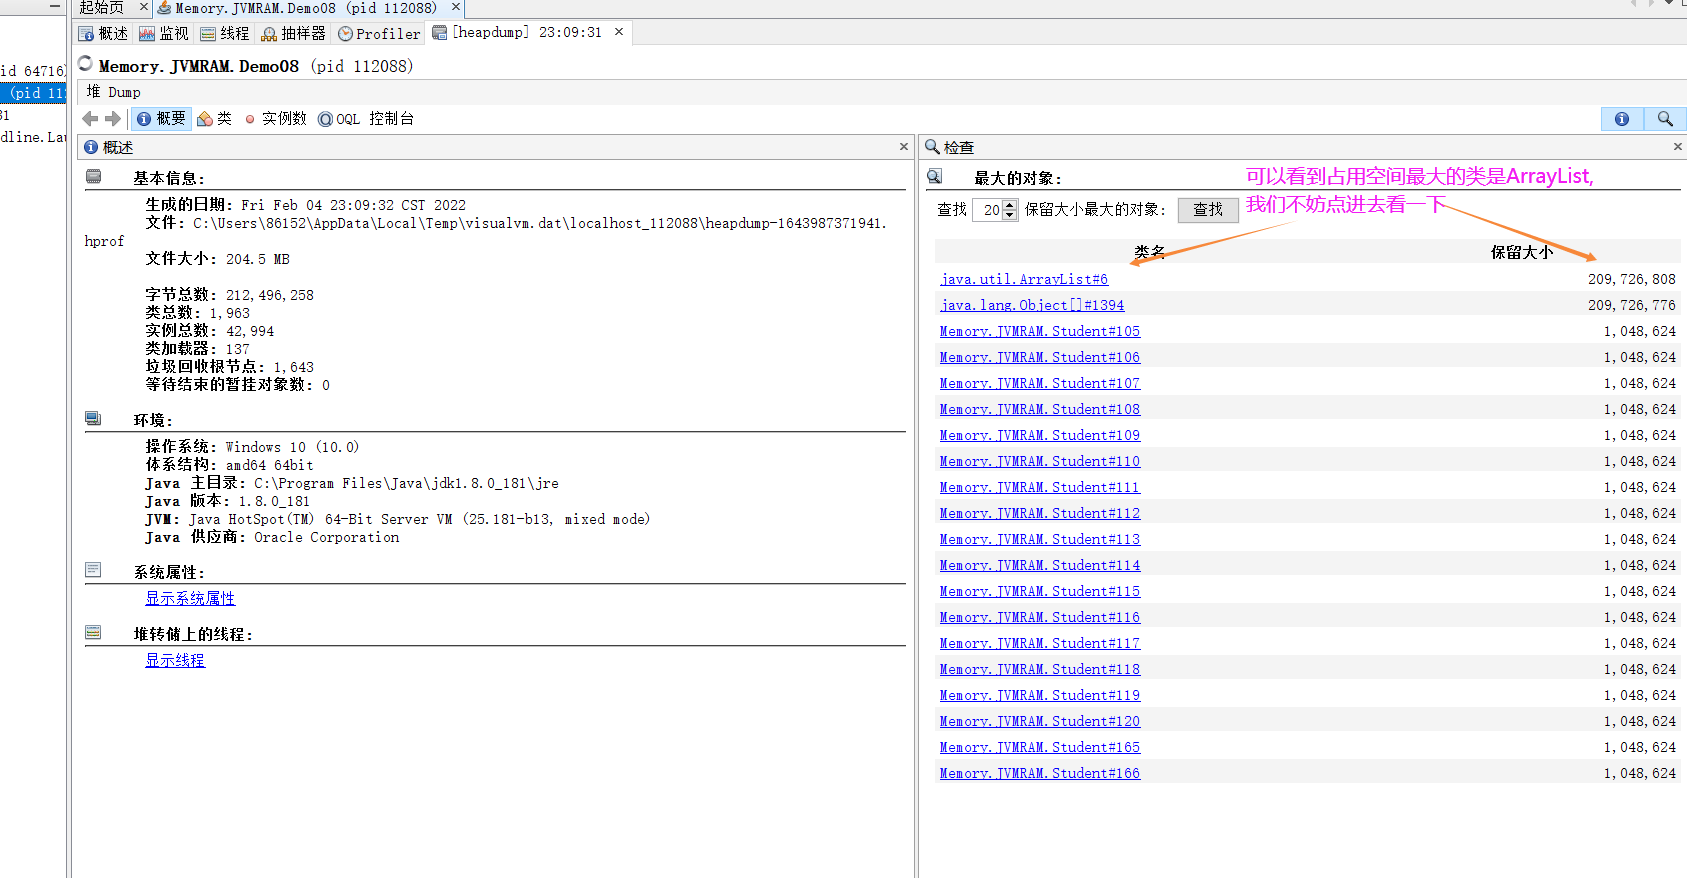
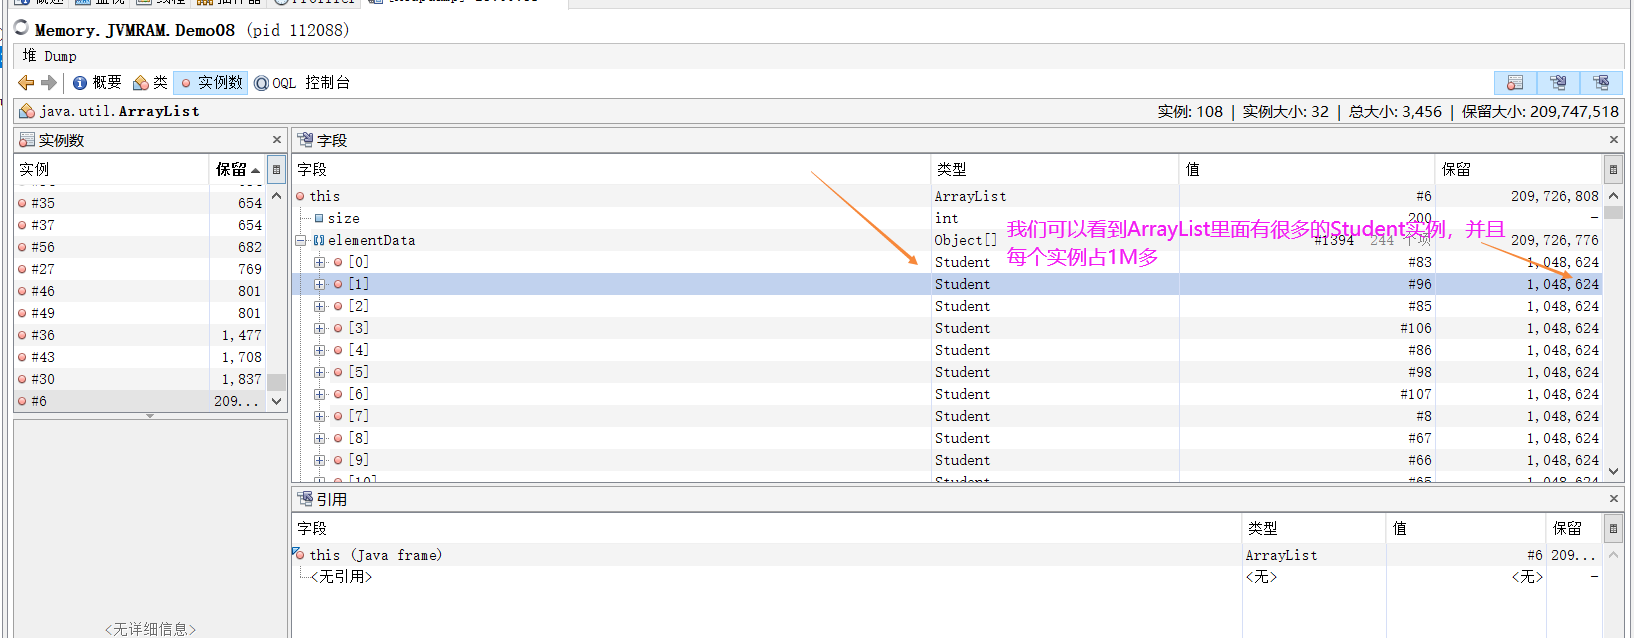
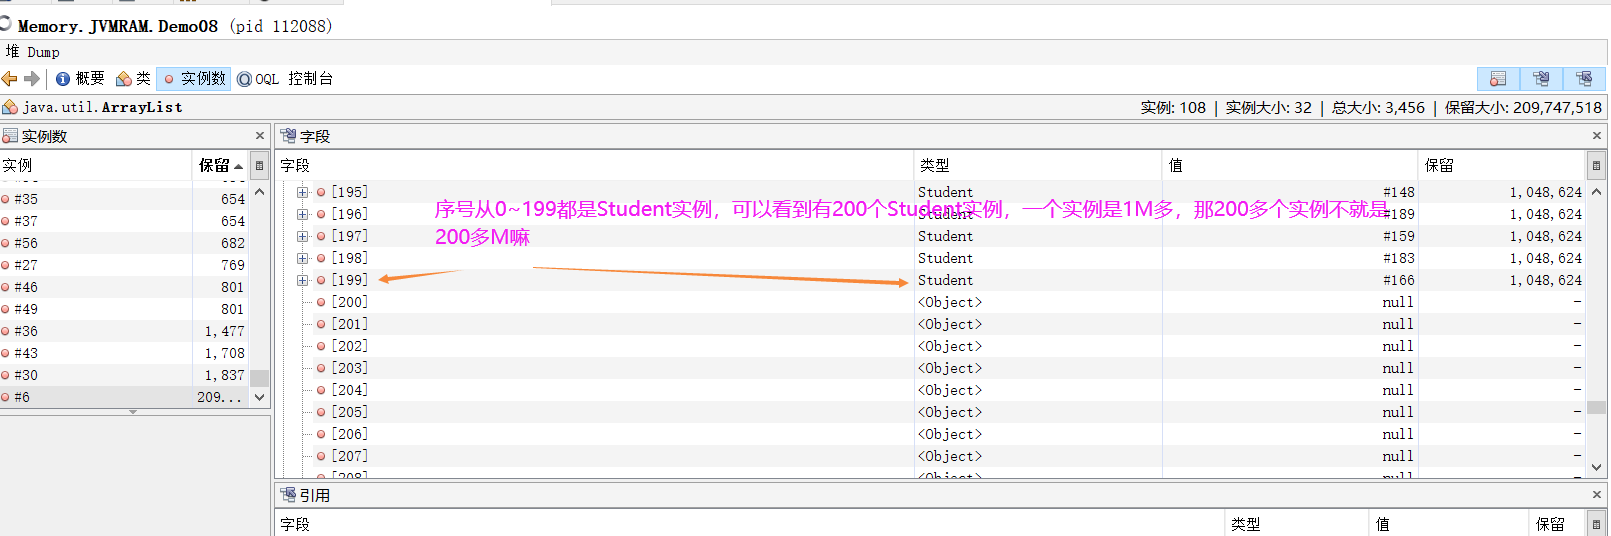
And these Student instances must be long-term, causing our garbage collection to fail to recycle
Next let's look at the java source code
Analysis and sorting are similar in real-world environments, so let's start with the heap Dump This feature grabs a snapshot of the memory and then we analyze the objects that use the most memory.
You can draw useful conclusions about which objects are taking up too much memory, then you can analyze and troubleshoot your original code.