1, Introduction Loki is a horizontally scalable and highly available multi tenant log aggregation system inspired by Prometheus and open source by the Grafana Labs team. Development language: Google Go. Its design is cost-effective and easy to operate. Tags are used as indexes instead of full-text retrieval, that is, you can query both log contents and monitored data tags through these tags, which greatly reduces the storage of log indexes. The system architecture is very simple and consists of the following three parts:
Loki is the master server, which is responsible for storing logs and processing queries. Prommail is the agent responsible for collecting logs and sending them to loki. Grafana is used for UI presentation.
As long as you install prommail on the application server to collect logs and send them to Loki storage, you can query logs by adding Loki as a data source in the Grafana UI interface (if the performance of Loki server is not enough, you can deploy multiple Loki for storage and query). As a log system, it not only has the ability to query and analyze logs, but also can monitor and alarm logs.

Loki document URL: https://grafana.com/docs/loki/latest/
Download website: https://github.com/grafana/loki/releases
2, Principle analysis Prommail collects and sends logs to loki's Distributor component The Distributor will verify the correctness of the received log stream and send the verified logs to Ingester in batches and parallel Ingester accepts the log stream and builds data blocks, which are compressed and stored in the connected storage backend The Querier receives the HTTP query request and sends the request to Ingester to obtain the memory data. After receiving the request, Ingester returns the qualified data; If the Ingester does not return data, the query will load the data from the back-end storage, traverse to re execute the query, and return the query result through HTTP
3, Comparative advantages with ELK Although ELK has rich functions, it has complex scale, high resource occupation and difficult operation. Many functions are often unavailable. It feels like killing chickens with an ox knife. Loki does not full-text index logs. By storing compressed unstructured logs and indexing metadata, Loki operation will be simpler and cost-effective. The log is indexed and grouped by using the same label record stream as Prometheus, which makes the log expansion and operation more efficient. Installation and deployment are simple and fast, and are supported by Grafana native.
4, Download (this version is available)
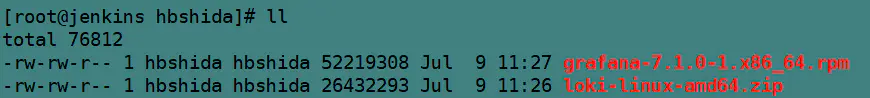
curl -O -L "https://github.com/grafana/loki/releases/download/v1.5.0/loki-linux-amd64.zip"
curl -O -L "https://github.com/grafana/loki/releases/download/v1.5.0/promtail-linux-amd64.zip"
wget https://dl.grafana.com/oss/release/grafana-7.1.0-1.x86_64.rpm
5, Installing loki and grafana
First, loki-linux-amd64 Zip and grafana-7.1.0-1 x86_ Upload 64.rpm to the log server; one hundred and ninety-three Then add prommail-linux-amd64 Zip upload to application server 158-178 Create directory on log server
mkdir  /datamkdir  /data/loki
mkdir  /data/loki/{chunks,index}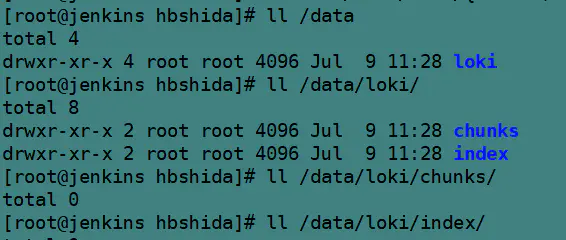
mkdir /usr/local/loki
unzip loki-linux-amd64.zip
mv loki-linux-amd64 /usr/local/loki/
cd /usr/local/loki/
vim config.yaml
-------------------------
auth_enabled: false
server:
http_listen_port: 3100
ingester:
lifecycler:
address: 10.24.70.193
ring:
kvstore:
store: inmemory
replication_factor: 1
final_sleep: 0s
chunk_idle_period: 5m
chunk_retain_period: 30s
schema_config:
configs:
- from: 2021-07-01
store: boltdb
object_store: filesystem
schema: v11
index:
prefix: index_
period: 168h #The time range of each table is 7 days
storage_config:
boltdb:
directory: /data/loki/index #Index file storage address
filesystem:
directory: /data/loki/chunks #Block storage address
limits_config:
enforce_metric_name: false
reject_old_samples: true
reject_old_samples_max_age: 168h
chunk_store_config:
# The maximum query history date is 28 days, which must be schema_ The multiple of period in config, otherwise an error is reported.
max_look_back_period: 672h
# The retention period of the table is 28 days
table_manager:
retention_deletes_enabled: true
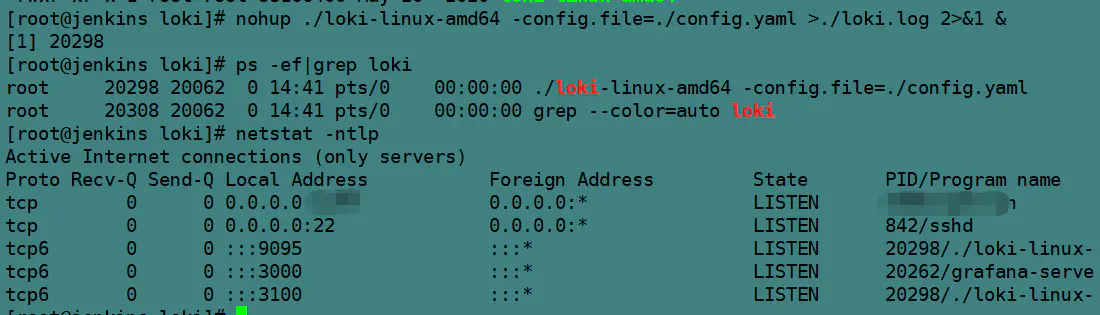
retention_period: 672hStart loki
nohup ./loki-linux-amd64 -config.file=./config.yaml >./loki.log 2>&1 &
Installing grafana
rpm -ivh ./grafana-7.1.0-1.x86_64.rpm
report errors:
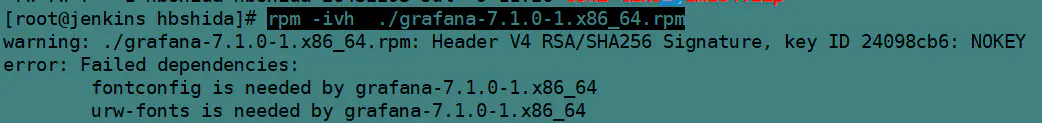
yum install fontconfig urw-fonts -y
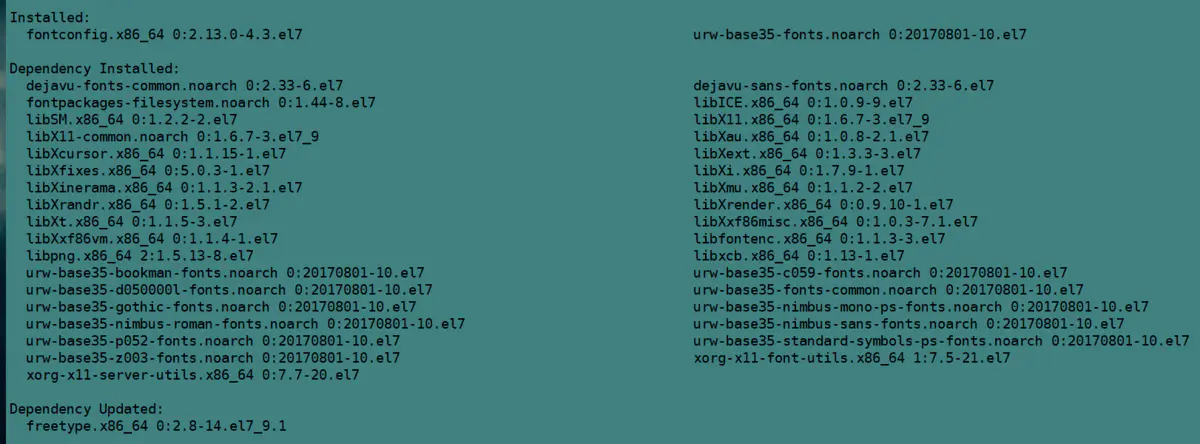
Installed version: fontconfig.x86_64 0:2.13.0-4.3.el7 urw-base35-fonts.noarch 0:20170801-10.el7
rpm -ivh ./grafana-7.1.0-1.x86_64.rpm
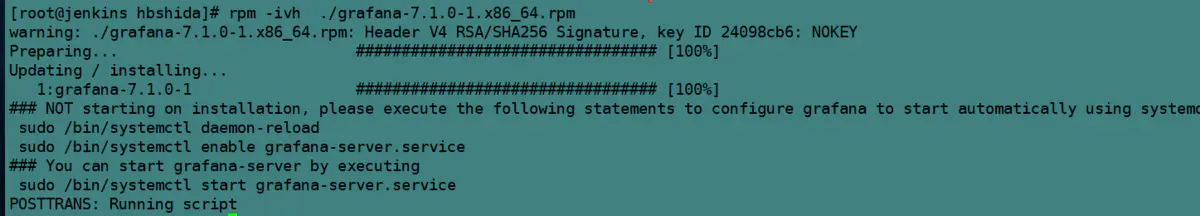
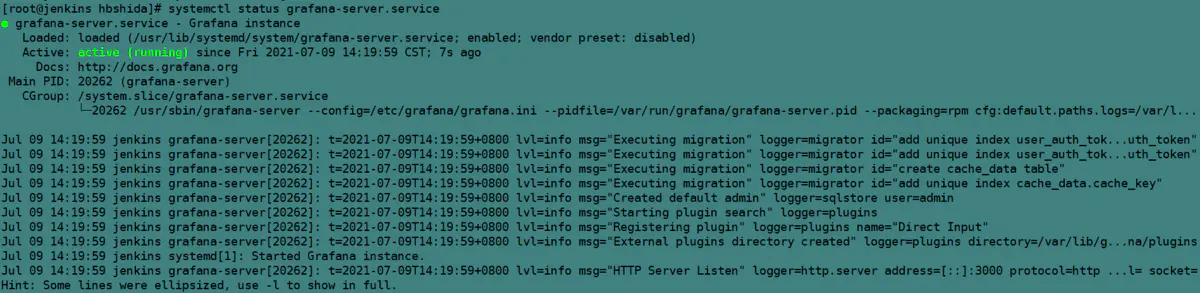
systemctl daemon-reload
systemctl enable grafana-server.service
systemctl start grafana-server.service
systemctl status grafana-server.service

Install prommail on the application server
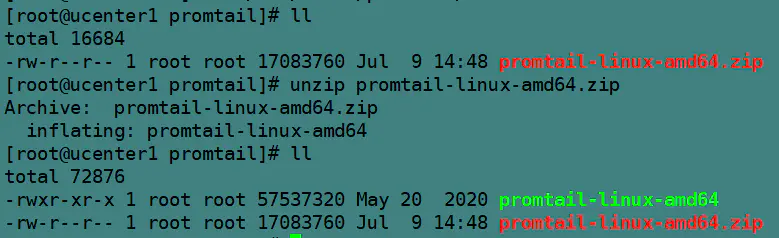
Application server 158, upload prommail-linux-amd64 Zip and unzip
mkdir /usr/local/promtail
unzip promtail-linux-amd64.zip
vim promtail.yaml
------------------------
server:
  http_listen_port: 9080
  grpc_listen_port: 0

positions:
  filename: ./positions.yaml

clients:
  - url: http://10.24.70.193:3100/loki/api/v1/push

scrape_configs:
#ucenter1
 - job_name: ucenter1
   static_configs:
   - targets:
       - 10.24.70.158
   - labels:
      job: ucenter1
      host: 10.24.70.158
      __path__: /usr/local/tomcat/logs/user-center/log_error.log
start-up
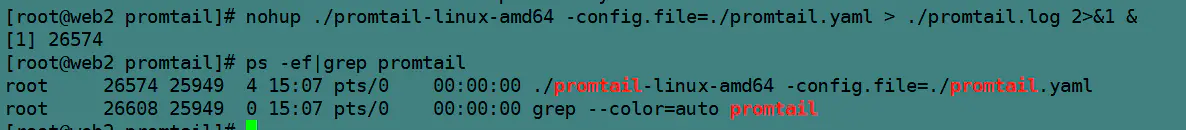
nohup ./promtail-linux-amd64 -config.file=./promtail.yaml > ./promtail.log 2>&1&
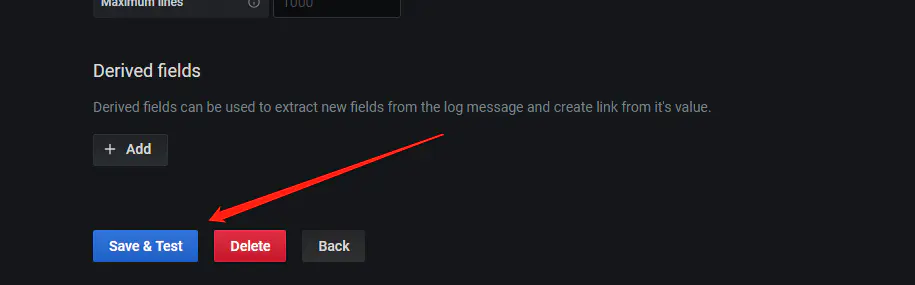
Finally, configure the default account admin password admin on grafana

http://172.26.189.214:3100 This address is the address of the server that started loki before, port 3100


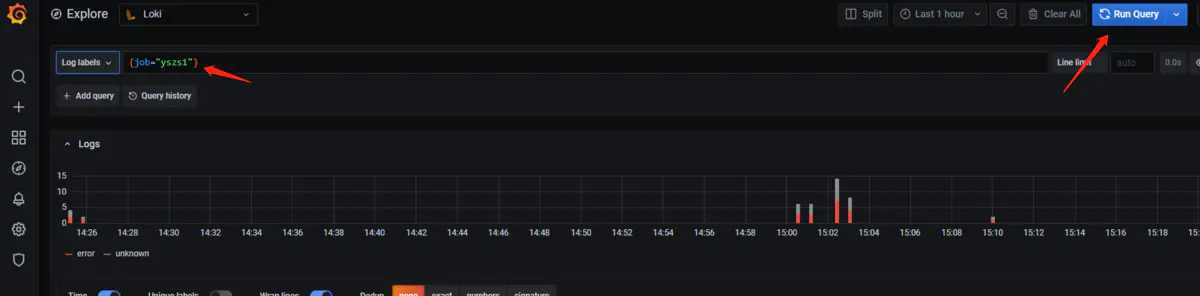
{job="yszs1"}
And prommail job: yszs1 in yaml configuration file corresponds to.
#yszs
 - job_name: yszs1
   static_configs:
   - targets:
       - 8.142.0.103
   - labels:
      job: yszs1
      host: 8.142.0.103
      __path__: /var/shida/logs/ys/log_error.log
5 others
Use of Variables variable of grafana
Introduction and use of Grafana
Use of label Introduction to the official website label
Secondary development of grafana
Goodbye, bulky ELK! This lightweight log collection scheme needs fire! https://mp.weixin.qq.com/s/lXm-Jm7ogCMtdeQBAOOO5g