1, Background introduction
Log management in the project is one of the basic functions. Different users and scenarios have specific requirements for logs, so different strategies need to be used for log collection and management. If it is a distributed project, the log system design is more complex.
- Log type: business operation, information printing, request link;
- Role requirements: R & D end, user end, service level and system level;
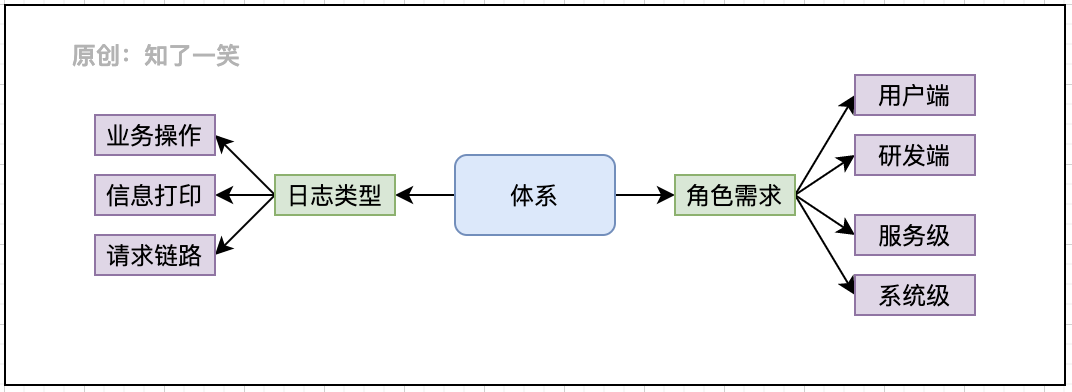
Users and requirements
- Client: addition, deletion and modification of core data, business operation log;
- R & D end: log collection and management strategy, abnormal log monitoring;
- Service level: Key log printing, problem discovery and troubleshooting;
- System level: link generation and monitoring system in distributed projects;
In different scenarios, different technical means need to be selected to realize log collection and management, such as log printing, operation record, ELK system, etc. pay attention to avoid abnormal program interruption caused by log management.
The more complex the system design and business scenario, the more dependent the log output information. In large-scale architecture, an independent log platform is usually built to provide a complete set of solutions such as log data collection, storage and analysis.
2, Slf4j assembly
1. Appearance mode
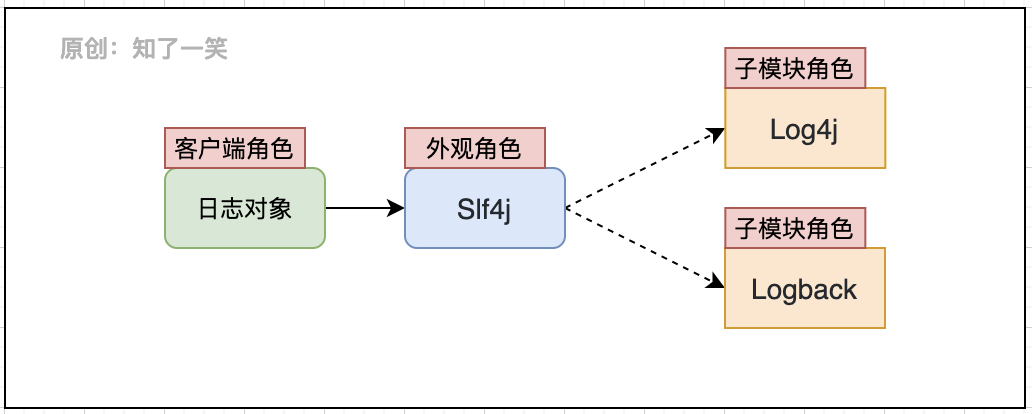
The components of the log comply with the appearance design mode. Slf4j, as the appearance object of the log system, defines the standard of standardizing the log, and the specific implementation of the log capability is implemented by each sub module; Slf4j defines the loading method and function interface of log object, interacts with the client and provides log management function;
private static final org.slf4j.Logger logger = org.slf4j.LoggerFactory.getLogger(Impl.class) ;
Generally, it is forbidden to directly use the API of specific implementation components such as Logback and Log4j, so as to avoid unnecessary trouble caused by component replacement and achieve unified maintenance of logs.
2. SPI interface
From the interaction between Slf4j and Logback components, in the process of using logs, the basic entry point is to use the interface of Slf4j to identify and load the specific implementation in Logback; The interface specification defined by SPI is usually used as the implementation of third-party (external) components.
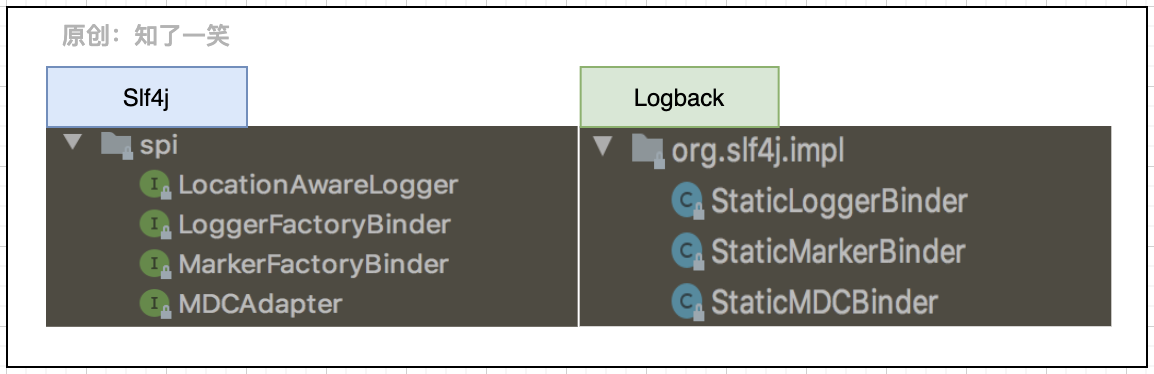
As the connection point of the two sets of components, the above SPI can roughly look at the loading process through the source code and trace the source code of LoggerFactory:
public final class org.slf4j.LoggerFactory {
    private final static void performInitialization() {
        bind();
    }
    private final static void bind() {
        try {
            StaticLoggerBinder.getSingleton();
        } catch (NoClassDefFoundError ncde) {
            String msg = ncde.getMessage();
            if (messageContainsOrgSlf4jImplStaticLoggerBinder(msg)) {
                Util.report("Failed to load class \"org.slf4j.impl.StaticLoggerBinder\".");
            }
        }
    }
}
Only a few lines of schematic source code are pasted here. When initializing binding Association in LoggerFactory, if no specific log implementation component is found, the corresponding exception information will be reported, and system. Com will be used Err output error prompt.
3, Custom components
1. Functional packaging
For log (or other) common functions, independent code packages are usually encapsulated in code engineering as public dependencies for unified management and maintenance. For custom packaging of logs, please refer to the previous documents, which usually involves several core points:
- Starter loading: the package is configured as a starter component, which can be scanned and loaded by the framework;
- aop aspect programming: usually add log annotations to relevant methods to automatically record actions;
- annotation: define the core parameters and processing logic that need to be marked for logging;
As for how to assemble log content, adapt business semantics, and follow-up management processes, you can design corresponding strategies according to specific scenarios, such as how to store logs, whether to analyze them in real time, whether to execute them asynchronously, etc.
2. Object parsing
In the user-defined annotation, the problem of object resolution will be involved, that is, putting the attributes to be resolved from the object in the annotation and splicing the values into the log content can enhance the semantic readability of the business log.
import org.springframework.expression.Expression;
import org.springframework.expression.spel.standard.SpelExpressionParser;
public class Test {
public static void main(String[] args) {
// Map collection
HashMap<string,object> infoMap = new HashMap<>() ;
infoMap.put("info","Map Description of") ;
// List collection
ArrayList<object> arrayList = new ArrayList<>() ;
arrayList.add("List-00");
arrayList.add("List-01");
// User object
People oldUser = new People("Wang",infoMap,arrayList) ;
People newUser = new People("LiSi",infoMap,arrayList) ;
// Packaging object
WrapObj wrapObj = new WrapObj("WrapObject",oldUser,newUser) ;
// Object attribute resolution
SpelExpressionParser parser = new SpelExpressionParser();
// objName
Expression objNameExp = parser.parseExpression("#root.objName");
System.out.println(objNameExp.getValue(wrapObj));
// oldUser
Expression oldUserExp = parser.parseExpression("#root.oldUser");
System.out.println(oldUserExp.getValue(wrapObj));
// newUser.userName
Expression userNameExp = parser.parseExpression("#root.newUser.userName");
System.out.println(userNameExp.getValue(wrapObj));
// newUser.hashMap[info]
Expression ageMapExp = parser.parseExpression("#root.newUser.hashMap[info]");
System.out.println(ageMapExp.getValue(wrapObj));
// oldUser.arrayList[1]
Expression arr02Exp = parser.parseExpression("#root.oldUser.arrayList[1]");
System.out.println(arr02Exp.getValue(wrapObj));
}
}
@Data
@AllArgsConstructor
class WrapObj {
private String objName ;
private People oldUser ;
private People newUser ;
}
@Data
@AllArgsConstructor
class People {
private String userName ;
private HashMap<string,object> hashMap ;
private ArrayList<object> arrayList ;
}
Note the SpelExpressionParser parser used above, that is, the native API of the spring framework; For many problems encountered in the business, it is suggested to find solutions from the core dependency (Spring+JDK) first, and spend more time getting familiar with the overall picture of the core components in the system, which will be of great help to the development vision and ideas.
3. Pattern design
Here's a more complex solution to user-defined logs. Identify log annotations through AOP patterns, analyze the object attributes to be recorded in the annotations, build corresponding log entities, and finally adapt different business strategies according to the scenarios marked by the annotations:
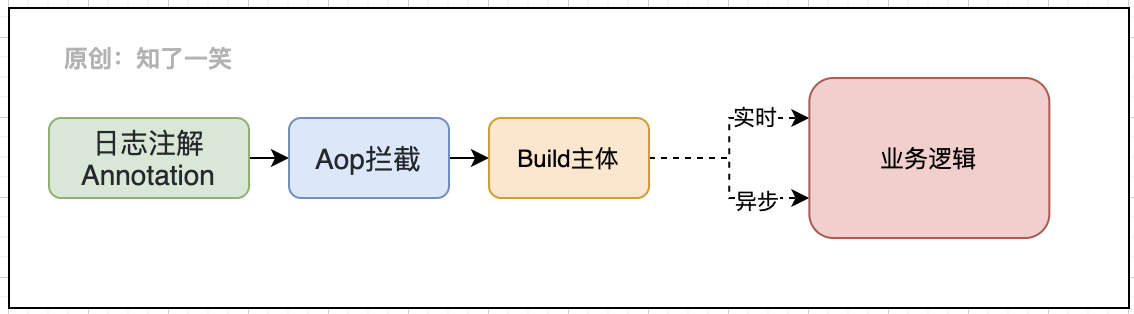
The higher the requirements for the versatility of functions, the more abstract the built-in adaptation strategy will be when packaging. When dealing with complex logical processes, we should be good at using different components together, which can share the pressure of business support and form a stable and reliable solution.
4, Distributed link
1. Link identification
The distributed system based on microservice implementation will process a request through multiple sub services. If an exception occurs to a service in the process, it is necessary to locate the request action to which the exception belongs, so as to better judge the cause of the exception and solve it again.
The positioning action depends on a core identification: TraceId - Track ID, that is, when the request flows through each service, it will carry the TraceId bound to the request, so as to identify which actions of different services are generated by the same request.
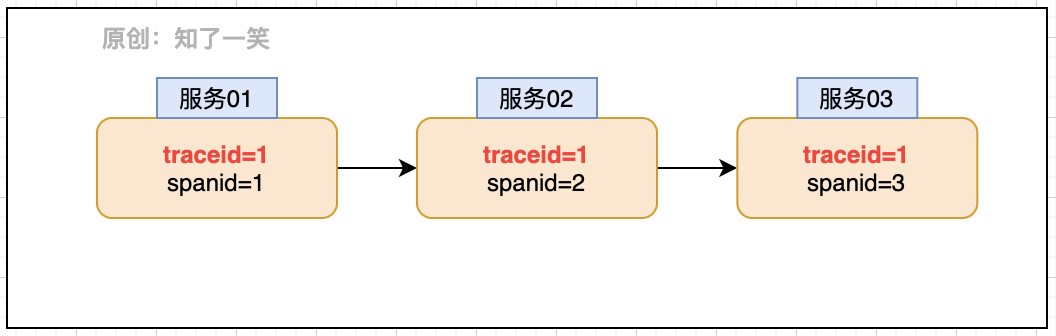
The requested link view can be restored through TraceId and SpanId, and the abnormal problem can be solved quickly in combination with relevant log printing records and other actions. In the microservice architecture, Sleuth component provides the support of this capability.
The core parameters of the link view can be integrated into the Slf4j component. Here, you can refer to org Slf4j. MDC syntax. MDC provides parameter transfer and mapping capabilities before and after logs, and the internal packaging Map container manages parameters; In the Logback component, the StaticMDCBinder provides the binding of this capability, so that the log print can also carry the identification of the link view to achieve the complete integration of this capability.
2. ELK system
The logs generated by link view are very large. How to manage and quickly query these document logs is also a key problem. A common solution, ELK system, has been updated to ElasticStack products.
- Kibana: you can use graphs and charts to visualize data in Elasticsearch;
- Elastic search: provide the ability of data storage, search and analysis engine;
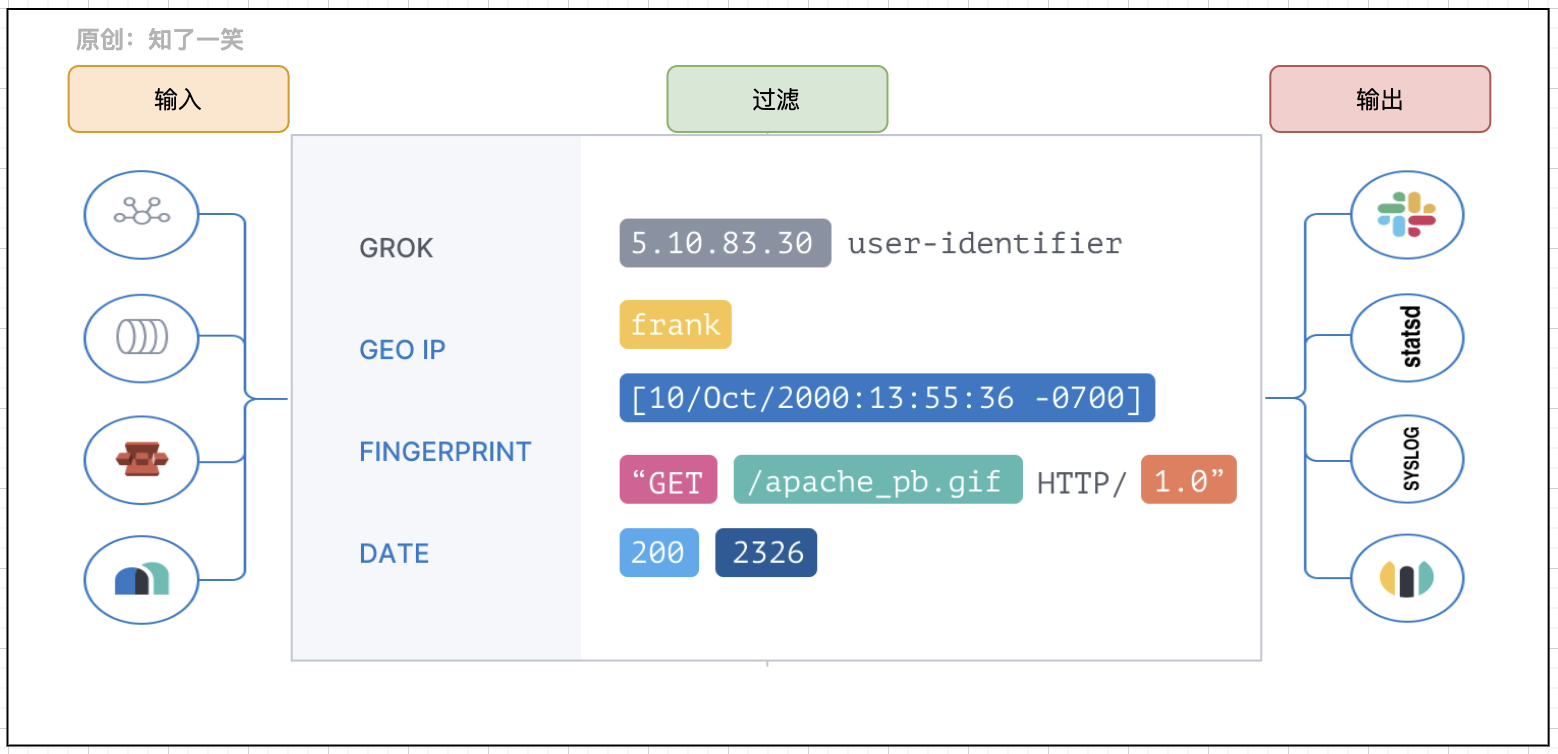
- Logstash: data processing pipeline, which can collect, convert and push data from multiple sources at the same time;
Logstash provides log collection and transmission capabilities. Elasticsearch stores a large number of log records in JSON format, and Kibana can display data in a visual manner.
3. Service and configuration
Configuration dependency: you need to configure Logstash address and port in the service, that is, log transmission address and service name;
spring:
  application:
    name: app_serve
logstash:
  destination:
    uri: Logstash-address
    port: Logstash-port
Configuration reading: load the above core parameters in the Logback component configuration, so that the parameter can be used through the value of name in the configuration context;
<springproperty scope="context" name="APP_NAME" source="spring.application.name" defaultValue="butte_app" />
<springproperty scope="context" name="DES_URI" source="logstash.destination.uri" />
<springproperty scope="context" name="DES_PORT" source="logstash.destination.port" />
Log transmission: configure the transmission content accordingly, and specify the LogStash service configuration, code, core parameters, etc;
<appender name="LogStash" class="net.logstash.logback.appender.LogstashTcpSocketAppender">
    <!-- Log transfer address -->
    <destination>${DES_URI:- }:${DES_PORT:- }</destination>
    <!-- Log transmission code -->
    <encoder class="net.logstash.logback.encoder.LoggingEventCompositeJsonEncoder">
        <providers>
            <timestamp>
                <timezone>UTC</timezone>
            </timestamp>
            <!-- Log transfer parameters -->
            <pattern>
                <pattern>
                    {
                    "severity": "%level",
                    "service": "${APP_NAME:-}",
                    "trace": "%X{X-B3-TraceId:-}",
                    "span": "%X{X-B3-SpanId:-}",
                    "exportable": "%X{X-Span-Export:-}",
                    "pid": "${PID:-}",
                    "thread": "%thread",
                    "class": "%logger{40}",
                    "rest": "%message"
                    }
                </pattern>
            </pattern>
        </providers>
    </encoder>
</appender>
Output format: you can also set the format of the log to manage the output content of the log file or console;
<pattern>%d{yyyy-MM-dd HH:mm:ss} %contextName [%thread] %-5level %logger{100} - %msg %n</pattern>
For other configurations of Logback component logs, such as output location, level, data transmission mode, etc., you can refer to the official documents for continuous optimization.
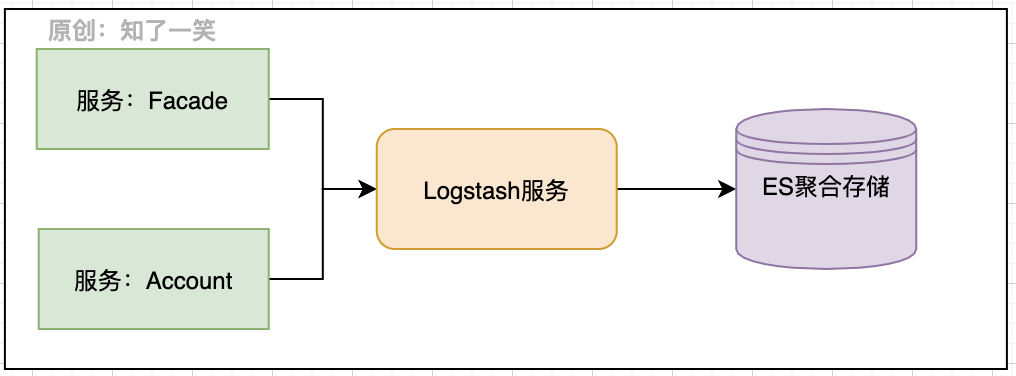
4. Data channel
Let's look at how the data is transferred to the es after being transferred to the logstash service. The corresponding transmission configuration is also required here. Note that the same version is recommended for logstash and ES, which is version 6.8.6 in this case.
Configuration file: logstash button conf
input {
  tcp {
    host => "192.168.37.139"
    port => "5044"
    codec => "json"
  }
}

output {
  elasticsearch {
    hosts => ["http://localhost:9200"]
    index => "log-%{+YYYY.MM.dd}"
  }
}
- Input configuration: specify the host and port of logstash connection, and specify the data format as json type;
- Output configuration: specify the ES address of log data output and the creation method of index index by day;
Start logstash service
/opt/logstash-6.8.6/bin/logstash -f /opt/logstash-6.8.6/config/logstash-butte.conf
In this way, the complete ELK log management link is realized. The log records can be viewed by using Kibana tool, and the view link can be found according to TraceId.
5, Reference source code
Application warehouse:
https://gitee.com/cicadasmile/butte-flyer-parent

Component encapsulation:
https://gitee.com/cicadasmile/butte-frame-parent
```</object></string,object></object></string,object>