1, Logging and monitoring
1.1,Log
1.1.1 container level
View the container level logs through the docker command
docker ps --->containerid
docker logs containerid --->View the log of the container
kubectl logs -f <pod-name> -c <container-name>
1.1.2 Pod level
kubectl describe pod springboot-demo-68b89b96b6-sl8bq
1.1.3 component service level
journalctl -u kubelet
1.1.4,LogPilot+ES+Kibana
The previous method can view the log well, but there are also problems. In case of server failure, the log cannot be saved well. At this time, it must be saved persistently and convenient for personnel to view. It is best to have a UI page to view. At this time, it is time to talk about the next thing
github: https://github.com/AliyunContainerService/log-pilot
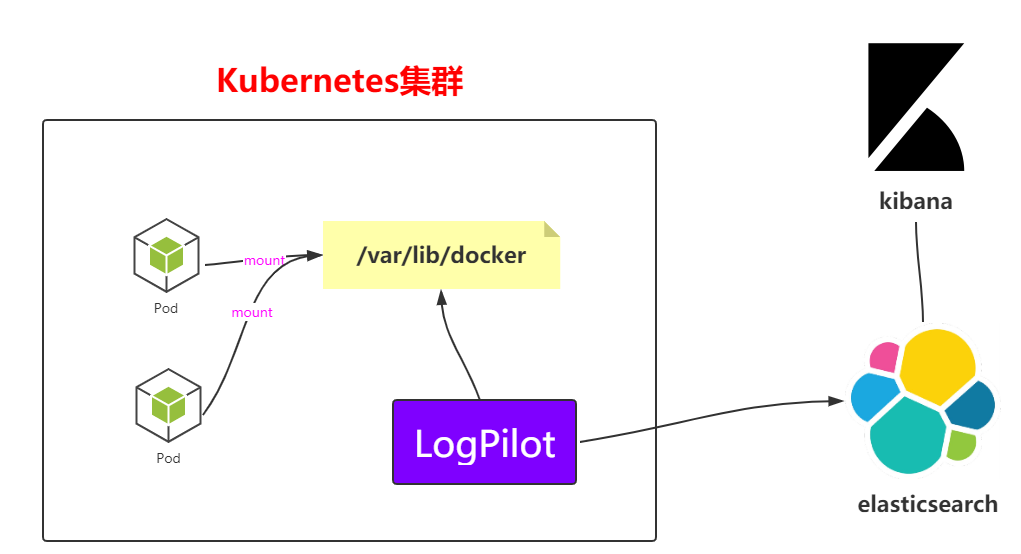
The above is an architecture diagram. You can see the collection method at a glance, but you can't analyze it more. Next, you can deploy the architecture directly in k8s
---
apiVersion: extensions/v1beta1
kind: DaemonSet
metadata:
  name: log-pilot
  namespace: kube-system
  labels:
    k8s-app: log-pilot
    kubernetes.io/cluster-service: "true"
spec:
  template:
    metadata:
      labels:
        k8s-app: log-es
        kubernetes.io/cluster-service: "true"
        version: v1.22
    spec:
      tolerations:
      - key: node-role.kubernetes.io/master
        effect: NoSchedule
      containers:
      - name: log-pilot
        image: registry.cn-hangzhou.aliyuncs.com/log-monitor/log-pilot:0.9-filebeat  #This piece needs to be pulled online. It's best to pull it by yourself and put it in your own mirror warehouse
        resources:
          limits:
            memory: 200Mi
          requests:
            cpu: 100m
            memory: 200Mi
        env:
          - name: "FILEBEAT_OUTPUT"
            value: "elasticsearch"
          - name: "ELASTICSEARCH_HOST"
            value: "elasticsearch-api"
          - name: "ELASTICSEARCH_PORT"
            value: "9200"
          - name: "ELASTICSEARCH_USER"
            value: "elastic"
          - name: "ELASTICSEARCH_PASSWORD"
            value: "changeme"
        volumeMounts:
        - name: sock
          mountPath: /var/run/docker.sock
        - name: root
          mountPath: /host
          readOnly: true
        - name: varlib
          mountPath: /var/lib/filebeat
        - name: varlog
          mountPath: /var/log/filebeat
        securityContext:
          capabilities:
            add:
            - SYS_ADMIN
      terminationGracePeriodSeconds: 30
      volumes:
      - name: sock
        hostPath:
          path: /var/run/docker.sock
      - name: root
        hostPath:
          path: /
      - name: varlib
        hostPath:
          path: /var/lib/filebeat
          type: DirectoryOrCreate
      - name: varlog
        hostPath:
          path: /var/log/filebeat
          type: DirectoryOrCreate
(2) startup script
kubectl apply -f log-pilot.yaml
(3) View the information of pod and daemon
kubectl get pods -n kube-system
kubectl get pods -n kube-system -o wide | grep log
kubectl get ds -n kube-system
(1) Create elasticsearch Yaml file
---
apiVersion: v1
kind: Service
metadata:
  name: elasticsearch-api
  namespace: kube-system
  labels:
    name: elasticsearch
spec:
  selector:
    app: es
  ports:
  - name: transport
    port: 9200
    protocol: TCP
---
apiVersion: v1
kind: Service
metadata:
  name: elasticsearch-discovery
  namespace: kube-system
  labels:
    name: elasticsearch
spec:
  selector:
    app: es
  ports:
  - name: transport
    port: 9300
    protocol: TCP
---
apiVersion: apps/v1beta1
kind: StatefulSet
metadata:
  name: elasticsearch
  namespace: kube-system
  labels:
    kubernetes.io/cluster-service: "true"
spec:
  replicas: 3
  serviceName: "elasticsearch-service"
  selector:
    matchLabels:
      app: es
  template:
    metadata:
      labels:
        app: es
    spec:
      tolerations:
      - effect: NoSchedule
        key: node-role.kubernetes.io/master
      initContainers:
      - name: init-sysctl
        image: busybox:1.27
        command:
        - sysctl
        - -w
        - vm.max_map_count=262144
        securityContext:
          privileged: true
      containers:
      - name: elasticsearch
        image: registry.cn-hangzhou.aliyuncs.com/log-monitor/elasticsearch:v5.5.1  #It's the same in here. Take your bag and put it in your private server
        ports:
        - containerPort: 9200
          protocol: TCP
        - containerPort: 9300
          protocol: TCP
        securityContext:
          capabilities:
            add:
              - IPC_LOCK
              - SYS_RESOURCE
        resources:
          limits:
            memory: 4000Mi
          requests:
            cpu: 100m
            memory: 2000Mi
        env:
          - name: "http.host"
            value: "0.0.0.0"
          - name: "network.host"
            value: "_eth0_"
          - name: "cluster.name"
            value: "docker-cluster"
          - name: "bootstrap.memory_lock"
            value: "false"
          - name: "discovery.zen.ping.unicast.hosts"
            value: "elasticsearch-discovery"
          - name: "discovery.zen.ping.unicast.hosts.resolve_timeout"
            value: "10s"
          - name: "discovery.zen.ping_timeout"
            value: "6s"
          - name: "discovery.zen.minimum_master_nodes"
            value: "2"
          - name: "discovery.zen.fd.ping_interval"
            value: "2s"
          - name: "discovery.zen.no_master_block"
            value: "write"
          - name: "gateway.expected_nodes"
            value: "2"
          - name: "gateway.expected_master_nodes"
            value: "1"
          - name: "transport.tcp.connect_timeout"
            value: "60s"
          - name: "ES_JAVA_OPTS"
            value: "-Xms2g -Xmx2g"
        livenessProbe:
          tcpSocket:
            port: transport
          initialDelaySeconds: 20
          periodSeconds: 10
        volumeMounts:
        - name: es-data
          mountPath: /data
      terminationGracePeriodSeconds: 30
      volumes:
      - name: es-data
        hostPath:
          path: /es-data
(2) Startup script file
kubectl apply -f elasticsearch.yaml
kubectl get pods -n kube-system
kubectl get pods -n kube-system -o wide | grep ela
(3) View svc under Kube system
kubectl get svc -n kube-system
elasticsearch-api       ClusterIP 10.106.65.2    <none> 9200/TCP
elasticsearch-discovery ClusterIP 10.101.117.180 <none> 9300/TCP
kube-dns                ClusterIP 10.96.0.10     <none>
(4) Check the statefullset under Kube system
kubectl get statefulset -n kube-system
NAME           READY    AGE
elasticsearch  3/3      106s
---
# Deployment
apiVersion: apps/v1beta1
kind: Deployment
metadata:
  name: kibana
  namespace: kube-system
  labels:
    component: kibana
spec:
  replicas: 1
  selector:
    matchLabels:
     component: kibana
  template:
    metadata:
      labels:
        component: kibana
    spec:
      containers:
      - name: kibana
        image: registry.cn-hangzhou.aliyuncs.com/log-monitor/kibana:v5.5.1  #Like this one, pull and save the private server yourself
        env:
        - name: CLUSTER_NAME
          value: docker-cluster
        - name: ELASTICSEARCH_URL
          value: http://elasticsearch-api:9200/
        resources:
          limits:
            cpu: 1000m
          requests:
            cpu: 100m
        ports:
        - containerPort: 5601
          name: http
---
# Service
apiVersion: v1
kind: Service
metadata:
  name: kibana
  namespace: kube-system
  labels:
    component: kibana
spec:
  selector:
    component: kibana
  ports:
  - name: http
    port: 80
    targetPort: http
---
# Ingress
apiVersion: extensions/v1beta1
kind: Ingress
metadata:
  name: kibana
  namespace: kube-system
spec:
  rules:
  - host: log.k8s.ghy.com
    http:
      paths:
      - path: /
        backend:
          serviceName: kibana
          servicePort: 80
(2) Execute script startup
kubectl apply -f kibana.yaml
(3) View pod and deployment information
kubectl get pods -n kube-system | grep ki
kubectl get deploy -n kube-system
(4) Configure the domain name required by Ingress and open the hosts file on windows
# Note that this is the IP address of worker01
121.41.10.126 kibana.ghy.com
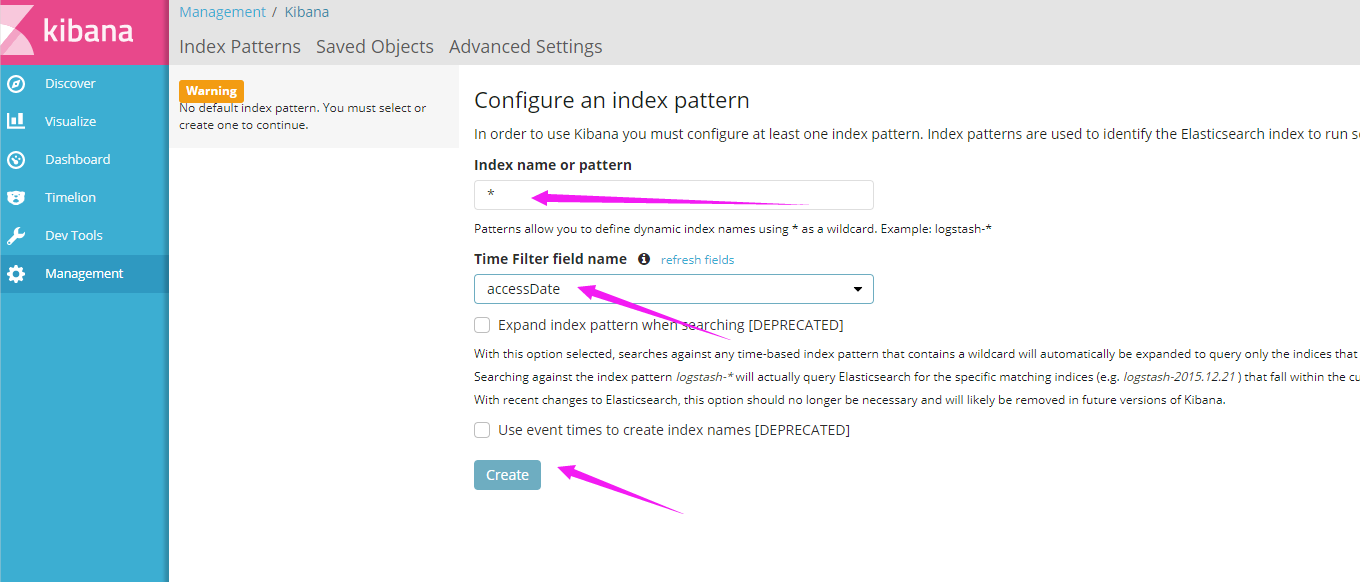
(5) Access in windows
1.2,Monitor
After the above steps, the log will be created. The next step is monitoring, such as monitoring CPU and system resources; Prometheus is officially recommended by K8S. Let's take a look at it.
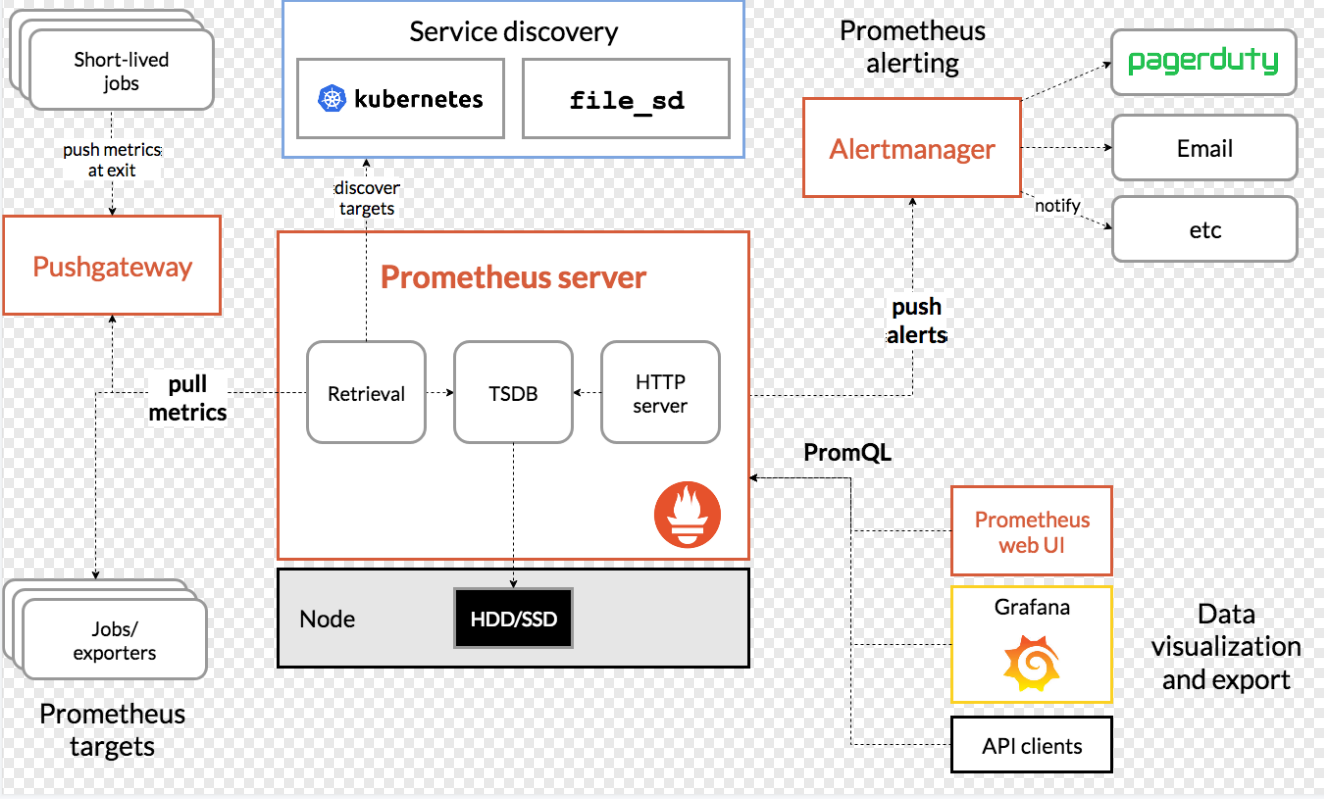
1.2.1 introduction to Prometheus
Official website: https://prometheus.io/github:https://github.com/kubernetes/kubernetes/tree/master/cluster/addons/prometheus
1.2.2 Prometheus architecture
1.2.3,Prometheus+Grafana
(1) create the prometheus directory on the master, and then create the following yaml files
apiVersion: v1
kind: Namespace
metadata:
  name: ns-monitor
  labels:
    name: ns-monitor
kind: DaemonSet
apiVersion: apps/v1beta2
metadata:
  labels:
    app: node-exporter
  name: node-exporter
  namespace: ns-monitor
spec:
  revisionHistoryLimit: 10
  selector:
    matchLabels:
      app: node-exporter
  template:
    metadata:
      labels:
        app: node-exporter
    spec:
      containers:
        - name: node-exporter
          image: prom/node-exporter:v0.16.0
          ports:
            - containerPort: 9100
              protocol: TCP
              name:    http
      hostNetwork: true
      hostPID: true
      tolerations:
        - effect: NoSchedule
          operator: Exists

---
kind: Service
apiVersion: v1
metadata:
  labels:
    app: node-exporter
  name: node-exporter-service
  namespace: ns-monitor
spec:
  ports:
    - name:    http
      port: 9100
      nodePort: 31672
      protocol: TCP
  type: NodePort
  selector:
    app: node-exporter
---
apiVersion: rbac.authorization.k8s.io/v1beta1
kind: ClusterRole
metadata:
  name: prometheus
rules:
  - apiGroups: [""] # "" indicates the core API group
    resources:
      - nodes
      - nodes/proxy
      - services
      - endpoints
      - pods
    verbs:
      - get
      - watch
      - list
  - apiGroups:
      - extensions
    resources:
      - ingresses
    verbs:
      - get
      - watch
      - list
  - nonResourceURLs: ["/metrics"]
    verbs:
      - get
---
apiVersion: v1
kind: ServiceAccount
metadata:
  name: prometheus
  namespace: ns-monitor
  labels:
    app: prometheus
---
apiVersion: rbac.authorization.k8s.io/v1beta1
kind: ClusterRoleBinding
metadata:
  name: prometheus
subjects:
  - kind: ServiceAccount
    name: prometheus
    namespace: ns-monitor
roleRef:
  kind: ClusterRole
  name: prometheus
  apiGroup: rbac.authorization.k8s.io
---
apiVersion: v1
kind: ConfigMap
metadata:
  name: prometheus-conf
  namespace: ns-monitor
  labels:
    app: prometheus
data:
  prometheus.yml: |-
    # my global config
    global:
      scrape_interval:     15s # Set the scrape interval to every 15 seconds. Default is every 1 minute.
      evaluation_interval: 15s # Evaluate rules every 15 seconds. The default is every 1 minute.
      # scrape_timeout is set to the global default (10s).

    # Alertmanager configuration
    alerting:
      alertmanagers:
      - static_configs:
        - targets:
          # - alertmanager:9093

    # Load rules once and periodically evaluate them according to the global 'evaluation_interval'.
    rule_files:
      # - "first_rules.yml"
      # - "second_rules.yml"

    # A scrape configuration containing exactly one endpoint to scrape:
    # Here it's Prometheus itself.
    scrape_configs:
      # The job name is added as a label `job=<job_name>` to any timeseries scraped from this config.
      - job_name: 'prometheus'

        # metrics_path defaults to '/metrics'
        # scheme defaults to 'http'.

        static_configs:
          - targets: ['localhost:9090']
      - job_name: 'grafana'
        static_configs:
          - targets:
              - 'grafana-service.ns-monitor:3000'

      - job_name: 'kubernetes-apiservers'

        kubernetes_sd_configs:
        - role: endpoints

        # Default to scraping over https. If required, just disable this or change to
        # `http`.
        scheme: https

        # This TLS & bearer token file config is used to connect to the actual scrape
        # endpoints for cluster components. This is separate to discovery auth
        # configuration because discovery & scraping are two separate concerns in
        # Prometheus. The discovery auth config is automatic if Prometheus runs inside
        # the cluster. Otherwise, more config options have to be provided within the
        # <kubernetes_sd_config>.
        tls_config:
          ca_file: /var/run/secrets/kubernetes.io/serviceaccount/ca.crt
          # If your node certificates are self-signed or use a different CA to the
          # master CA, then disable certificate verification below. Note that
          # certificate verification is an integral part of a secure infrastructure
          # so this should only be disabled in a controlled environment. You can
          # disable certificate verification by uncommenting the line below.
          #
          # insecure_skip_verify: true
        bearer_token_file: /var/run/secrets/kubernetes.io/serviceaccount/token

        # Keep only the default/kubernetes service endpoints for the https port. This
        # will add targets for each API server which Kubernetes adds an endpoint to
        # the default/kubernetes service.
        relabel_configs:
        - source_labels: [__meta_kubernetes_namespace, __meta_kubernetes_service_name, __meta_kubernetes_endpoint_port_name]
          action: keep
          regex: default;kubernetes;https

      # Scrape config for nodes (kubelet).
      #
      # Rather than connecting directly to the node, the scrape is proxied though the
      # Kubernetes apiserver.  This means it will work if Prometheus is running out of
      # cluster, or can't connect to nodes for some other reason (e.g. because of
      # firewalling).
      - job_name: 'kubernetes-nodes'

        # Default to scraping over https. If required, just disable this or change to
        # `http`.
        scheme: https

        # This TLS & bearer token file config is used to connect to the actual scrape
        # endpoints for cluster components. This is separate to discovery auth
        # configuration because discovery & scraping are two separate concerns in
        # Prometheus. The discovery auth config is automatic if Prometheus runs inside
        # the cluster. Otherwise, more config options have to be provided within the
        # <kubernetes_sd_config>.
        tls_config:
          ca_file: /var/run/secrets/kubernetes.io/serviceaccount/ca.crt
        bearer_token_file: /var/run/secrets/kubernetes.io/serviceaccount/token

        kubernetes_sd_configs:
        - role: node

        relabel_configs:
        - action: labelmap
          regex: __meta_kubernetes_node_label_(.+)
        - target_label: __address__
          replacement: kubernetes.default.svc:443
        - source_labels: [__meta_kubernetes_node_name]
          regex: (.+)
          target_label: __metrics_path__
          replacement: /api/v1/nodes/${1}/proxy/metrics

      # Scrape config for Kubelet cAdvisor.
      #
      # This is required for Kubernetes 1.7.3 and later, where cAdvisor metrics
      # (those whose names begin with 'container_') have been removed from the
      # Kubelet metrics endpoint.  This job scrapes the cAdvisor endpoint to
      # retrieve those metrics.
      #
      # In Kubernetes 1.7.0-1.7.2, these metrics are only exposed on the cAdvisor
      # HTTP endpoint; use "replacement: /api/v1/nodes/${1}:4194/proxy/metrics"
      # in that case (and ensure cAdvisor's HTTP server hasn't been disabled with
      # the --cadvisor-port=0 Kubelet flag).
      #
      # This job is not necessary and should be removed in Kubernetes 1.6 and
      # earlier versions, or it will cause the metrics to be scraped twice.
      - job_name: 'kubernetes-cadvisor'

        # Default to scraping over https. If required, just disable this or change to
        # `http`.
        scheme: https

        # This TLS & bearer token file config is used to connect to the actual scrape
        # endpoints for cluster components. This is separate to discovery auth
        # configuration because discovery & scraping are two separate concerns in
        # Prometheus. The discovery auth config is automatic if Prometheus runs inside
        # the cluster. Otherwise, more config options have to be provided within the
        # <kubernetes_sd_config>.
        tls_config:
          ca_file: /var/run/secrets/kubernetes.io/serviceaccount/ca.crt
        bearer_token_file: /var/run/secrets/kubernetes.io/serviceaccount/token

        kubernetes_sd_configs:
        - role: node

        relabel_configs:
        - action: labelmap
          regex: __meta_kubernetes_node_label_(.+)
        - target_label: __address__
          replacement: kubernetes.default.svc:443
        - source_labels: [__meta_kubernetes_node_name]
          regex: (.+)
          target_label: __metrics_path__
          replacement: /api/v1/nodes/${1}/proxy/metrics/cadvisor

      # Scrape config for service endpoints.
      #
      # The relabeling allows the actual service scrape endpoint to be configured
      # via the following annotations:
      #
      # * `prometheus.io/scrape`: Only scrape services that have a value of `true`
      # * `prometheus.io/scheme`: If the metrics endpoint is secured then you will need
      # to set this to `https` & most likely set the `tls_config` of the scrape config.
      # * `prometheus.io/path`: If the metrics path is not `/metrics` override this.
      # * `prometheus.io/port`: If the metrics are exposed on a different port to the
      # service then set this appropriately.
      - job_name: 'kubernetes-service-endpoints'

        kubernetes_sd_configs:
        - role: endpoints

        relabel_configs:
        - source_labels: [__meta_kubernetes_service_annotation_prometheus_io_scrape]
          action: keep
          regex: true
        - source_labels: [__meta_kubernetes_service_annotation_prometheus_io_scheme]
          action: replace
          target_label: __scheme__
          regex: (https?)
        - source_labels: [__meta_kubernetes_service_annotation_prometheus_io_path]
          action: replace
          target_label: __metrics_path__
          regex: (.+)
        - source_labels: [__address__, __meta_kubernetes_service_annotation_prometheus_io_port]
          action: replace
          target_label: __address__
          regex: ([^:]+)(?::\d+)?;(\d+)
          replacement: $1:$2
        - action: labelmap
          regex: __meta_kubernetes_service_label_(.+)
        - source_labels: [__meta_kubernetes_namespace]
          action: replace
          target_label: kubernetes_namespace
        - source_labels: [__meta_kubernetes_service_name]
          action: replace
          target_label: kubernetes_name

      # Example scrape config for probing services via the Blackbox Exporter.
      #
      # The relabeling allows the actual service scrape endpoint to be configured
      # via the following annotations:
      #
      # * `prometheus.io/probe`: Only probe services that have a value of `true`
      - job_name: 'kubernetes-services'

        metrics_path: /probe
        params:
          module: [http_2xx]

        kubernetes_sd_configs:
        - role: service

        relabel_configs:
        - source_labels: [__meta_kubernetes_service_annotation_prometheus_io_probe]
          action: keep
          regex: true
        - source_labels: [__address__]
          target_label: __param_target
        - target_label: __address__
          replacement: blackbox-exporter.example.com:9115
        - source_labels: [__param_target]
          target_label: instance
        - action: labelmap
          regex: __meta_kubernetes_service_label_(.+)
        - source_labels: [__meta_kubernetes_namespace]
          target_label: kubernetes_namespace
        - source_labels: [__meta_kubernetes_service_name]
          target_label: kubernetes_name

      # Example scrape config for probing ingresses via the Blackbox Exporter.
      #
      # The relabeling allows the actual ingress scrape endpoint to be configured
      # via the following annotations:
      #
      # * `prometheus.io/probe`: Only probe services that have a value of `true`
      - job_name: 'kubernetes-ingresses'

        metrics_path: /probe
        params:
          module: [http_2xx]

        kubernetes_sd_configs:
          - role: ingress

        relabel_configs:
          - source_labels: [__meta_kubernetes_ingress_annotation_prometheus_io_probe]
            action: keep
            regex: true
          - source_labels: [__meta_kubernetes_ingress_scheme,__address__,__meta_kubernetes_ingress_path]
            regex: (.+);(.+);(.+)
            replacement: ${1}://${2}${3}
            target_label: __param_target
          - target_label: __address__
            replacement: blackbox-exporter.example.com:9115
          - source_labels: [__param_target]
            target_label: instance
          - action: labelmap
            regex: __meta_kubernetes_ingress_label_(.+)
          - source_labels: [__meta_kubernetes_namespace]
            target_label: kubernetes_namespace
          - source_labels: [__meta_kubernetes_ingress_name]
            target_label: kubernetes_name

      # Example scrape config for pods
      #
      # The relabeling allows the actual pod scrape endpoint to be configured via the
      # following annotations:
      #
      # * `prometheus.io/scrape`: Only scrape pods that have a value of `true`
      # * `prometheus.io/path`: If the metrics path is not `/metrics` override this.
      # * `prometheus.io/port`: Scrape the pod on the indicated port instead of the
      # pod's declared ports (default is a port-free target if none are declared).
      - job_name: 'kubernetes-pods'

        kubernetes_sd_configs:
        - role: pod

        relabel_configs:
        - source_labels: [__meta_kubernetes_pod_annotation_prometheus_io_scrape]
          action: keep
          regex: true
        - source_labels: [__meta_kubernetes_pod_annotation_prometheus_io_path]
          action: replace
          target_label: __metrics_path__
          regex: (.+)
        - source_labels: [__address__, __meta_kubernetes_pod_annotation_prometheus_io_port]
          action: replace
          regex: ([^:]+)(?::\d+)?;(\d+)
          replacement: $1:$2
          target_label: __address__
        - action: labelmap
          regex: __meta_kubernetes_pod_label_(.+)
        - source_labels: [__meta_kubernetes_namespace]
          action: replace
          target_label: kubernetes_namespace
        - source_labels: [__meta_kubernetes_pod_name]
          action: replace
          target_label: kubernetes_pod_name
---
apiVersion: v1
kind: ConfigMap
metadata:
  name: prometheus-rules
  namespace: ns-monitor
  labels:
    app: prometheus
data:
  cpu-usage.rule: |
    groups:
      - name: NodeCPUUsage
        rules:
          - alert: NodeCPUUsage
            expr: (100 - (avg by (instance) (irate(node_cpu{name="node-exporter",mode="idle"}[5m])) * 100)) > 75
            for: 2m
            labels:
              severity: "page"
            annotations:
              summary: "{{$labels.instance}}: High CPU usage detected"
              description: "{{$labels.instance}}: CPU usage is above 75% (current value is: {{ $value }})"
---
apiVersion: v1
kind: PersistentVolume
metadata:
  name: "prometheus-data-pv"
  labels:
    name: prometheus-data-pv
    release: stable
spec:
  capacity:
    storage: 5Gi
  accessModes:
    - ReadWriteOnce
  persistentVolumeReclaimPolicy: Recycle
  nfs:
    path: /nfs/data/prometheus
    server: 121.41.10.13

---
apiVersion: v1
kind: PersistentVolumeClaim
metadata:
  name: prometheus-data-pvc
  namespace: ns-monitor
spec:
  accessModes:
    - ReadWriteOnce
  resources:
    requests:
      storage: 5Gi
  selector:
    matchLabels:
      name: prometheus-data-pv
      release: stable

---
kind: Deployment
apiVersion: apps/v1beta2
metadata:
  labels:
    app: prometheus
  name: prometheus
  namespace: ns-monitor
spec:
  replicas: 1
  revisionHistoryLimit: 10
  selector:
    matchLabels:
      app: prometheus
  template:
    metadata:
      labels:
        app: prometheus
    spec:
      serviceAccountName: prometheus
      securityContext:
        runAsUser: 0
      containers:
        - name: prometheus
          image: prom/prometheus:latest
          imagePullPolicy: IfNotPresent
          volumeMounts:
            - mountPath: /prometheus
              name: prometheus-data-volume
            - mountPath: /etc/prometheus/prometheus.yml
              name: prometheus-conf-volume
              subPath: prometheus.yml
            - mountPath: /etc/prometheus/rules
              name: prometheus-rules-volume
          ports:
            - containerPort: 9090
              protocol: TCP
      volumes:
        - name: prometheus-data-volume
          persistentVolumeClaim:
            claimName: prometheus-data-pvc
        - name: prometheus-conf-volume
          configMap:
            name: prometheus-conf
        - name: prometheus-rules-volume
          configMap:
            name: prometheus-rules
      tolerations:
        - key: node-role.kubernetes.io/master
          effect: NoSchedule

---
kind: Service
apiVersion: v1
metadata:
  annotations:
    prometheus.io/scrape: 'true'
  labels:
    app: prometheus
  name: prometheus-service
  namespace: ns-monitor
spec:
  ports:
    - port: 9090
      targetPort: 9090
  selector:
    app: prometheus
  type: NodePort
apiVersion: v1
kind: PersistentVolume
metadata:
  name: "grafana-data-pv"
  labels:
    name: grafana-data-pv
    release: stable
spec:
  capacity:
    storage: 5Gi
  accessModes:
    - ReadWriteOnce
  persistentVolumeReclaimPolicy: Recycle
  nfs:
    path: /nfs/data/grafana
    server: 121.41.10.13
---
apiVersion: v1
kind: PersistentVolumeClaim
metadata:
  name: grafana-data-pvc
  namespace: ns-monitor
spec:
  accessModes:
    - ReadWriteOnce
  resources:
    requests:
      storage: 5Gi
  selector:
    matchLabels:
      name: grafana-data-pv
      release: stable
---
kind: Deployment
apiVersion: apps/v1beta2
metadata:
  labels:
    app: grafana
  name: grafana
  namespace: ns-monitor
spec:
  replicas: 1
  revisionHistoryLimit: 10
  selector:
    matchLabels:
      app: grafana
  template:
    metadata:
      labels:
        app: grafana
    spec:
      securityContext:
        runAsUser: 0
      containers:
        - name: grafana
          image: grafana/grafana:latest
          imagePullPolicy: IfNotPresent
          env:
            - name: GF_AUTH_BASIC_ENABLED
              value: "true"
            - name: GF_AUTH_ANONYMOUS_ENABLED
              value: "false"
          readinessProbe:
            httpGet:
              path: /login
              port: 3000
          volumeMounts:
            - mountPath: /var/lib/grafana
              name: grafana-data-volume
          ports:
            - containerPort: 3000
              protocol: TCP
      volumes:
        - name: grafana-data-volume
          persistentVolumeClaim:
            claimName: grafana-data-pvc
---
kind: Service
apiVersion: v1
metadata:
  labels:
    app: grafana
  name: grafana-service
  namespace: ns-monitor
spec:
  ports:
    - port: 3000
      targetPort: 3000
  selector:
    app: grafana
  type: NodePort
#ingress
apiVersion: extensions/v1beta1
kind: Ingress
metadata:
  name: ingress
  namespace: ns-monitor
spec:
  rules:
  - host: monitor.k8s.ghy.com
    http:
      paths:
      - path: /
        backend:
          serviceName: grafana-service
          servicePort: 3000
(2) Create namespace ns monitor
kubectl apply -f namespace.yaml
kubectl get namespace
(3) Create node exporter
kubectl apply -f node-exporter.yaml
kubectl get pod -n ns-monitor kubectl get svc -n ns-monitor
kubectl get ds -n ns-monitor
kubectl apply -f prometheus.yaml
kubectl get pod -n ns-monitor
kubectl get svc -n ns-monitor
kubectl apply -f grafana.yaml
kubectl get pod -n ns-monitor
kubectl get svc -n ns-monitor
kubectl apply - ingress.yaml
kubectl get ingress -n ns-monitor
kubectl describe ingress -n ns-monitor