Author: Li Yixiao
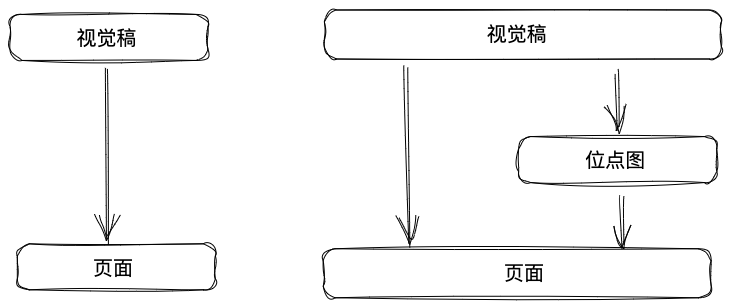
For the front end, it is essential to deal with the visual manuscript, because we need to determine the location, size and other information of elements against the visual manuscript. If it is a relatively simple page, the workload caused by manually adjusting each element is acceptable; However, when the amount of material in the visual manuscript is large, manually adjusting each element is no longer an acceptable strategy.
In the recent activity development, the author just encountered this problem. The development of this activity needs to complete a monopoly game, and as a monopoly game, maps are naturally essential. In the whole map, there are many different kinds of squares. If you manually adjust the position one by one, the workload is great. So is there a solution that can help us quickly determine the location and type of squares? The following is the method adopted by the author.
Scheme description
Site map
First of all, we need visual students to provide a special picture, called site map.
This picture should meet the following requirements:
- A 1px pixel point is placed at the upper left corner of each grid, and different types of grids are represented by different colors.
- The background color is solid: it is easy to distinguish between background and grid.
- The size is consistent with the size of the map background: the coordinates easy to read from the map can be used directly.
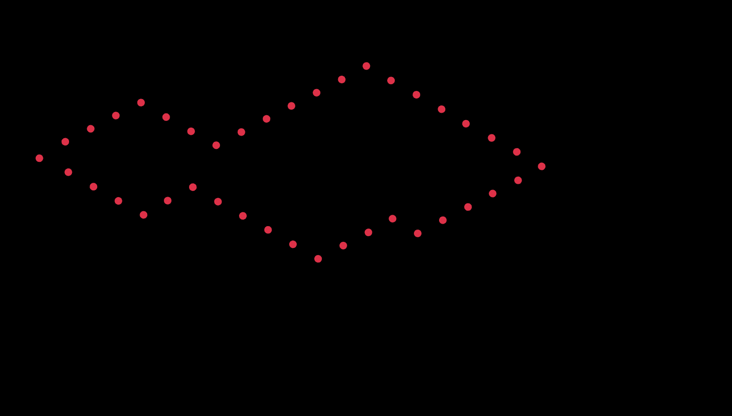
The above figure is an example. There is a 1px pixel at the upper left corner of each path grid. In order to be obvious, it is represented by red dots. In practice, different points have different colors due to different types of squares.
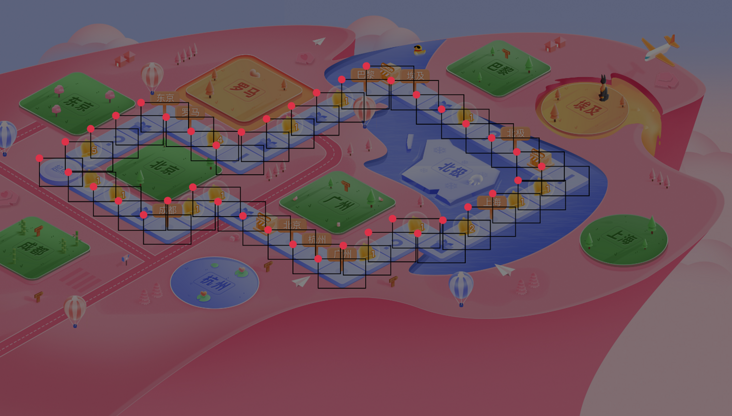
The outline of the material drawing is marked with a black frame in the above figure. It can be seen that the red dots correspond to each path grid one by one.
Read site map
In the above site map, the location and type information of all squares are marked. What we need to do next is to read out this information and generate a json file for our subsequent use.
const JImp = require('jimp');
const nodepath = require('path');

function parseImg(filename) {
    JImp.read(filename, (err, image) => {
        const { width, height } = image.bitmap;

        const result = [];

        // The color of the pixels in the upper left corner of the picture, that is, the color of the background image
        const mask = image.getPixelColor(0, 0);

        // Filter out non mask location points
        for (let y = 0; y < height; ++y) {
            for (let x = 0; x < width; ++x) {
                const color = image.getPixelColor(x, y);
                if (mask !== color) {
                    result.push({
                        // x y coordinate
                        x,
                        y,
                        // Grid type
                        type: color.toString(16).slice(0, -2),
                    });
                }
            }
        }

        // output
        console.log(JSON.stringify({
            // route
            path: result,
        }));
    });
}

parseImg('bitmap.png');
Here we use jimp for image processing, through which we can scan the color and position of each pixel in the picture.
So far, we have obtained the json file containing all grid location and type information:
{
    "path": [
        {
            "type": "",
            "x": 0,
            "y": 0,
        },
        // ...
    ],
}
Where x and y are the coordinates of the upper left corner of the grid; Type is the type of grid, and the value is the color value, representing different types of map grids.
Path connectivity algorithm
For our project, it is not enough to only determine the path points, but also connect these points into a complete path. Therefore, we need to find a shortest connection path composed of these points.
The code is as follows:
function takePath(point, points) {
    const candidate = (() => {
        // Sort by distance from small to large
        const pp = [...points].filter((i) => i !== point);
        const [one, two] = pp.sort((a, b) => measureLen(point, a) - measureLen(point, b));

        if (!one) {
            return [];
        }

        // If the two distances are small, enumerate two routes and select the shortest connected graph path.
        if (two && measureLen(one, two) < 20000) {
            return [one, two];
        }
        return [one];
    })();

    let min = Infinity;
    let minPath = [];
    for (let i = 0; i < candidate.length; ++i) {
        // Find the minimum path recursively
        const subpath = takePath(candidate[i], removeItem(points, candidate[i]));

        const path = [].concat(point, subpath);
        // Total length of measurement path
        const distance = measurePathDistance(path);

        if (distance < min) {
            min = distance;
            minPath = subpath;
        }
    }

    return [].concat(point, minPath);
}
Here, we have finished all the preparations and can start drawing the map. When drawing a map, we only need to read the json file first, and then place the corresponding materials according to the coordinate information and type information in the json file.
Scheme optimization
The above solutions can solve our problems, but there are still some inconveniences:
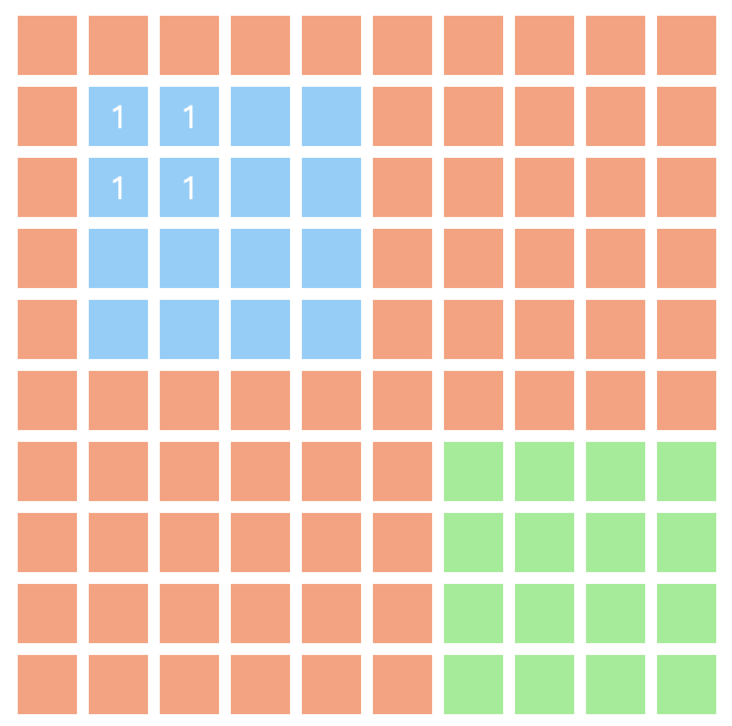
- Only 1px pixels are too small to be distinguished by the naked eye. Whether visual students or development students, it is difficult to check if they click the wrong position.
- The information contained in the site map is still too little, and the color only corresponds to the type. We hope to contain more information, such as the arrangement order between points, the size of squares, etc.
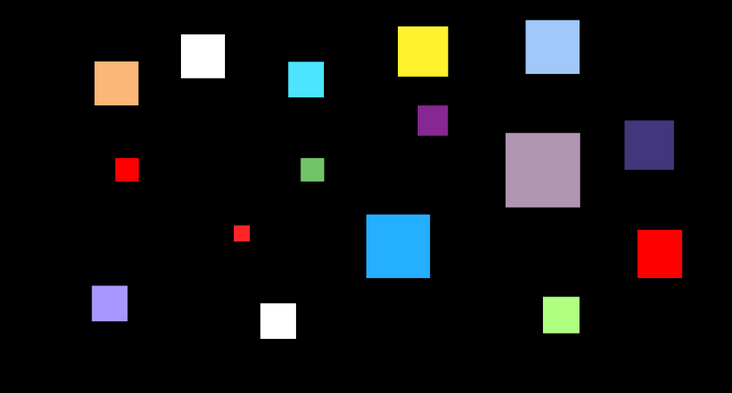
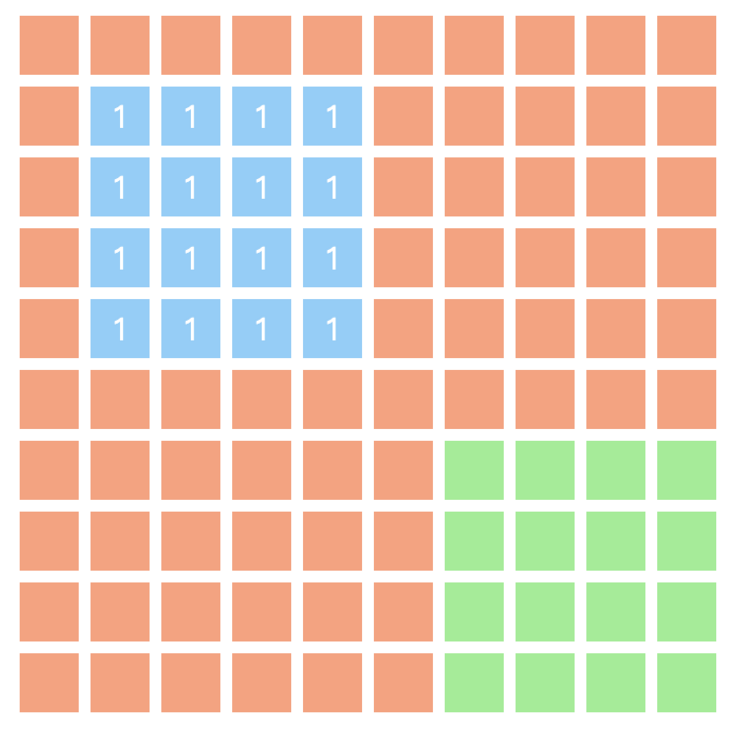
Pixel merging
For the first question, we can ask the vision students to expand 1px pixels into an area that can be recognized by the naked eye when drawing. It should be noted that there is no overlap between the two areas.
This requires us to make some adjustments to the code. In the previous code, when we scan a point whose color is different from the background color, we will directly record its coordinates and color information; Now, when we scan a point whose color is different from the background color, we also need to perform a region merging to include all adjacent points with the same color.
The idea of region merging draws lessons from the region growth algorithm of image processing. The idea of region growth algorithm is to take a pixel as the starting point, include the qualified points around the point, and then take the newly included points as the starting point and expand to the adjacent points of the new starting point until all the qualified points are included. This completes a regional consolidation. The process is repeated until all points in the whole image are scanned.
Our idea is very similar to the region growth algorithm:
Scan the pixel points in the image in turn. When a point whose color is different from the background color is scanned, record the coordinates and color of the point.
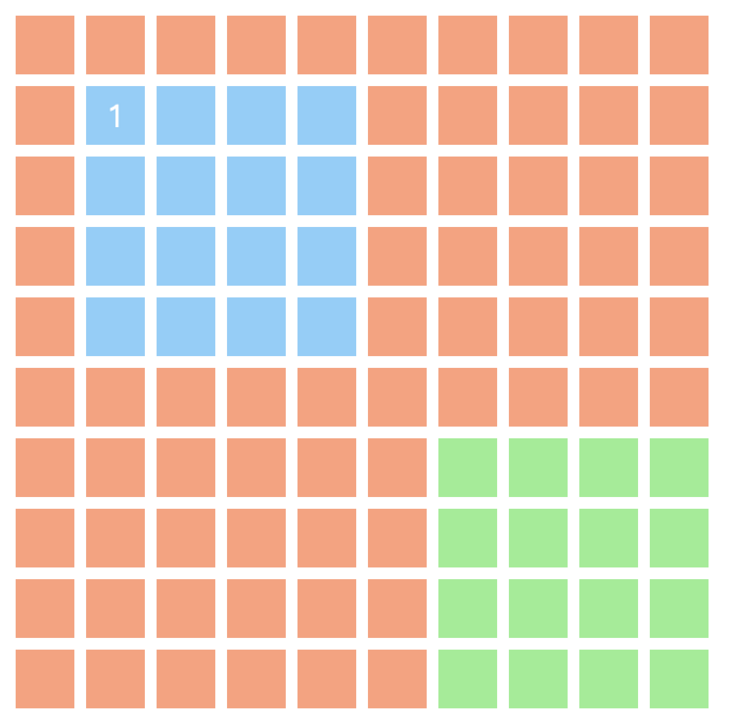
Then scan 8 points adjacent to the point and mark them with "scanned". Filter out the points whose color is different from the background color and have not been scanned and put them into the queue to be scanned.
- Take the next point to be scanned from the queue to be scanned, and repeat steps 1 and 2.
Until the queue to be scanned is empty, we scan an entire colored area. Region merge complete.
const JImp = require('jimp');

let image = null;
let maskColor = null;

// Judge whether two colors are the same - > in order to deal with the error of image color, equality is not used to judge
const isDifferentColor = (color1, color2) => Math.abs(color1 - color2) > 0xf000ff;

// Determine whether Yes (x,y) exceeds the boundary
const isWithinImage = ({ x, y }) => x >= 0 && x < image.width && y >= 0 && y < image.height;

// Select the largest number of colors
const selectMostColor = (dotColors) => { /* ... */ };

// Select the coordinates of the upper left corner
const selectTopLeftDot = (reginDots) => { /* ... */ };

// Region merging
const reginMerge = ({ x, y }) => {
    const color = image.getPixelColor(x, y);
    // Scanned points
    const reginDots = [{ x, y, color }];
    // Color of all scanned points - > after scanning, select the most color value as the color of this area
    const dotColors = {};
    dotColors[color] = 1;

    for (let i = 0; i < reginDots.length; i++) {
        const { x, y, color } = reginDots[i];

        // Grow in eight adjacent directions
        const seeds = (() => {
            const candinates = [/* Left, right, top, bottom, top left, bottom left, top right, bottom right */];

            return candinates
                // Remove points beyond the boundary
                .filter(isWithinImage)
                // Gets the color of each point
                .map(({ x, y }) => ({ x, y, color: image.getPixelColor(x, y) }))
                // Remove points similar to the background color
                .filter((item) => isDifferentColor(item.color, maskColor));
        })();

        for (const seed of seeds) {
            const { x: seedX, y: seedY, color: seedColor } = seed;

            // Add these points to reginDots as the boundary for the next scan
            reginDots.push(seed);

            // Set this point as the background color to avoid repeated scanning
            image.setPixelColor(maskColor, seedX, seedY);

            // The point color is a new color that has not been scanned. Add the color to dotColors
            if (dotColors[seedColor]) {
                dotColors[seedColor] += 1;
            } else {
                // If the color is the old color, increase the count value of the color
                dotColors[seedColor] = 1;
            }
        }
    }

    // After scanning, select the color value with the largest number as the color of the area
    const targetColor = selectMostColor(dotColors);

    // Select the coordinates of the top left corner as the coordinates of the current area
    const topLeftDot = selectTopLeftDot(reginDots);

    return {
        ...topLeftDot,
        color: targetColor,
    };
};

const parseBitmap = (filename) => {
    JImp.read(filename, (err, img) => {
        const result = [];
        const { width, height } = image.bitmap;
        // background color
        maskColor = image.getPixelColor(0, 0);
        image = img;

        for (let y = 0; y < height; ++y) {
            for (let x = 0; x < width; ++x) {
                const color = image.getPixelColor(x, y);

                // Different colors
                if (isDifferentColor(color, maskColor)) {
                    // Start the seed growth program and scan all adjacent color blocks in turn
                    result.push(reginMerge({ x, y }));
                }
            }
        }
    });
};
Colors contain additional information
In previous schemes, we used color values to represent types, but in fact, color values can contain a lot of information.
A color value can be represented by rgba, so we can let r, g, b and a represent different information, such as r for type, g for width, b for height and a for order. Although the number of each rgba is limited (the range of r, g and b is 0-255, and the range of a is 0-99), it is basically enough for us to use.
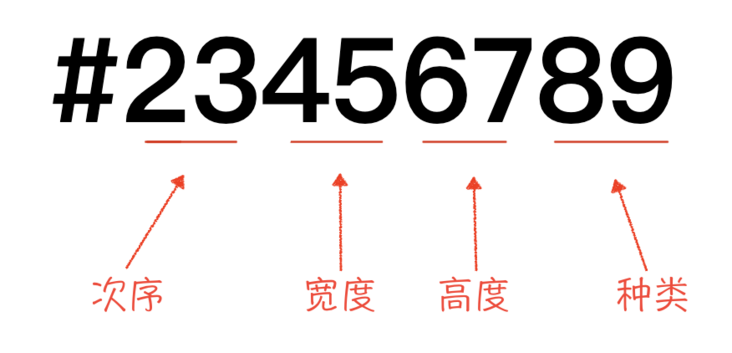
Of course, you can even go further and let each number represent one kind of information, but in this way, the range of each kind of information is relatively small, only 0-9.
summary
For scenes with a small amount of material, the front end can directly confirm the material information from the visual manuscript; When there is a large amount of material, the workload of directly confirming the material information from the visual manuscript becomes very large, so we use the site map to help us obtain the material information.
Map is such a typical scene. In the above example, we have successfully drawn the map through the information read from the site map. Our steps are as follows:
Visual students provide a site map as a carrier of information, which needs to meet the following three requirements:
- The size is consistent with the size of the map background: the coordinates that we can read from the map can be used directly.
- The background color is solid: it is easy to distinguish between background and grid.
- In the upper left corner of each grid, place a grid. Squares of different colors represent different types.
- The color of each pixel on the picture is scanned by jimp to generate a json containing each grid position and type.
- When drawing a map, first read the json file, and then place the material according to the coordinate information and type information in the json file.
The above scheme is not perfect. Here we mainly improve the site map. The improved scheme is divided into two aspects:
- Because the pixels of 1px are too small for the naked eye, it is very inconvenient for visual students to draw pictures and for us to debug. Therefore, we expand the pixels into an area and merge the adjacent pixels of the same color during scanning.
- Let the rgba of color correspond to one kind of information respectively, and expand the information that the color value in the site map can provide us.
Here we only focus on the part of obtaining map information, and how to draw a map is not within the scope of this article. I used Pixi in my project JS as an engine to render, the complete project can refer to here , I will not repeat here.
FAQ
On the bit graph, the size of the color block is directly used as the width and height of the path grid?
Certainly. However, this situation has limitations. When we have a lot of materials and overlap each other, if we still use the block size as the width and height, the blocks on the bit map will overlap each other, affecting us to read the position information.
How to deal with the situation of damaged drawings?
In a lossy graph, the color at the edge of the graph is slightly different from the color at the center. Therefore, it is necessary to add a judgment function. Only when the difference between the color of the scanned point and the background color is greater than a certain number, it will be considered as points of different colors and start region merging. At the same time, it should be noted that the color of the box in the bit diagram should be selected as much as possible with a large difference from the background color value.
This judgment function is the isDifferentColor function in our code above.
const isDifferentColor = (color1, color2) => Math.abs(color1 - color2) > 0xf000ff;
How does 0xf000ff come from judging that two colors are not equal?
Whatever. This is related to the color contained in the picture. If your background color is very similar to the color of the point on the picture, this value needs to be smaller; If the difference between the background color and the color of the point on the figure is large, this value can be larger.