(I originally published in HackMD: HackMD links , link content was made in Taiwan, so it is traditional)
1. Problem description
Using any RNN (simple RNN, GRU, LSTM), according to 1000 time series data provided, 1001-1500 data are predicted.
Data set provided:
A3 ﹐ train.txt, including 1000 lines, each line is a float type value. The contents of the txt file are as follows: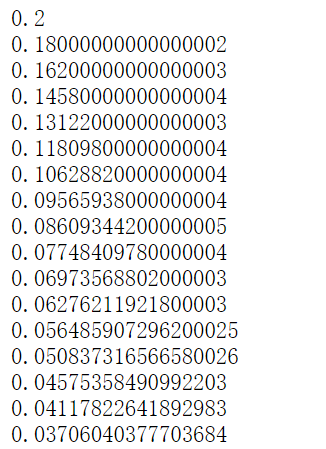
2. Data preprocessing
① Read the file, and convert 1000 pieces of data in the file to an array with a shape of (1000,)
# Read the file and construct 1000 pieces of data into an array with the shape of (1000,)
import os
import numpy as np
from matplotlib import pyplot as plt
data_dir = r"C:\Users\NOTEBOOK\DeepLearningNote\train_data.txt"
f = open(data_dir)
content = f.read()
f.close()

samples = [float(i) for i in content.split("\n")]
samples = np.array(samples)
plt.plot(range(len(samples)),samples)
Show 1000 pieces of data
② Define a function to generate train? Data and train? Labels
This function can generate (900100) - like array, as train_data, as train_labels
#Define the split ﹣ sequence function. The return value X contains the values before n ﹣ steps. y is the value of the next time
def split_sequence(sequence, n_steps):
    X, y = list(), list()
    for i in range(len(sequence)):
        end_ix = i + n_steps
        if end_ix > len(sequence)-1:
            break
        seq_x, seq_y = sequence[i:end_ix], sequence[end_ix]
        X.append(seq_x)
        y.append(seq_y)
    return np.array(X), np.array(y)
③ All the data and labels are obtained by the split ﹣ sequence function, and the train ﹣ data is transformed into a form that can be processed by LSTM
data,labels = split_sequence(samples,100)
data = data.reshape((len(data),100,1))
3. Model building
The model consists of three LSTM layers and one Dense layer
#Modeling
from keras.models import Sequential
from keras.layers import GRU,LSTM,Dropout,Dense
model = Sequential()
model.add(LSTM(20,activation="relu",input_shape=(100,1),return_sequences=True))
model.add(LSTM(30,activation="relu",return_sequences=True))
model.add(LSTM(30,activation="relu"))
model.add(Dense(1))
model.compile(optimizer='adam', loss='mse')
model.summary()
4. Training model
Take 20% of 1000 data as validation data
history = model.fit(data,labels,epochs=20,batch_size=20,validation_split=0.2)
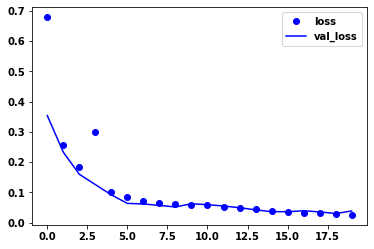
Since the initial weights are random, the best training process is as follows
Print the loss and val Ou loss of its training process
loss = history.history['loss']
val_loss = history.history['val_loss']
plt.plot(range(20),loss,"bo",label="loss")
plt.plot(range(20),val_loss,"b",label='val_loss')
plt.legend()
plt.show()
5. forecast
① Define prediction function
This function is used to get the 500 prediction results of 1001-1500
This function first obtains the 1001st prediction result by using the 100 data of 9011000, then stores the 1001st prediction result in the results, and adds the 100 data of 9021001 into the original data. The next round of prediction will take this as the input to obtain the 1002nd prediction result, which will go down successively until 500 times of operation, that is to say, the 1500th prediction result
#Define methods to predict results from 1001 to 1500
def predict1001_1500(samples):
    results = []
    for i in range(500):

#         print(samples[-1].shape)
        result = model.predict(samples[-1].reshape(1,100,1))

        results.append(result)

        sample = np.append(samples[-1][1:],result)

        sample = sample.reshape((1,100,1))
#         print(sample.shape)
        samples = np.concatenate((samples,sample),axis=0)
    return results
② The 500 prediction results of 1001-1500 are obtained
results = predict1001_1500(data)
Print out the 1500 prediction results
plt.plot(range(1000),samples)
plt.plot(range(1000,1500),np.array(results).reshape(500,))

Print 500 forecast results separately
plt.plot(range(500),np.array(results).reshape(500,))


