0. Introduction
The last issue introduced mac pro M1(ARM) installation: VMWare Fusion and linux(centos7/ubantu) In this issue, let's see how to install elasticsearch and kibana on m1
1. Install es and kibana based on centos
How to install centos virtual machine on m1 can refer to the above blog
1.1 download
This is based on the demonstration of version 7.13.0. If you need to download other versions, you can switch to download by yourself. Note: download the LINUX AARCH64 version
kibana download address: kibana official download address
es download address: es official download address
logstash download address: logstash official download address
File list
elasticsearch-7.13.0-linux-aarch64.tar.gz
kibana-7.13.0-linux-aarch64.tar.gz
logstash-7.13.0-linux-aarch64.tar.gz
1.2 installation
1. Upload files to the server. Here, select scp to upload
Because es and kibana are commonly used, I created two virtual machines here. I installed es and kibana on one virtual machine and logstash on another virtual machine separately. Here is only an example of installing an ES single node. If you need to install a cluster, you can modify the corresponding configuration
scp elasticsearch-7.13.0-linux-aarch64.tar.gz root@192.168.244.11:/var/local
2. Decompress
cd /var/local
tar -zxvf elasticsearch-7.13.0-linux-aarch64.tar.gz
3. Modify profile
cd elasticsearch7.13.0
vim config/elasticsearch.yml
Profile content
Tips:
In vim, if you want to empty all the contents of the file, first press esc, then enter g twice, navigate to the first line, and then enter d,G
Delete a line and enter d twice
cluster.name: cluster1
# Initial master node
cluster.initial_master_nodes: ["node-1"]
# Node name
node.name: node-1
# Whether to select master node
node.roles: [master,data,remote_cluster_client]
# data folder, created in advance
path.data: /var/local/elasticsearch_data
# # Log folder, created in advance
path.logs: /var/local/elasticsearch_logs
# ip address exposed by the other party
network.host: 192.168.244.11
# Cross domain access is allowed. head access needs to be enabled
http.cors.enabled: true
http.cors.allow-origin: "*"
4. It is not recommended to put the data and log folders under the es installation directory, otherwise the data will be lost when upgrading the es version, so we need to create the data and log folders
mkdir /var/local/elasticsearch_log
mkdir /var/local/elasticsearch_data
5. Assign the es file permissions to the elastic account
Because es cannot be started with the root account, we need to assign the ES file permission to another account separately. If there is no account, create an account first. I take the elastic account as an example
chown -R elastic:elastic /var/local/elasticsearch_data
chown -R elastic:elastic /var/local/elasticsearch_logs
chown -R elastic:elastic /var/local/elasticsearch-7.13.0
6. Open port 92009300
# Check whether the specified port is open
firewall-cmd --query-port=9200/tcp
firewall-cmd --query-port=9300/tcp
# Open specified port
firewall-cmd --add-port=9200/tcp --permanent
firewall-cmd --add-port=9300/tcp --permanent
# Reload the added port
firewall-cmd --reload
7. Switch elastic account and start es
su elastic
./bin/elasticsearch
8. If an error is reported during startup, VM max_ map_ Count too low, because the memory is too small.
max virtual memory areas vm.max_map_count [65530] is too low, increase to at least [262144]
If it is a production environment, I need to increase the memory, but because this is a test environment, I will lower the es memory requirements
(1) Increase the maximum number of files opened by users
#  root execute instruction
vim /etc/security/limits.conf

# Add last file
# *Represents all users,
* soft nproc 65536
* hard nproc 65536
* soft nofile 65536
* hard nofile 65536
root soft nproc 65536
root hard nproc 65536
root soft nofile 65536
root hard nofile 65536

# Restart after saving (restart after executing the second step)
reboot
# View current value
ulimit -Hn
(2) Add VM max_ map_ count
vim /etc/sysctl.conf
# Finally add
vm.max_map_count=655360

# see
sysctl -p
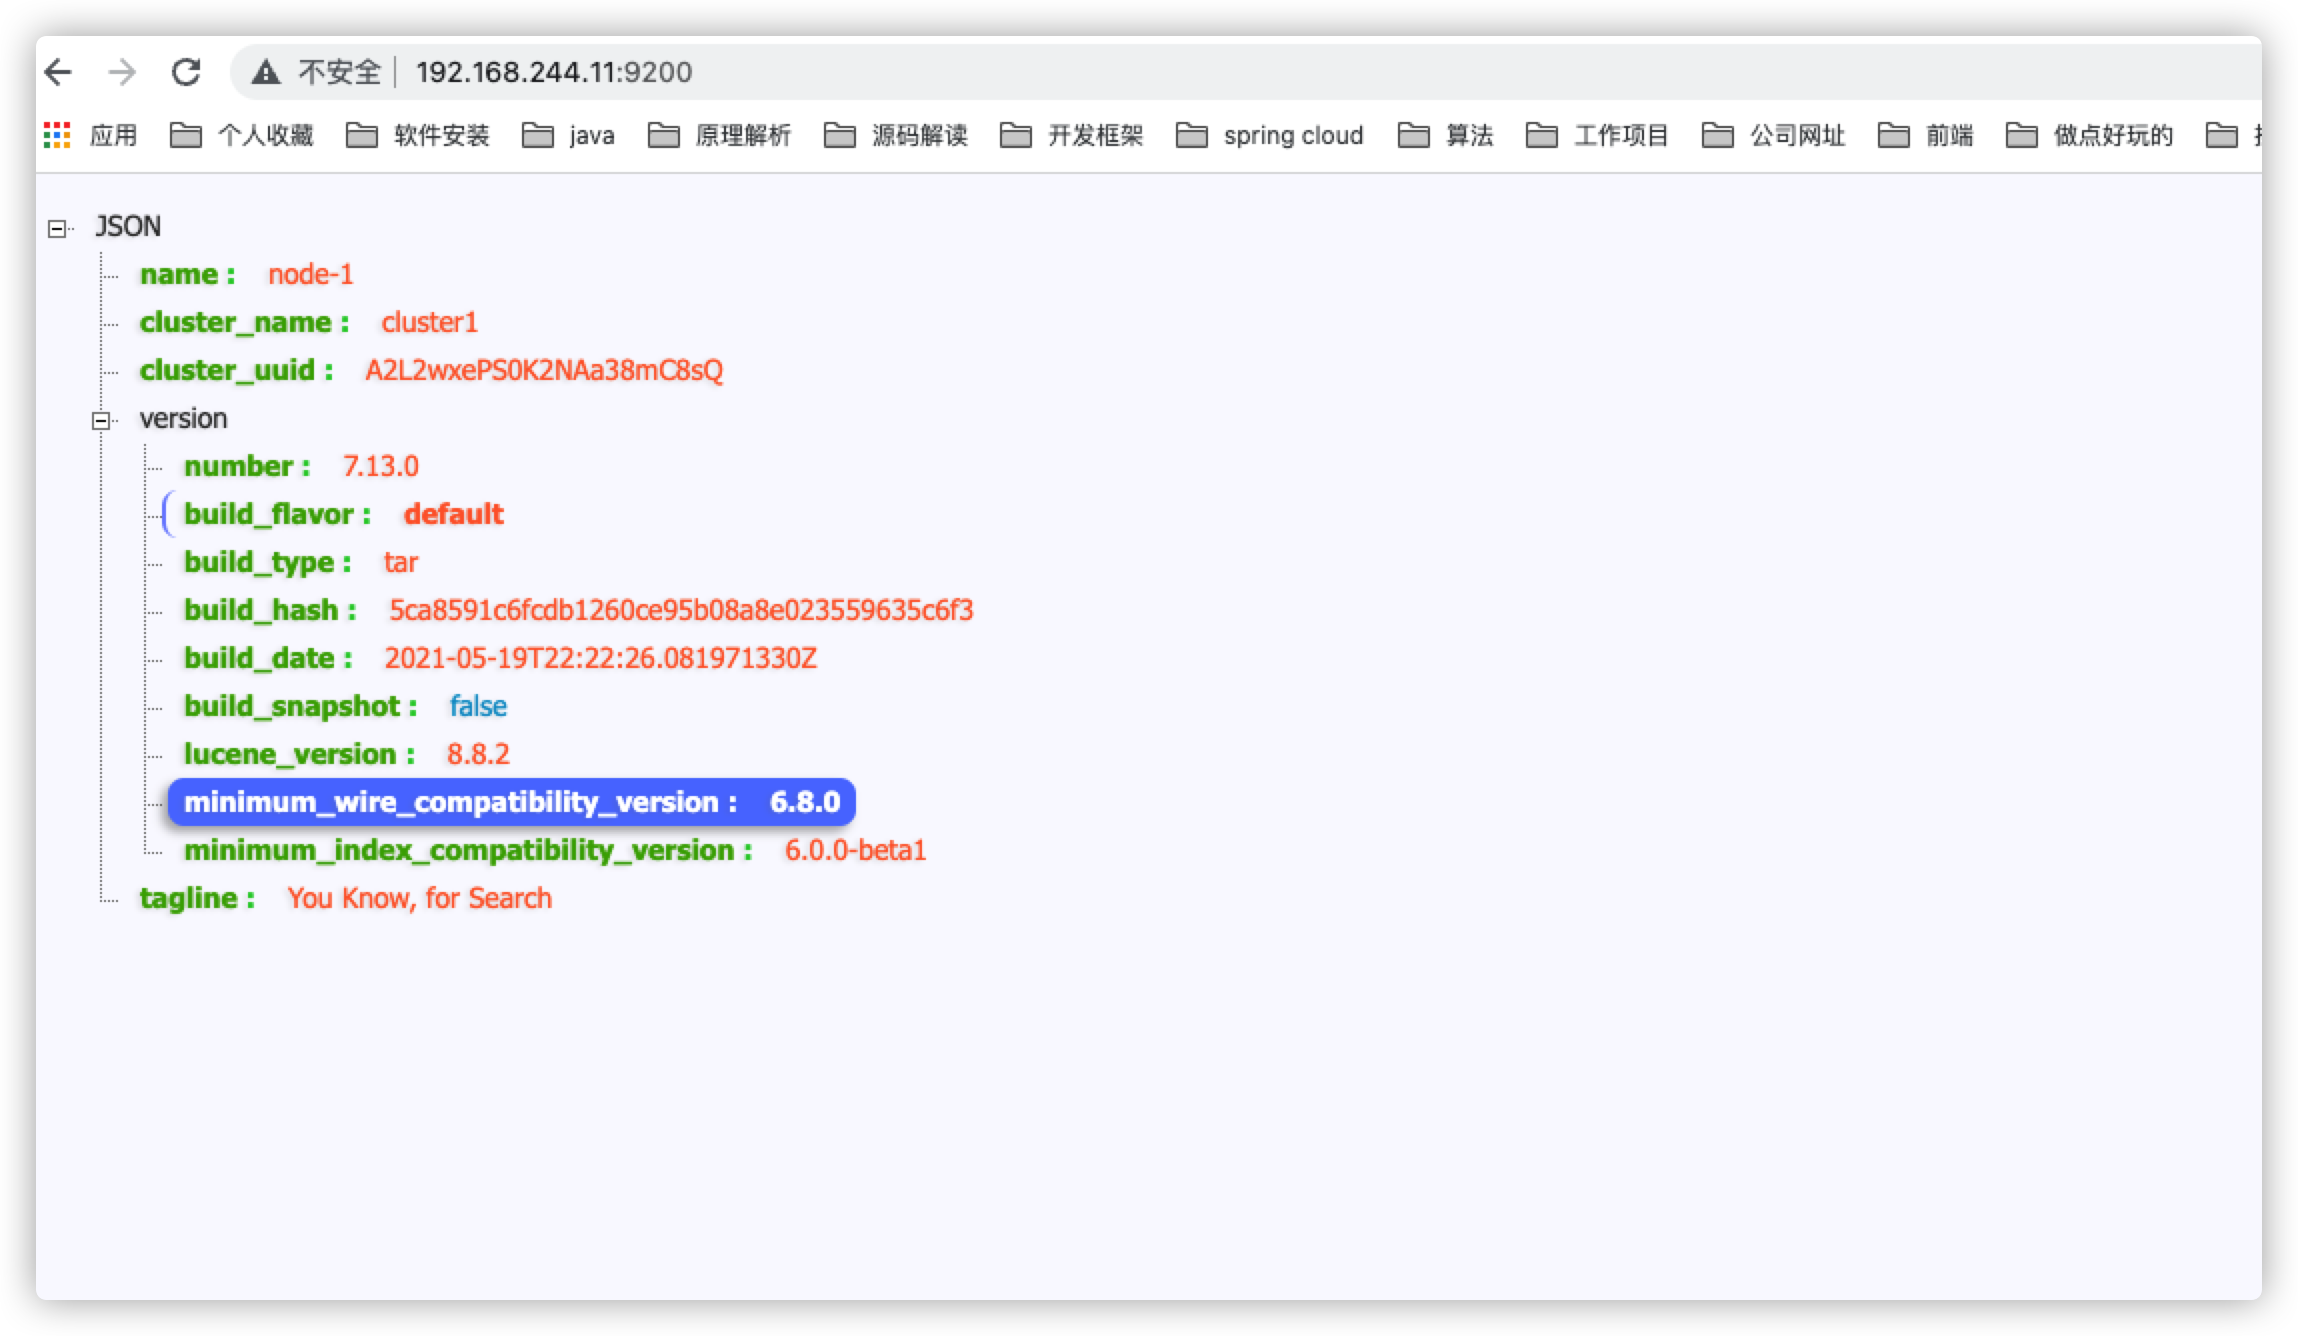
9. Restart es, test
Access on mac: 192.168.244.11:9200
1.3 installation of kibana
1. Upload files to the server. Here, select scp to upload
scp kibana-7.13.0-linux-aarch64.tar.gz root@192.168.244.11:/var/local
2. Decompress
cd /var/local
tar -zxvf kibana-7.13.0-linux-aarch64.tar.gz
3. Modify profile
cd kibana-7.13.0-linux-aarch64/
vim config/kiban.yml
Modification content
server.port: 5601
server.name: kibana
server.host: "0"
elasticsearch.hosts: [ "http://192.168.244.11:9200"]
xpack.monitoring.ui.container.elasticsearch.enabled: true
4. Empower kibana file to elastic account
chown -R elastic:elastic /var/local/kibana-7.13.0-linux-aarch64
5. Open 5601 port
firewall-cmd --add-port=5601/tcp --permanent
# Reload the added port
firewall-cmd --reload
6. Launch kibana with elastic account
su elastic
./bin/kibana
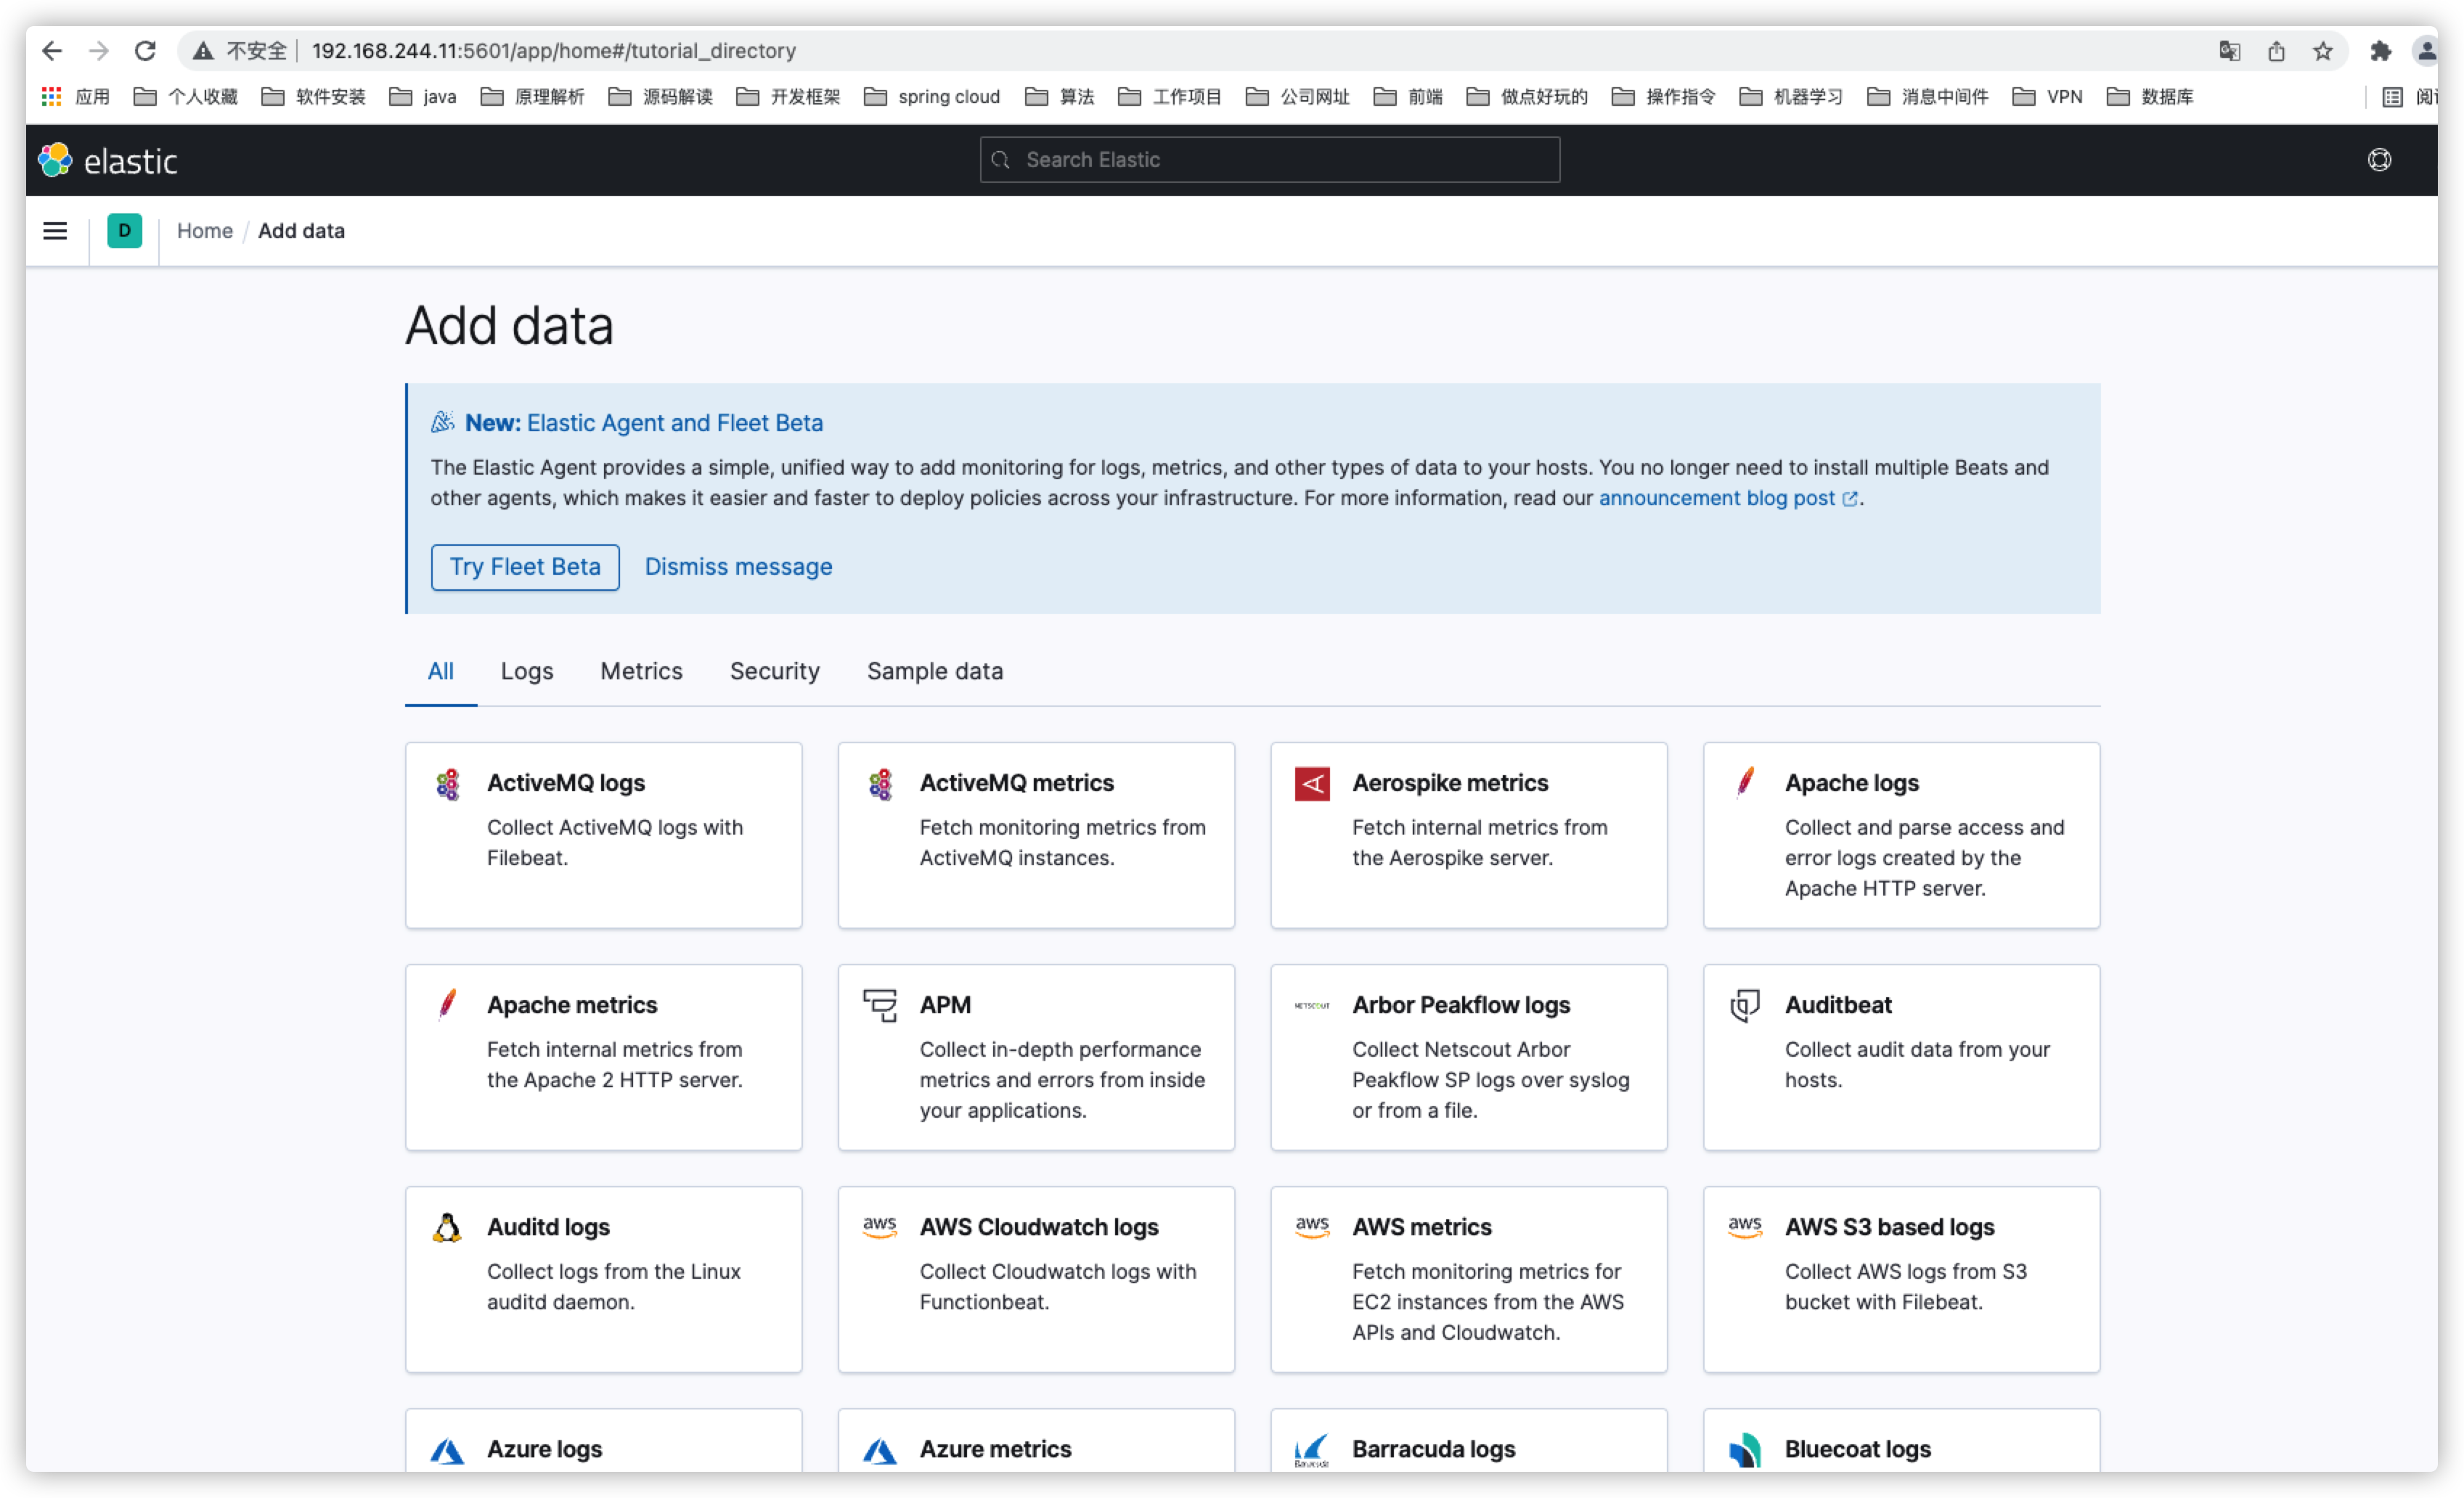
7. Test, visit 192.168.244.11:5601
1.3.1 common error reports
Error: /lib64/libstdc++.so.6: version `GLIBCXX_3.4.20' not found (required by /var/local/kibana-7.13.0-linux-aarch64/node_modules/re2/build/Release/re2.node)
1. Execute the following command to find the latest dynamic library generated when compiling gcc
find / -name "libstdc++.so*"
The output path is as follows:
/var/local/elasticsearch-7.13.0/modules/x-pack-ml/platform/linux-aarch64/lib/libstdc++.so.6
/usr/lib64/libstdc++.so.6
/usr/lib64/libstdc++.so.6.0.19 // Latest dynamic library
/usr/share/gdb/auto-load/usr/lib64/libstdc++.so.6.0.19-gdb.py
/usr/share/gdb/auto-load/usr/lib64/libstdc++.so.6.0.19-gdb.pyc
/usr/share/gdb/auto-load/usr/lib64/libstdc++.so.6.0.19-gdb.pyo
2. Because there is no error when the es is started, it is speculated that the dynamic library of the es is complete. Therefore, the dynamic library of the es is overwritten to the / usr/lib64 directory (backup in advance)
cp /var/local/elasticsearch-7.13.0/modules/x-pack-ml/platform/linux-aarch64/lib/libstdc++.so.6 /usr/lib64
3. Check dynamic library
strings /usr/lib64/libstdc++.so.6 | grep GLIBC
4. Restart kibana, normal
1.4 installing logstash
1. Upload files to the server. Here, select scp to upload
scp logstash-7.13.0-linux-aarch64.tar.gz root@192.168.244.12:/var/local
The installation steps have been described before. They will not be repeated here. Please refer to ELK implements distributed microservice log monitoring
2. docker based installation
2.1 docker installation es
Get image,The lowest is only 7.14.0 of docker The image fits m1
docker pull elasticsearch:7.14.0
install
docker run --name elasticsearch -p 9200:9200 -p 9300:9300 \
 -e "discovery.type=single-node" \
 -e ES_JAVA_OPTS="-Xms64m -Xmx512m" \
 -v /Library/software/dockerdata/elasticsearch/config/elasticsearch.yml:/usr/share/elasticsearch/config/elasticsearch.yml \
 -v /Library/software/dockerdata/elasticsearch/data:/usr/share/elasticsearch/data \
 -v /Library/software/dockerdata/elasticsearch/logs:/usr/share/elasticsearch/logs \
 -d elasticsearch:7.14.0
The configuration file, or the configuration file can not be mapped, is applicable to the system default
cluster.name: cluster_local
#cluster.initial_master_nodes: ["node1"]
node.name: node1
node.roles: [master,data]
network.host: 0.0.0.0
discovery.seed_hosts: ["127.0.0.1"]
2.2 docker installation kibana
Get image, 7.14.0 The rear fits M1
docker pull kibana:7.14.0
 Installation 192.168.101.123 Host computer IP
docker run --name kibana -e ELASTICSEARCH_HOSTS=http://192.168.101.123:9200 -p 5601:5601 \
-d kibana:7.14.0
3. Relevant recommendations
1,ELK implements distributed microservice log monitoring
2,Develop plug-ins, tools, software recommendations (improve productivity)