Return to actual house price forecast
Use what you have learned to solve real-world problems. Let's use these principles to estimate house prices. Housing valuation is one of the most classic cases to understand regression analysis, which is usually a good entry point. It is in line with people's intuition and with people
Our lives are closely related, so it is easier to understand relevant concepts through house valuation before dealing with complex things with machine learning. We will use the decision tree regressor with AdaBoost algorithm to solve this problem.
Decision tree is a tree model. Each node makes a decision, which affects the final result. Leaf nodes represent output values and branches represent intermediate decisions made according to input characteristics. AdaBoost algorithm refers to adaptive boosting algorithm, which is a technology that uses other systems to enhance the accuracy of the model. This technology combines the results of different versions of the algorithm and obtains the final result by weighted summary, which is called weak learner (weak learners). The information obtained by AdaBoost algorithm in each stage will be fed back to the model, so that the learner can focus on training samples that are difficult to classify in the later stage. This learning method can enhance the accuracy of the system.
The above is quoted from classic examples of Python machine learning 1.9. In this experiment, in order to combine the knowledge learned in the previous article, I added linear regression and ridge regression to quantitatively compare the results with the decision tree results.
Complete code
#call library
import numpy as np
from sklearn.tree import DecisionTreeRegressor
from sklearn.ensemble import AdaBoostRegressor
from sklearn import datasets
from sklearn.metrics import explained_variance_score, mean_squared_error
from sklearn.utils import shuffle
import matplotlib.pyplot as plt
from sklearn import linear_model

#Load data from standard house price database
housing_data = datasets.load_boston()
#print('data-------------------', housing_data.data)
#print('target-------------------', housing_data.target)

#Sort out the input and output data, and use shuffle to disrupt the data_ State controls how the order is disrupted
x,y = shuffle(housing_data.data, housing_data.target, random_state = 7)

#Separate training set and test set
num_training = int(0.8*len(x))
x_train, y_train = x[:num_training], y[:num_training]
x_test, y_test = x[num_training:], y[num_training:]

#Set the depth of the decision tree to 4
dt_regressor = DecisionTreeRegressor(max_depth=(4))
dt_regressor.fit(x_train, y_train)

#The decision tree regression model with AdaBoost algorithm is used for fitting
ab_regressor = AdaBoostRegressor(DecisionTreeRegressor(max_depth=(4)),
                                 n_estimators=400, random_state=(7))
ab_regressor.fit(x_train, y_train)

#Evaluate the effect of decision tree regression
y_pred_dt = dt_regressor.predict(x_test)
mse = mean_squared_error(y_test, y_pred_dt)
evs = explained_variance_score(y_test, y_pred_dt)
print("\n### Decision Tree performance ####")
print("Mean squared error = ", round(mse, 2))
print("Explained variance score = ",round(evs, 2))

#Evaluate the improvement effect of AdaBoost algorithm
y_pred_ab = ab_regressor.predict(x_test)
mse = mean_squared_error(y_test, y_pred_ab)
evs = explained_variance_score(y_test, y_pred_ab)
print("\n### AdaBoost performance ####")
print("Mean squared error = ", round(mse, 2))
print("Explained variance score = ",round(evs, 2))

#Try linear regression
linear_regressor = linear_model.LinearRegression()
linear_regressor.fit(x_train,y_train)

#Evaluate the results of linear regression
y_pred_dt = linear_regressor.predict(x_test)
mse = mean_squared_error(y_test, y_pred_dt)
evs = explained_variance_score(y_test, y_pred_dt)
print("\n### Linear Regressor performance ####")
print("Mean squared error = ", round(mse, 2))
print("Explained variance score = ",round(evs, 2))

#Try using ridge regression
ridge_regressor = linear_model.Ridge(alpha=0.01, fit_intercept=True, max_iter=10000)
ridge_regressor.fit(x_train,y_train)

#Evaluate the results of ridge regression
y_pred_dt = ridge_regressor.predict(x_test)
mse = mean_squared_error(y_test, y_pred_dt)
evs = explained_variance_score(y_test, y_pred_dt)
print("\n### Ridge Regressor performance ####")
print("Mean squared error = ", round(mse, 2))
print("Explained variance score = ",round(evs, 2))

#Define plot_ feature_ The importance function is used to draw the importance of the feature
def plot_feature_importances(feature_importances, title, feature_names):
    #Standardize importance
    feature_importances = 100.0 * (feature_importances/ max(feature_importances))
    #Ranking scores from high to low
    index_sorted = np.flipud(np.argsort(feature_importances))
    #Center the label on the x axis
    pos = np.arange(index_sorted.shape[0]) + 0.5
    #Draw a bar chart
    plt.figure()
    plt.bar(pos, feature_importances[index_sorted], align= 'center')
    plt.xticks(pos, feature_names[index_sorted])
    plt.ylabel('Relative Importance')
    plt.title(title)
    plt.show()

#Draw the relative importance of the feature
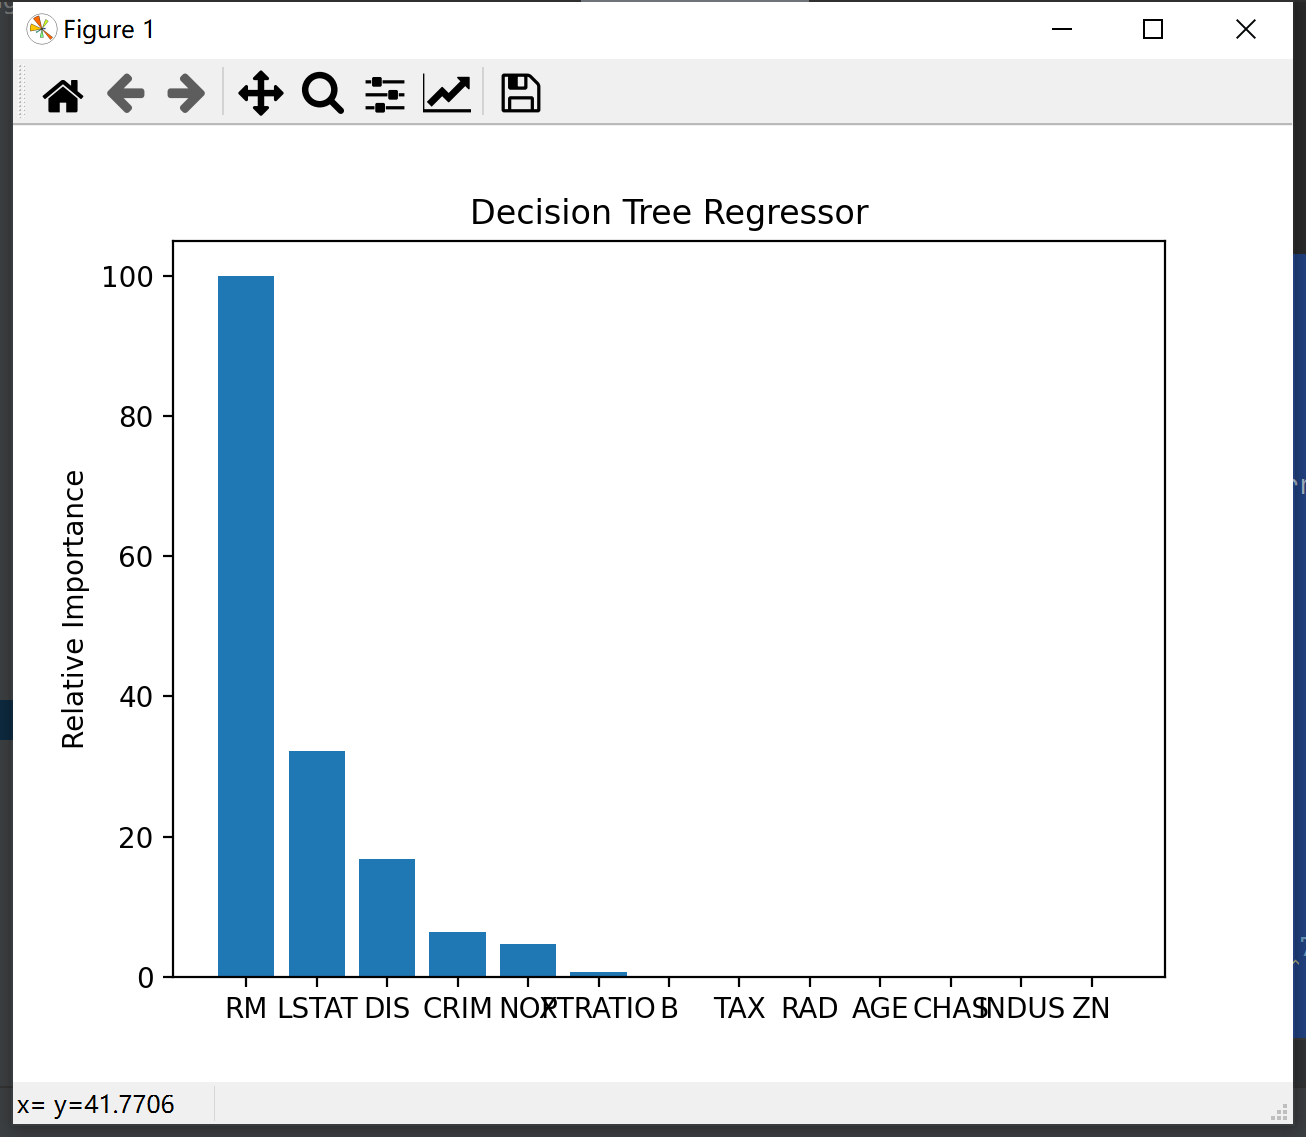
plot_feature_importances(dt_regressor.feature_importances_, 'Decision Tree Regressor',
                         housing_data.feature_names)
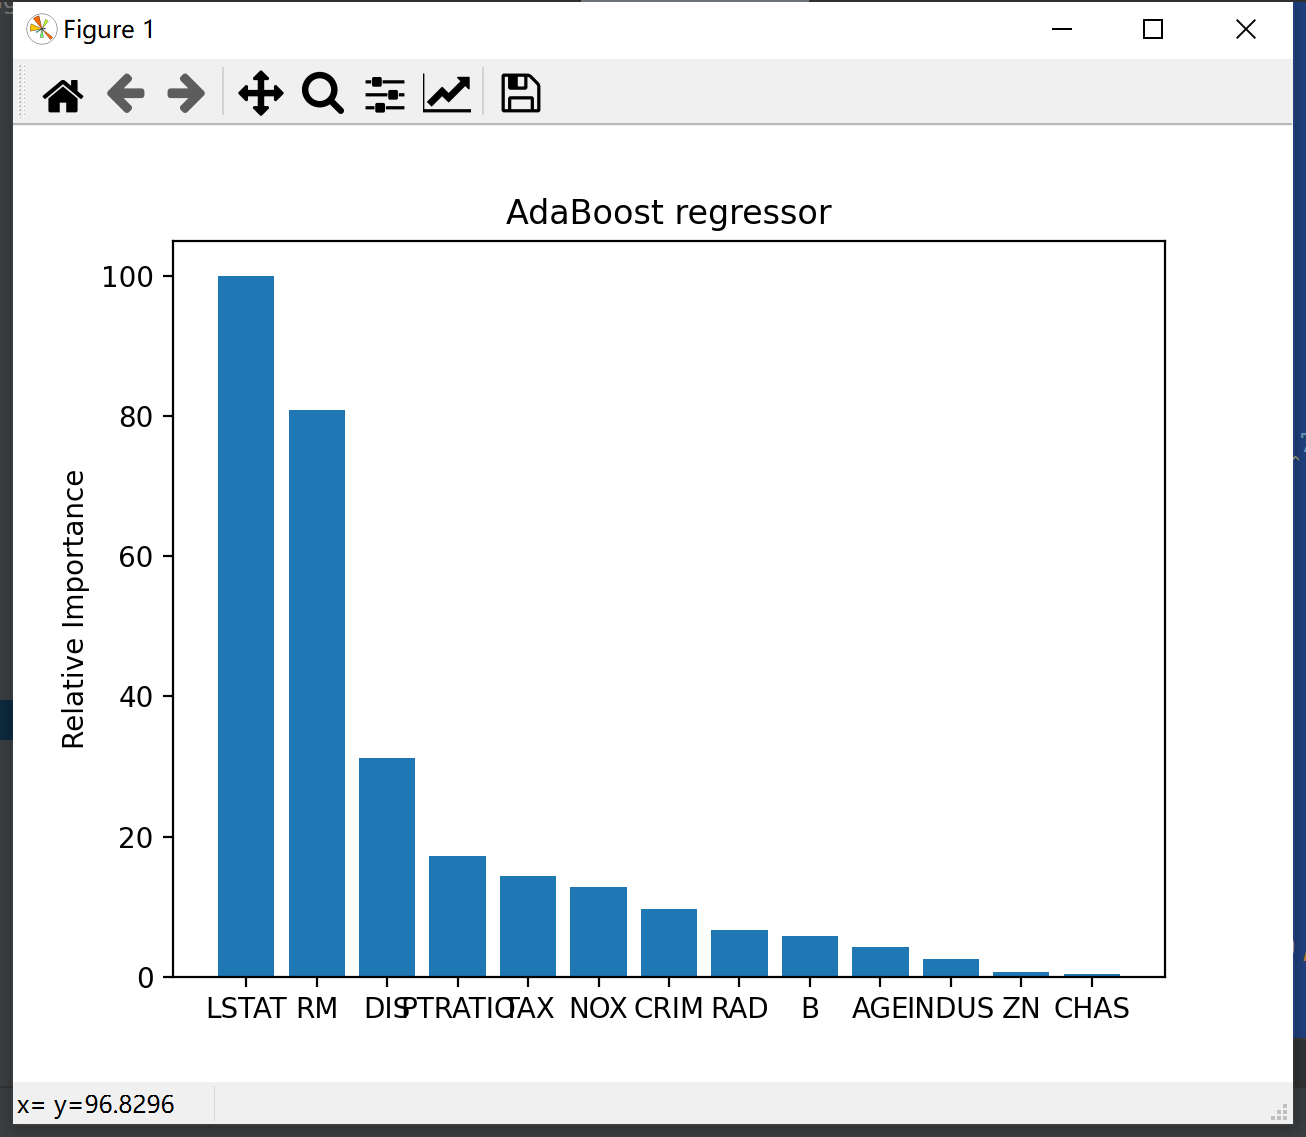
plot_feature_importances(ab_regressor.feature_importances_, 'AdaBoost regressor',
                         housing_data.feature_names)
result


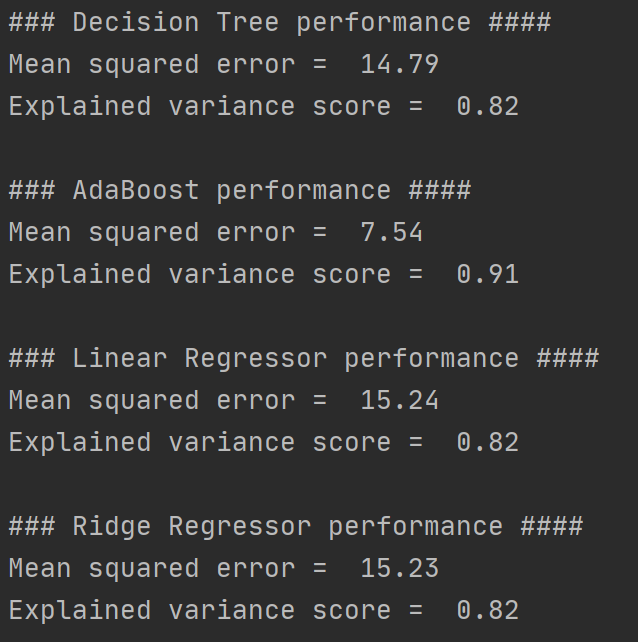
It can be seen that after using AdaBoost to optimize the decision tree model, the mean square error is smaller, and the interpretation variance score is closer to 1. The results of linear regression and ridge regression are the worst, and they are close.
To facilitate your study, please post a few links:
- AdaBoost
- Decision tree
- Mean square error MSE
- The releasable variance score EVS didn't find a good link. Please check it yourself.
epilogue
I went to dinner. I'll be sure next time