1, Competition introduction
Kaggle's table amusement park will have new competitions on the 1st of each month since 2021. What small gifts should the prizes be? The official meaning is to hold competitions for beginners. However, here you can see the thinking ideas and handling methods of experts, which is indeed a lot of income.
 https://www.kaggle.com/c/tabular-playground-series-feb-2022/overview
1,Tabular Playground Series - Feb 2022
For the form playground series competition in February 2022, your task is to classify 10 different bacterial species using data from genome analysis technology, which has some data compression and data loss. In this technique, 10 mer DNA fragments are sampled and analyzed to give a histogram of base counts. Can you use this damaging information to accurately predict bacterial species?
2. Verify
Finally, submit the csv in the following format. The first column is id, which is in the test data. The second column is the classification of forecasts. The submission format of the competition is csv file, and the format is as follows:
row_id,target
200000,Streptococcus_pneumoniae
200001,Enterococcus_hirae
II. Data set description
For this challenge, you will predict bacterial species based on repeated lossy measurements of DNA fragments. The fragment with length of 10 is analyzed by Raman spectrum, which calculates the histogram of bases in the fragment.
Each row of data contains a histogram generated by repeated measurement samples, each row contains the output of all 286 histogram possibilities, and then the deviation spectrum (completely random) is subtracted from the result.
The data (training and testing) also contains simulated measurement errors (rate of change) of many samples, which makes the problem more challenging.
- train.csv - training set, which contains the 10 mer square map of each sample
- test.csv - test set; Your task is to predict the target row of each bacterium_ id
- sample_submission.csv - sample submission file with correct format
1. Training data set
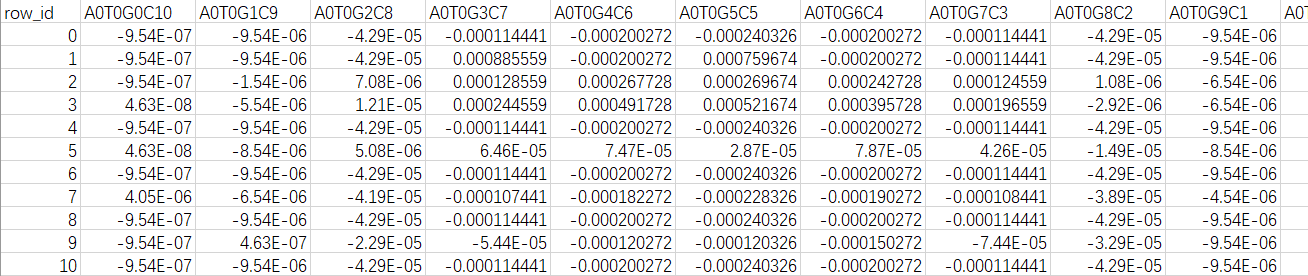
The training data provides 20w pieces of data, including row_id is not important. There are 286 columns of attributes, and the last column is classification. There are 10 categories in total (see the following table for an example).
2. Data set to be predicted
There are 10w pieces of data to be tested, and its classification needs to be predicted.
3, Using support vector machine
Support Vector Machine (SVM) is a powerful and comprehensive machine learning model. It can perform linear or nonlinear classification, regression, and even outlier detection tasks. It is one of the most popular models in the field of machine learning. SVM is especially suitable for the classification of small and medium-sized complex data sets.
1. Training code reference
Use the support vector machine SVM in sklearn library to train and get a preliminary reference.
from sklearn import svm
from sklearn.model_selection import train_test_split
import numpy as np
import pandas as pd
import pickle

# Read the training data and labels, and manually divide the two csv
data = pd.read_csv('data/train_data.csv')
label = pd.read_csv('data/train_label.csv')
# normalization
data = (data - data.min()) / (data.max() - data.min())

trains = data.to_numpy()
labels = label.target

# Divide the training and test data sets by 9:1
x_train, x_test, y_train, y_test = train_test_split(trains, labels, random_state=1, train_size=0.9)

# Creating and training models
clf = svm.SVC(C=0.8, kernel='rbf', gamma=20, decision_function_shape='ovr')
clf.fit(x_train, y_train.ravel())

# Save model
s=pickle.dumps(clf)
f=open('svm_v3.model', "wb+")
f.write(s)
f.close()
2. Test code reference
After you get the csv, add row_ The ID column (which can also be handled in code) is submitted to kaggle.
from sklearn import svm
from sklearn.model_selection import train_test_split
import numpy as np
import pandas as pd
import pickle

# Classification dictionary,
week_day_dict = {
    0 : 'Streptococcus_pyogenes',
    1 : 'Salmonella_enterica',
    2 : 'Enterococcus_hirae',
    3 : 'Escherichia_coli',
    4 : 'Campylobacter_jejuni',
    5 : 'Streptococcus_pneumoniae',
    6 : 'Staphylococcus_aureus',
    7 : 'Escherichia_fergusonii',
    8 : 'Bacteroides_fragilis',
    9 : 'Klebsiella_pneumoniae',
}

# Read svm model
f2=open('svm.model','rb')
s2=f2.read()
model1=pickle.loads(s2)

# Read test set
data = pd.read_csv('data/test.csv')
data = (data - data.min()) / (data.max() - data.min())
test_X = data.to_numpy()

# Make predictions
predictions = model1.predict(test_X)

# Read as label
preds = []
for pred in predictions:
    preds.append(week_day_dict[pred])

# Write csv
res = pd.DataFrame()
res['target'] = preds
res.to_csv("predict_svm_v2.csv")
The scores are as follows. The accuracy is very low. Next, test other models.
