data
Jack cherish notes
Machine learning practice
kNN
step
1 calculate the distance between the unknown point and the sample
2 distance increasing sort
3 select the first K samples according to the sorting results
4 determine the occurrence frequency of the first k samples
5 the category of the point with the highest frequency is the result
Knowledge points
1
axis=0  #Press row down
axis=1 #Press right by column
2 returns the sorted index
In [23]:
dist.argsort()
Out[21]:
array([2, 3, 1, 0], dtype=int64)
In [23]:
dist.argsort()[:2]
Out[23]:
array([2, 3], dtype=int64)
Insert the code slice here
3 Statistical sorting
import collections
In [33]:
collections.Counter(k_labels)
Out[33]:
Counter({'B': 2})
In [38]:
collections.Counter(k_labels).most_common(1) #Get the element with the highest frequency
Out[38]:
[('B', 2)]
In [41]:
collections.Counter(k_labels).most_common(1)[0]
Out[41]:
('B', 2)
In [42]:
collections.Counter(k_labels).most_common(1)[0][0]
Out[42]:
'B'
Simple kNN algorithm
def classify0(inx,dataset,labels,k):
    #1 calculate distance
    dist=np.sum((inx-dataset)**2,axis=1)*0.5
    #Sort from small to large, return the index, and determine the nearest K tags through the index
    k_labels=[labels[index] for index in dist.argsort()[0:k]]
    #Select the top K tags with the highest frequency
    label=collections.Counter(k_labels).most_common(1)[0][0]
    return label
Helen date
Read txt file
Method 1: open
fr=open('data/datingTestSet.txt')
fr.readlines()[0] #According to the reading result, it can be divided with \ t
>> '40920\t8.326976\t0.953952\tlargeDoses\n'
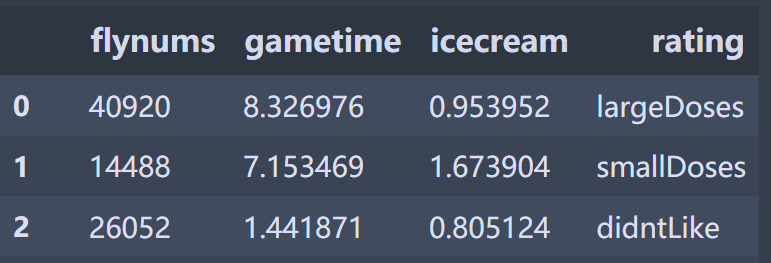
Method 2: pandas (unfamiliar)
Using read_csv can read the txt file, set sep as the separator, and specify the attribute name with names. Otherwise, the first line of data is the attribute name by default
df=pd.read_csv('data/datingTestSet.txt',sep='\t',names=["flynums","gametime","icecream","rating"])

#The first three columns are characteristic matrices
X_raw=df.iloc[:,[0,1,2]] #Take some columns and use iloc index method
#Obtained X_raw is a dataframe format
X_raw=X_raw.values #dataframe to ndarray
#Y is the same as X
String category format needs to be converted to number format
Use LabelEncoder tags to process as numbers
from sklearn.preprocessing import LabelEncoder
y=LabelEncoder().fit_transform(Y_raw.flatten()) #Use flatten to stretch the second-order matrix to one dimension
Y_raw
>>array([['largeDoses'],
       ['smallDoses'],
       ['didntLike'],
       ['didntLike'],
       ['didntLike'],

Y_raw.flatten()[:5]
>>array(['largeDoses', 'smallDoses', 'didntLike', 'didntLike', 'didntLike'],dtype=object)

y[:5]
>> array([1, 2, 0, 0, 0])
matplotlib displays Chinese garbled code
import matplotlib.pyplot as plt
#Display Chinese
plt.rcParams['font.sans-serif'] = [u'SimHei']
plt.rcParams['axes.unicode_minus'] = False
Matplotlib drawing
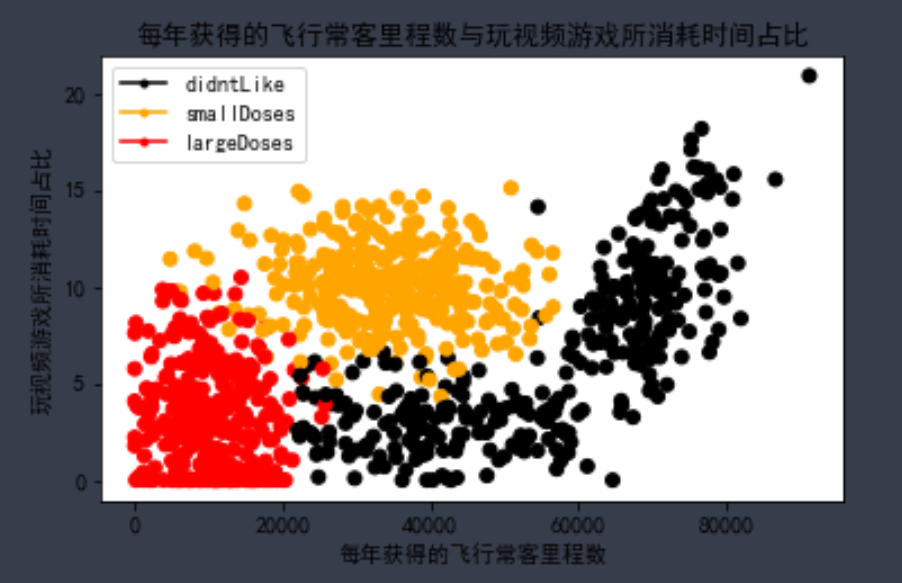
Target: 3 attributes in total, corresponding to 3 labels. Now set up three subgraphs to display the relationship between two attributes and three tags respectively. Three labels need to be identified with different colors and a legend is displayed
Those found on the Internet can only be drawn once to display three colors, but to distinguish the legend is to draw three pictures again and set the legend again. The current method only uses mline for what Jack did.
#Set 4 subgraphs
fig,ax=plt.subplots(nrows=2,ncols=2,sharex=False,sharey=False,figsize=(13,8))
LabelsColors=[]
for i in y :
    if i==0:
        LabelsColors.append("black")
    if i==1:
        LabelsColors.append("orange")
    if i==2:
        LabelsColors.append("red")
#The color array corresponding to each point is generated according to the value of Y
print(LabelsColors[:5])
ax[0][0].scatter(X_raw[:,0],X_raw[:,1],color=LabelsColors)
ax[0][0].set_xlabel("Frequent flyer miles per year")
ax[0][0].set_ylabel("Percentage of time spent playing video games")
ax[0][0].set_title("Proportion of frequent flyer mileage obtained each year and time spent playing video games")
#Set legend (learn jack)
didntLike = mlines.Line2D([], [], color='black', marker='.',markersize=6, label='didntLike')
smallDoses = mlines.Line2D([], [], color='orange', marker='.',markersize=6, label='smallDoses')
largeDoses = mlines.Line2D([], [], color='red', marker='.',markersize=6, label='largeDoses')
#Add legend
ax[0][0].legend(handles=[didntLike,smallDoses,largeDoses])
plt.show
The other two figures are omitted
Not familiar with Matplotlib, there is no better way
Mean normalization
Because the difference between the values of the three attributes is too large, it needs to be normalized.
method:
Use new=(old - min) / (max -min) to normalize the value to 0-1
Use new=(old - u) / (max -min) to normalize the value to - 1-1 (u is the mean)
be careful
Finding the maximum and minimum value is to find the minimum value of an attribute, not the minimum value of three attributes of a sample. That is, vertical evaluation, not horizontal evaluation. axis=0 press down
def autoNorm(X_raw):
    minL=X_raw.min(0)
    maxL=X_raw.max(0)
    ranges=maxL-minL
    meanL=X_raw.mean(0)
    return (X_raw-meanL)/(maxL-minL),ranges
test
To use another file in Jupyter, just run it
%run kNN.ipynb #Method of referencing another file
Use 90% as training set and 10% as test set
Digital recognition
First, observe the data.
The data given is quite large,
The digits folder is divided into training digits and testDigits folders. Use labels for each folder_ Label naming. The pattern is a number consisting of 0 and 1.
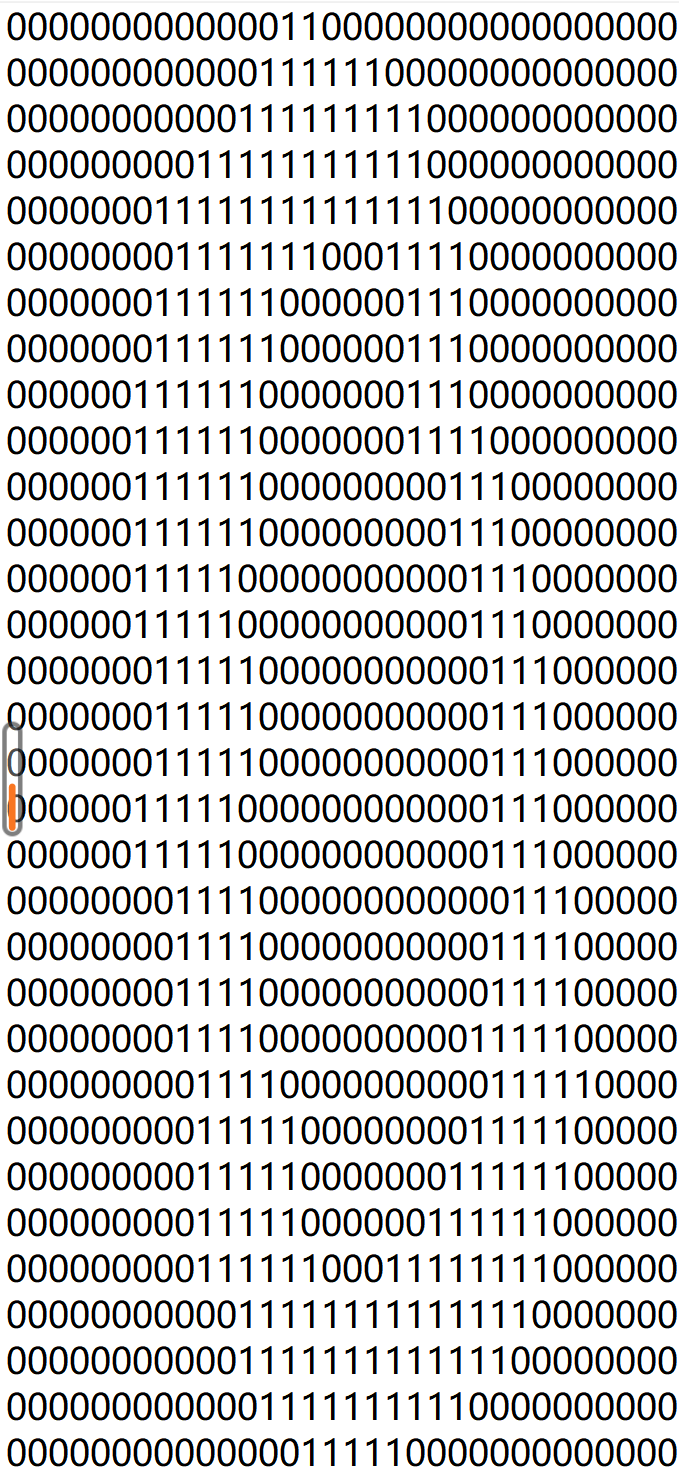
The image is 3232 in size and needs to be expanded to 11024 in size.
The method is to set a 1 * 1024 0 matrix first. Then read each line and pass the characters of each line to the matrix.
fr= open('data/digits/trainingDigits/0_0.txt')
returnVect=np.zeros((1,1024))
for i in range(32):
    lineStr=fr.readline()
    for j in range(32):
        returnVect[0,32*i+j]=int(lineStr[j])

def img2vector(filename):
  returnVect=np.zeros((1,1024))
  fr=open(filename)
  for i in range(32):
      lineStr=fr.readline()
      for j in range(32):
          returnVect[0,32*i+j]=int(lineStr[j])
  return returnVect
algorithm
Method 1: use the simple kNN algorithm written by yourself
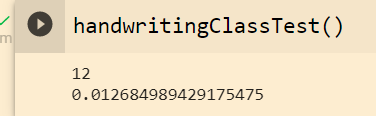
def handwritingClassTest:
	#Separate labels by file name
    trainLabels=[]
    ##Returns the file name in the trainingDigits directory
    trainingFileList=listdir("trainingDigits")
    m=len(trainingFileList)
    trainingMat=np.zeros((m,1024))
    for i in range(m):
        fileNameStr=trainingFileList[i]
        #Separate suffixes first
        fileStr=fileNameStr.split('.')[0]
        #Repartition label
        classNumStr=int(fileStr.split('_')[0])
        trainLabels.append(classNumStr)
        #Characteristic matrix
        trainingMat[i,:]=img2vector('trainingDigits/%s' %fileNameStr)
    testFileList=listdir('testDigits')
    errorCount=0
    mTest=len(testFileList)
    for i in range(mTest):
        fileNameStr=testFileList[i]
        fileStr=fileNameStr.split('.')[0]
        classNumStr=int(fileStr.split('_')[0])
        testLabels.append(classNumStr)
        testVector=img2vector('testDigits/%s' %fileNameStr)

        #Test, one data to be judged is passed in each time
        classResult=classify0(testVector,trainingMat,trainLabels,3)
        if classResult!=classNumStr :
            errorCount+=1

    print(errorCount)
    print(errorCount/mTest)
Method 2: use the kNeighborsClassifiers provided by sklearn
from sklearn.neighbors import KNeighborsClassifier as kNN

def handwritingClassTest:
    testLabels=[]
    trainLabels=[]
    trainingFileList=listdir("trainingDigits")
    m=len(trainingFileList)
    trainingMat=np.zeros((m,1024))
    for i in range(m):
        fileNameStr=trainingFileList[i]
        fileStr=fileNameStr.split('.')[0]
        classNumStr=int(fileStr.split('_')[0])
        trainLabels.append(classNumStr)
        trainingMat[i,:]=img2vector('trainingDigits/%s' %fileNameStr)

    #Construct a kNN classifier. Algorithm is an algorithm for finding adjacent points. auto is the default, and the most appropriate one is determined by the algorithm itself
    neigh=kNN(n_neighbors=3,algorithm='auto')
    #Fitting model
    neigh.fit(trainingMat,trainLabels)

    testFileList=listdir('testDigits')
    errorCount=0
    mTest=len(testFileList)
    for i in range(mTest):
        fileNameStr=testFileList[i]
        fileStr=fileNameStr.split('.')[0]
        classNumStr=int(fileStr.split('_')[0])
        testLabels.append(classNumStr)
        testVector=img2vector('testDigits/%s' %fileNameStr)

        #Return forecast results
        classResult=neigh.predict(testVector)
        if classResult!=classNumStr :
            errorCount+=1

    print(errorCount)
    print(errorCount/mTest)
Just run super slow