1.Matplotlib Library
1.1Matplotlib features
- matplotlib is the most commonly used drawing module in python
- The Pyplot sub module of matplotlib is very similar to MATLAB. It can easily draw various common statistical graphics. It is an important graphic tool for users to conduct exploratory data analysis
- You can set the graph title, line style, character shape, color, axis attribute and font attribute in the graph through various functions
1.2 python drawing (I)
excel file link used:
Link: https://pan.baidu.com/s/1ZIKRM6YBuDyLBtBsczBHYQ Extraction code: z9dx
import numpy as np
import pandas as pd
import matplotlib.pyplot as plt

%matplotlib inline
plt.rcParams['font.sans-serif']=['SimHei']   #Solve the problem of Chinese garbled code
plt.rcParams['axes.unicode_minus']=False

data = pd.read_excel('C:\\Users\\adins\\Desktop\\Beijing air quality data.xlsx')
data.replace(0,np.NaN)

plt.figure(figsize=(10,5))
plt.plot(data['AQI'],color='black',linestyle='-',linewidth=0.5)
plt.axhline(y=data['AQI'].mean(),color='red',linestyle='-',linewidth=0.5,label='AQI Total average')
data['year']=data['date'].apply(lambda x:x.year)
AQI_mean=data['AQI'].groupby(data['year']).mean().values
year = ['2014 year','2015 year','2016 year','2017 year','2018 year','2019 year']
col = ['red','blue','green','yellow','purple','brown']
for i in range(6):
    plt.axhline(y=AQI_mean[i],color=col[i],linestyle='--',linewidth=0.5,label=year[i])
plt.title('2014 To 2019 AQI Time series line chart')
plt.xlabel('particular year')
plt.ylabel('AQI')
plt.xlim(xmax=len(data),xmin=1)
plt.ylim(ymax=data['AQI'].max(),ymin=1)
plt.yticks([data['AQI'].mean()],['AQI average value'])
plt.xticks([1,365,365*2,365*3,365*4,365*5],['2014','2015','2016','2017','2018','2019'])
plt.legend(loc='best')
plt.text(x=list(data['AQI']).index(data['AQI'].max()),y=data['AQI'].max()-20,s='Worst air quality day',color='red')
plt.show()
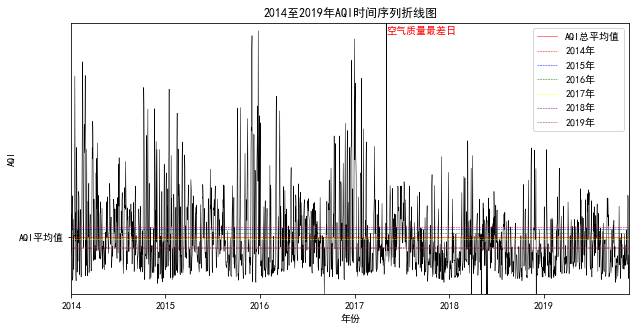
results of enforcement

Code interpretation
%matplotlib inline is a magic function of IPython, which can be used directly in the IPython compiler. Its function is to embed drawing and omit PLT Show() to display the image directly. If we don't add this sentence, we need to add PLT after drawing Show() to display the image.
plt.figure() describes the general features of the figure. For example, the width and height here are (10,5)
plt.plot() draws a sequence line chart (or other graphics), and specifies the color, line, width, etc. of the graphics
plt.axhline() draws a straight line parallel to X at the specified position of Y axis. When the parameter is x, it means to draw a straight line parallel to y at the specified position of X axis
plt.title() specifies the title of the graph
plt.xlabel(),plt.ylabel() specifies the abscissa and ordinate labels of the graph
plt.xlim(),plt.ylim() specifies the value range of the horizontal and vertical coordinates
plt.yticks(),plt.xticks() specifies the scale of the horizontal and vertical coordinates and gives the scale label
plt.legend() displays the legend at the specified position, 'best' indicates the optimal position
plt.text() displays the specified text at the specified x and y coordinates
plt.show() indicates the end of this drawing
1.3Python drawing (II)
import warnings
warnings.filterwarnings(action = 'ignore')
plt.figure(figsize=(10,5))
plt.subplot(2,2,1)
plt.plot(AQI_mean,color='black',linestyle='-',linewidth=0.5)
plt.title('Each year AQI Mean line chart')
plt.xticks([0,1,2,3,4,5],['2014','2015','2016','2017','2018','2019'])
plt.subplot(2,2,2)
plt.hist(data['AQI'],bins=20)
plt.title('AQI histogram')
plt.subplot(2,2,3)
plt.scatter(data['PM2.5'],data['AQI'],s=0.5,c='green',marker='.')
plt.title('PM2.5 And AQI Scatter diagram')
plt.xlabel('PM2.5')
plt.ylabel('AQI')
plt.subplot(2,2,4)
tmp=pd.value_counts(data['Quality grade'],sort=False)       #Equivalent to tem=data ['quality grade'] value_counts()
share = tmp/sum(tmp)
labels = tmp.index
explode = [0,0.2,0,0,0,0.2,0]
plt.pie(share,explode=explode,labels=labels,autopct='%3.1f%%',startangle=180,shadow=True)
plt.title('Pie chart of overall air quality')
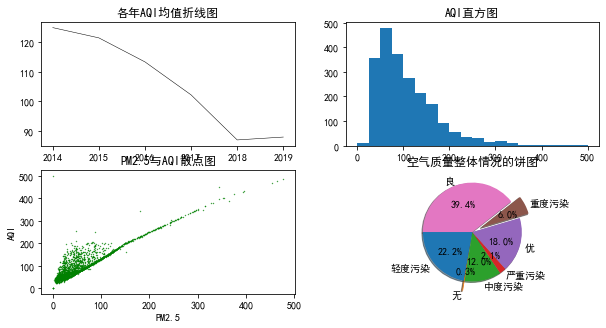
results of enforcement

Code interpretation
plt.subplot(2,2,1) divides the drawing area into two rows and two columns, and the next figure is drawn in the first cell
plt.subplot(2,2,2) the next picture is drawn in the second unit
plt.hist(data['AQI'],bins=20) draws the histogram and displays it in 20 column bars
plt.scatter(data['PM2.5'],data['AQI'],s=0.5,c='green',marker ='. ') draws a scatter diagram, s specifies the size, c specifies the color, and marker specifies the shape
plt.pie(share,explode=explode,labels=labels,autopct='%3.1f%%',startangle=180,shadow=True)
Draw a pie chart, share specifies the proportion of each component, expand specifies the distance (highlighted) from the center of the pie chart, labels specifies the label of each component, autopct specifies the data display format, startangle specifies the starting position of the discharge of the first component, and shadow=True indicates the use of shadow
1.4 Python drawing (III)
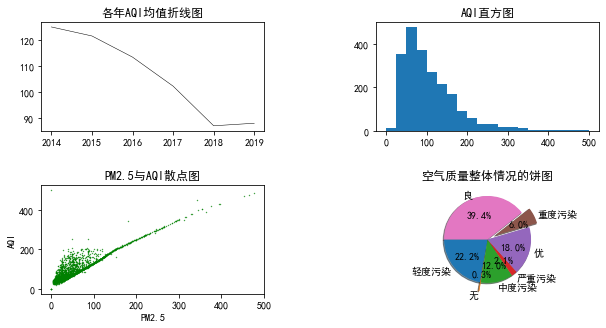
There are overlapping parts in the subgraph of the above figure. You can choose to enlarge the shape to avoid overlapping, or you can set the boundary distance as follows
fig,axes= plt.subplots(nrows=2,ncols=2,figsize=(10,5))
axes[0,0].plot(AQI_mean,color='black',linestyle='-',linewidth=0.5)
axes[0,0].set_title('Each year AQI Mean line chart')
axes[0,0].set_xticks([0,1,2,3,4,5])
axes[0,0].set_xticklabels(['2014','2015','2016','2017','2018','2019'])

axes[0,1].hist(data['AQI'],bins=20)
axes[0,1].set_title('AQI histogram')

axes[1,0].scatter(data['PM2.5'],data['AQI'],s=0.5,c='green',marker='.')
axes[1,0].set_title('PM2.5 And AQI Scatter diagram')
axes[1,0].set_xlabel('PM2.5')
axes[1,0].set_ylabel('AQI')

axes[1,1].pie(share,explode=explode,labels=labels,autopct='%3.1f%%',startangle=180,shadow=True)
axes[1,1].set_title('Pie chart of overall air quality')

fig.subplots_adjust(hspace=0.5)
fig.subplots_adjust(wspace=0.5)
results of enforcement

Code interpretation
fig,axes= plt.subplots(nrows=2,ncols=2,figsize=(10,5)) divides a graph of (10,5) size into two rows and two columns, and obtains two objects. The fig object sets the characteristics of the whole graph, and the axes object corresponds to each cell object
The drawing cell is specified by drawing cell index. axes[0,0] represents the first cell and axes[0,1] represents the second cell
The graph title, label, scale, etc. of the cell object need to be determined by set_title,set_xlabel,set_xticks,set_xticklabels settings
fig.subplots_adjust(hspace=0.5)
fig.subplots_adjust(wspace=0.5) adjusts the row column distance of each graph