Task03
This study refers to Datawhale open source learning: https://github.com/datawhalechina/fantastic-matplotlib
The content is generally derived from the original text and adjusted in combination with their own learning ideas.
Personal summary: 1. Use plt.subplots and GridSpec to draw uniform and non-uniform subgraphs respectively. Both methods create an ax and then draw, which belongs to "Object-Oriented" drawing. The difference is that plot. Plot () directly "quickly" draws. 2, Ax object defines a graph drawing function similar to PLT. Commonly used are: plots, hist, scatter, bar, barh, pie, axhline, axvline, axline, legend, annotate, arrow, text, etc.
3. Layout format
3.1. Subgraph
3.1.1. Use plt.subplots to draw subgraphs in uniform state
plt.subplots(nrows=1, ncols=1, *, sharex=False, sharey=False, squeeze=True, subplot_kw=None, gridspec_kw=None, **fig_kw)
How many rows does the nrows subgraph consist of
How many columns does ncols subgraph consist of
The figsize parameter specifies the size of the entire canvas
sharex and sharey indicate whether horizontal and vertical scales are shared, respectively
import numpy as np
import pandas as pd
import matplotlib.pyplot as plt
plt.rcParams['font.sans-serif'] = ['SimHei']   #Used to display Chinese labels normally
plt.rcParams['axes.unicode_minus'] = False   #Used to display negative signs normally

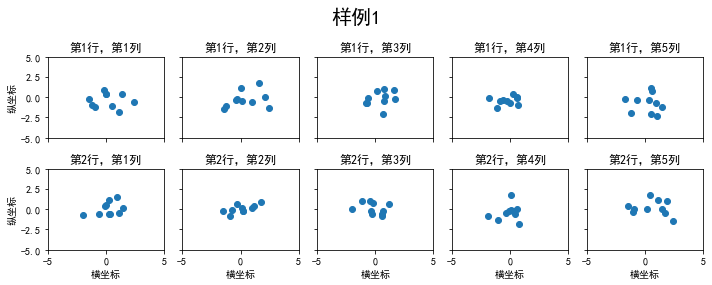
fig, axs = plt.subplots(2, 5, figsize=(10, 4), sharex=True, sharey=True)
fig.suptitle('Example 1', size=20)
for i in range(2):
    for j in range(5):
        axs[i][j].scatter(np.random.randn(10), np.random.randn(10))
        axs[i][j].set_title('The first%d OK, No%d column'%(i+1,j+1))
        axs[i][j].set_xlim(-5,5)
        axs[i][j].set_ylim(-5,5)
        if i==1: axs[i][j].set_xlabel('Abscissa')
        if j==0: axs[i][j].set_ylabel('Ordinate')
fig.tight_layout()
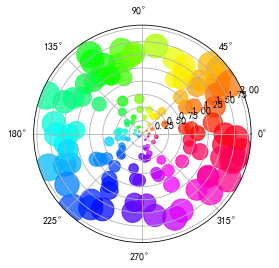
In addition to the conventional rectangular coordinate system, you can also create charts in polar coordinate system through the projection method
N = 150
r = 2 * np.random.rand(N)
theta = 2 * np.pi * np.random.rand(N)
area = 200 * r**2
colors = theta

plt.subplot(projection='polar')
plt.scatter(theta, r, c=colors, s=area, cmap='hsv', alpha=0.75)
3.1.2. Use GridSpec to draw non-uniform subgraph
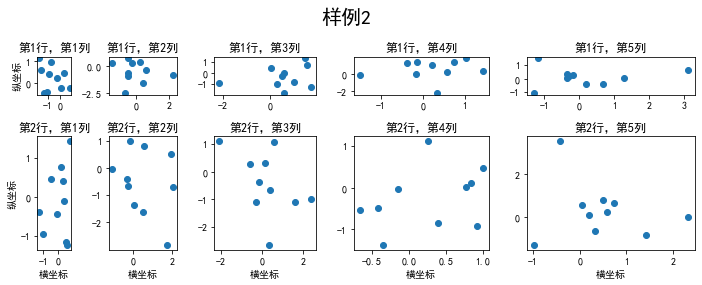
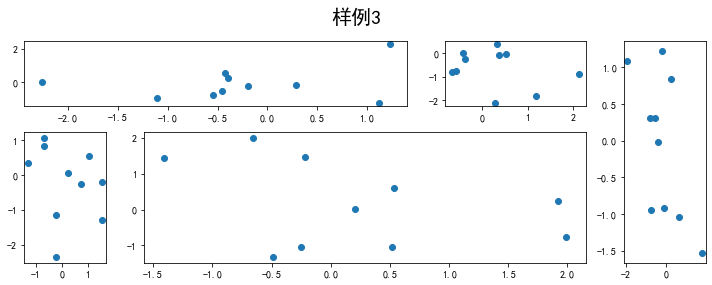
The so-called non-uniformity includes two meanings. The first refers to that the scale of the graph is different, but there is no cross row or cross column. The second refers to that the graph is cross column or cross row. Using add_gridspec can specify the relative width scale width_ratios and relative height scale parameter height_ratios
fig = plt.figure(figsize=(10, 4))
spec = fig.add_gridspec(nrows=2, ncols=5, width_ratios=[1,2,3,4,5], height_ratios=[1,3])
fig.suptitle('Example 2', size=20)
for i in range(2):
    for j in range(5):
        ax = fig.add_subplot(spec[i, j])
        ax.scatter(np.random.randn(10), np.random.randn(10))
        ax.set_title('The first%d OK, No%d column'%(i+1,j+1))
        if i==1: ax.set_xlabel('Abscissa')
        if j==0: ax.set_ylabel('Ordinate')
fig.tight_layout()
In the above example, spec[i, j] is used. In fact, the merging of subgraphs can be realized through slicing to achieve the function of cross graph
fig = plt.figure(figsize=(10, 4))
spec = fig.add_gridspec(nrows=2, ncols=6, width_ratios=[2,2.5,3,1,1.5,2], height_ratios=[1,2])
fig.suptitle('Example 3', size=20)
# sub1
ax = fig.add_subplot(spec[0, :3])
ax.scatter(np.random.randn(10), np.random.randn(10))
# sub2
ax = fig.add_subplot(spec[0, 3:5])
ax.scatter(np.random.randn(10), np.random.randn(10))
# sub3
ax = fig.add_subplot(spec[:, 5])
ax.scatter(np.random.randn(10), np.random.randn(10))
# sub4
ax = fig.add_subplot(spec[1, 0])
ax.scatter(np.random.randn(10), np.random.randn(10))
# sub5
ax = fig.add_subplot(spec[1, 1:5])
ax.scatter(np.random.randn(10), np.random.randn(10))
3.2. Drawing on subgraph
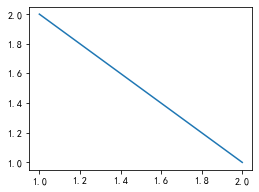
Graph drawing functions similar to plt are defined on ax objects. Commonly used are plots, hist, scatter, bar, barh and pie
fig, ax = plt.subplots(figsize=(4,3))
ax.plot([1,2],[2,1])
fig, ax = plt.subplots(figsize=(4,3))
ax.hist(np.random.randn(1000))

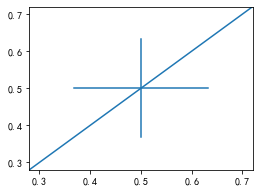
The common drawing methods of straight lines are: axhline, axvline, axline (horizontal, vertical, any direction)
fig, ax = plt.subplots(figsize=(4,3))
ax.axhline(0.5,0.2,0.8)
ax.axvline(0.5,0.2,0.8)
ax.axline([0.3,0.3],[0.7,0.7])
Use grid to add gray grid
fig, ax = plt.subplots(figsize=(4,3))
ax.grid(True)

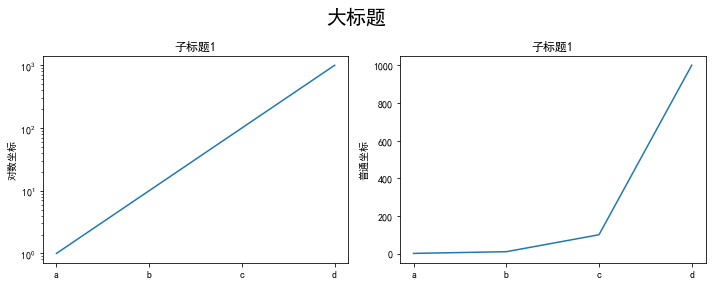
Use set_xscale, set_title, set_xlabel can set the regularity (logarithmic coordinates, etc.), title and axis name of the coordinate axis respectively
fig, axs = plt.subplots(1, 2, figsize=(10, 4))
fig.suptitle('Headline', size=20)
for j in range(2):
    axs[j].plot(list('abcd'), [10**i for i in range(4)])
    if j==0:
        axs[j].set_yscale('log')
        axs[j].set_title('Subtitle 1')
        axs[j].set_ylabel('Logarithmic coordinates')
    else:
        axs[j].set_title('Subtitle 1')
        axs[j].set_ylabel('Common coordinates')
fig.tight_layout()
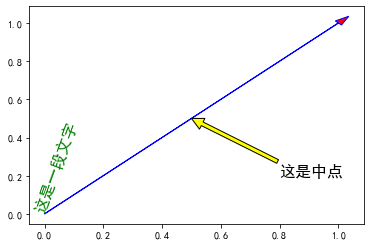
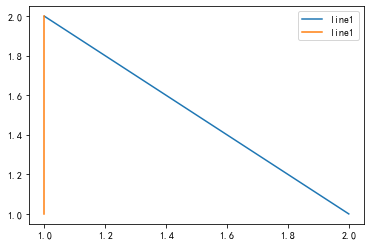
Similar to the general plt method, the legend, annotate, arrow and text objects can also be drawn accordingly
fig, ax = plt.subplots()
ax.arrow(0, 0, 1, 1, head_width=0.03, head_length=0.05, facecolor='red', edgecolor='blue')
ax.text(x=0, y=0,s='This is a text', fontsize=16, rotation=70, rotation_mode='anchor', color='green')
ax.annotate('This is the midpoint', xy=(0.5, 0.5), xytext=(0.8, 0.2), arrowprops=dict(facecolor='yellow', edgecolor='black'), fontsize=16)
fig, ax = plt.subplots()
ax.plot([1,2],[2,1],label="line1")
ax.plot([1,1],[1,2],label="line1")
ax.legend(loc=1)
mapping
- Monthly temperature in Melbourne from 1981 to 1990
import matplotlib.pyplot as plt
from matplotlib.pyplot import MultipleLocator
import pandas as pd
import numpy as np
plt.rcParams['font.sans-serif'] = ['SimHei']
plt.rcParams['axes.unicode_minus'] = False
data = pd.read_csv('data/layout_ex1.csv')

fig, axs = plt.subplots(2,5,figsize=(20,5),sharex=True,sharey=True)
fig.suptitle('Monthly temperature curve of Melbourne from 1981 to 1990',size=20)

index = 0
for i in range(2):
    for j in range(5):
        axs[i][j].plot(np.arange(1,13),data['Temperature'].values[index*12:(index*12+12)],'o-')
        axs[i][j].set_title('%s year'%data['Time'].values[index][:4])
        axs[i][j].xaxis.set_major_locator(MultipleLocator(1))
        axs[i][j].yaxis.set_major_locator(MultipleLocator(5))
        if(j==0):
            axs[i][j].set_ylabel('air temperature')
        index += 1

fig.tight_layout()

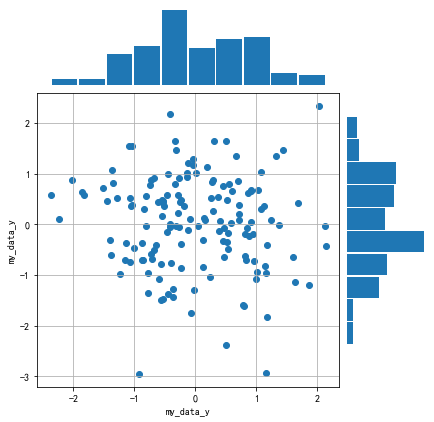
- Draw the scatter diagram and marginal distribution of the data
import matplotlib.pyplot as plt
import numpy as np

data = np.random.randn(2, 150)
fig = plt.figure(figsize=(7,7))
spec = fig.add_gridspec(9,9,width_ratios=np.ones((9)),height_ratios=np.ones((9)))

ax1 = fig.add_subplot(spec[2:9,0:7])
ax2 = fig.add_subplot(spec[0:2,0:7],sharex=ax1)
ax3 = fig.add_subplot(spec[2:9,7:9],sharey=ax1)

#Sub Figure 1
ax1.scatter(data[0],data[1])
ax1.set_ylabel('my_data_y',fontsize=10)
ax1.set_xlabel('my_data_y',fontsize=10)
ax1.grid(True)

#Subgraph 2
ax2.hist(data[0,:],rwidth=0.94)
# Hide x-axis scale
ax2.get_xaxis().set_visible(False)
# Hide y-axis scale
ax2.get_yaxis().set_visible(False)
# Close border
for spine in ax2.spines.values():
    spine.set_visible(False)

#Sub Figure 3
ax3.hist(data[0,:],rwidth=0.94, orientation='horizontal')
# Hide x-axis scale
ax3.get_xaxis().set_visible(False)
# Hide y-axis scale
ax3.get_yaxis().set_visible(False)
# Close border
for spine in ax3.spines.values():
    spine.set_visible(False)
