usage
matplotlib.pyplot.scatter(x, y, s=None, c=None, marker=None, cmap=None, norm=None, vmin=None, vmax=None, alpha=None, linewidths=None, *, edgecolors=None, plotnonfinite=False, data=None, **kwargs)
Parameter introduction
| x,y | Data for plotting scatter plots | float or array-like, shape(n,) |
|---|---|---|
| s | A real number or an array with the size of (n,), an optional parameter, refers to the size of the scatter center | flaot or array-like, shape(n,) |
| – | – | – |
| c | Scatter color | array-like or list of colors or color |
| – | – | – |
| marker | The default is' o ' | |
| – | – | – |
| cmap | Colormap instance or registered colormap name. Use cmap only if c is a floating-point array | |
| – | – | – |
| norm | It is also a color data. Use norm to scale the color data c in the range of 0 to 1 and map it to colormap cmap. If not, use the default color and normalize it | default:None |
| – | – | – |
| vmin,vmax | vmin and vmax are used with the default norm to map the color array c to the colormap cmap. If not, the minimum and maximum values of the color array are used respectively. It is wrong to use vmin/vmax when a norm is given | float, default:None |
| – | – | – |
| alpha | Transparency, numbers between 0,1 | float,default: None |
| – | – | – |
| linewidths | Line weight of the marked edge | float or array-like,default: 1.5 |
| – | – | – |
| edgecolors | Scatter edge line color | 'color of face' is not the same as' color of none ' |
| – | – | – |
| plotnonfinite | Whether points are drawn using non finite c (i.e., inf, - inf, or nan). If True, points are drawn with the wrong colormap color |
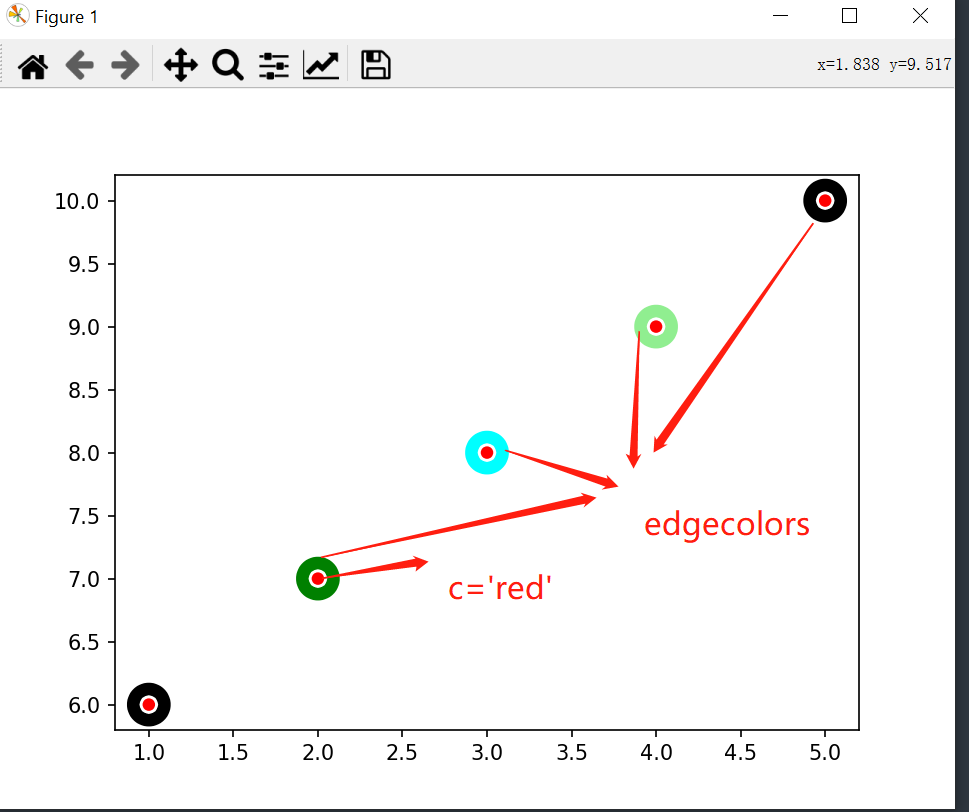
There are two parameters that I put together and use code to interpret c,edgecolors at the same time
Parameters c and edgecolors, linewidths
import matplotlib.pyplot as plt
a = [1, 2, 3, 4, 5]
b = [6, 7, 8, 9, 10]
# To show c and edgecolors, I increased the linewidths to 15
plt.scatter(a, b, linewidths=15,c='red',edgecolors=['black', 'green','cyan','lightgreen'])
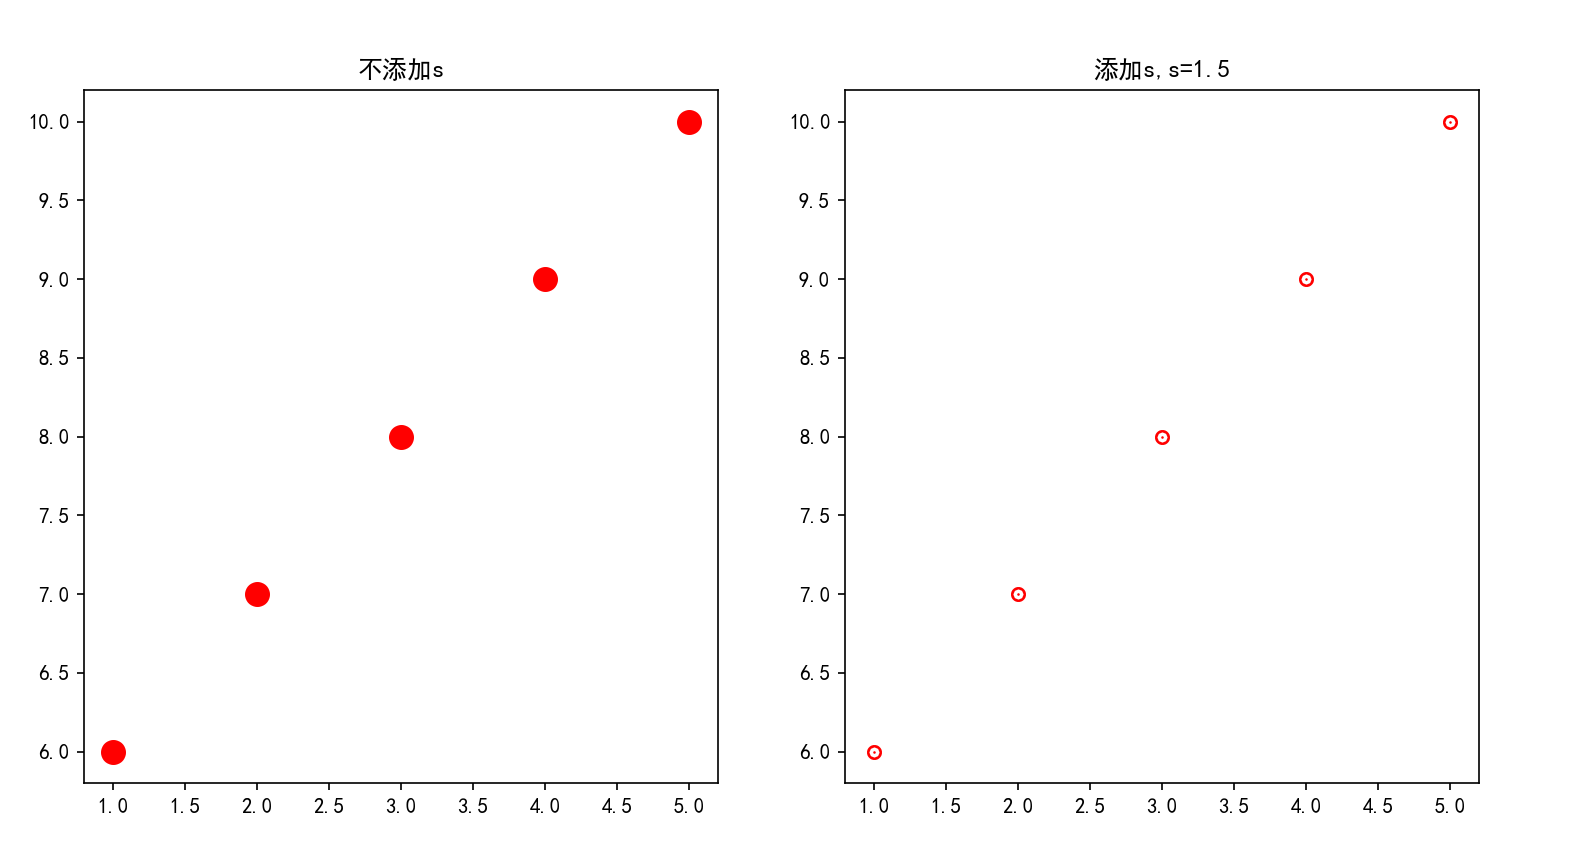
Parameter s
import matplotlib.pyplot as plt
%matplotlib inline

plt.figure(figsize=(12,6))
plt.rcParams['font.family'] = 'SimHei'

a = [1, 2, 3, 4, 5]
b = [6, 7, 8, 9, 10]
plt.subplot(121)
plt.title('Do not add s')
plt.scatter(a,b,c='red',linewidths=6)

plt.subplot(122)
plt.title('add to s,s=1.5')
plt.scatter(a,b,c='red',s=1.5,linewidths=6)
plt.show()
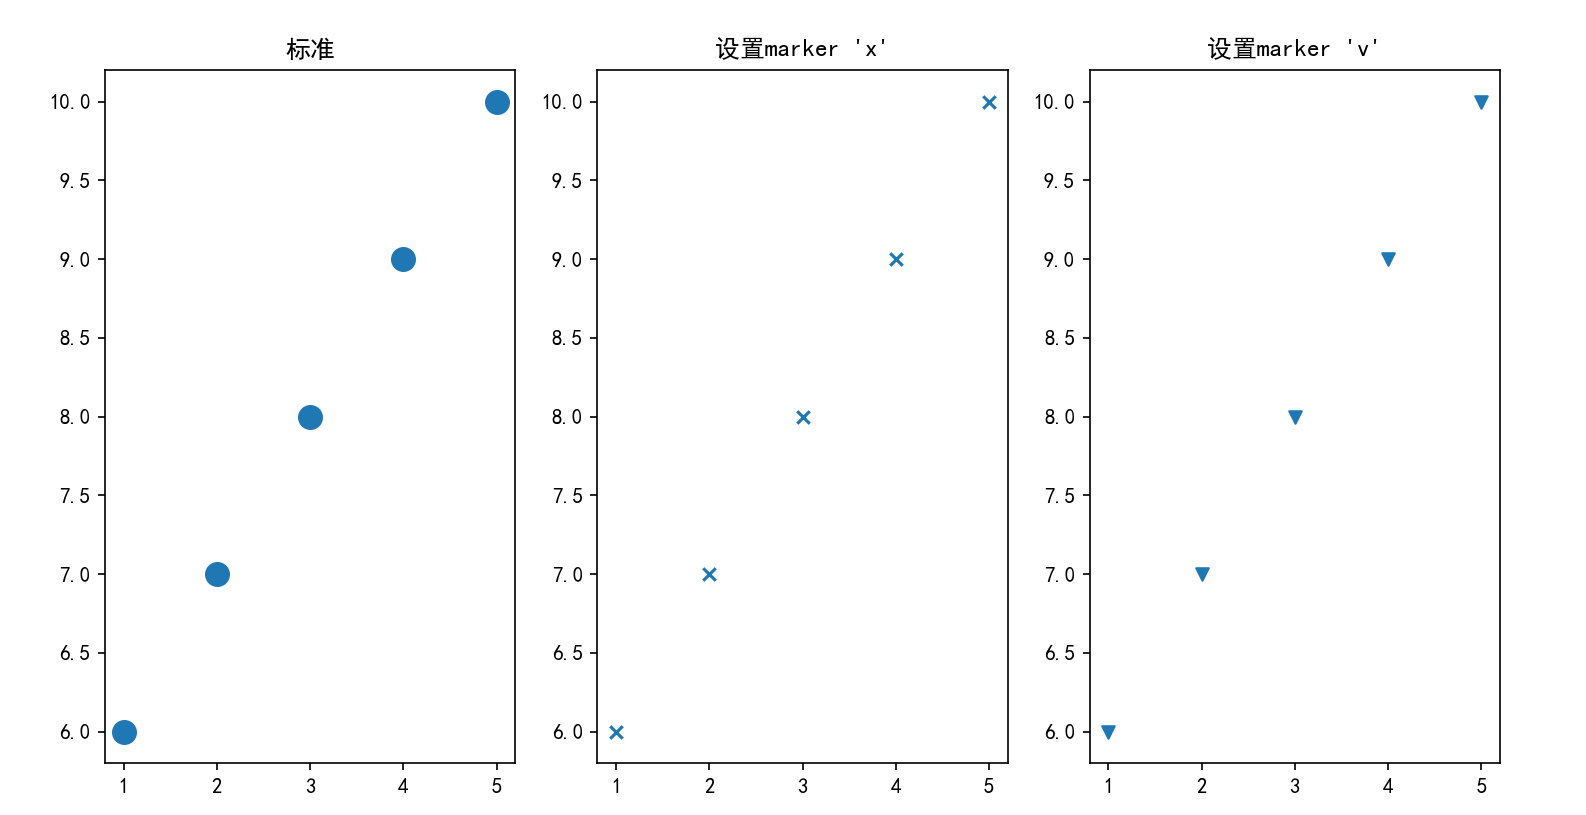
Parameter marker
import matplotlib.pyplot as plt

plt.figure(figsize=(12,6))
plt.rcParams['font.family'] = 'SimHei'

a = [1, 2, 3, 4, 5]
b = [6, 7, 8, 9, 10]
plt.subplot(131)
plt.title('standard')
plt.scatter(a,b,linewidths=6)

plt.subplot(132)
plt.title("set up marker 'x'")
plt.scatter(a,b,marker='x')

plt.subplot(133)
plt.title("set up marker 'v'")
plt.scatter(a,b,marker='v')
plt.show()
marker attribute
| marker | description |
|---|---|
| . | spot |
| – | – |
| , | Pixels, similar to squares |
| – | – |
| o | Circle, default |
| – | – |
| v | Inverted triangle |
| – | – |
| ^ | Regular triangle |
| – | – |
| < | Left triangle |
| – | – |
| > | Right triangle |
| – | – |
| 1 | tri_down |
| 2 | tri_up |
| 3 | tri_left |
| 4 | tri_right |
| 8 | Octagonal |
| s | square |
| p | Pentagonal |
| * | stars |
| h | Hex 1 |
| H | Hexagon 2 |
| + | plus |
| x | x number |
| D | Diamonds |
| d | Fine drill |
| "l" - > a vertical line | v line |
| _ | H line |
So many updates first, which will be introduced later
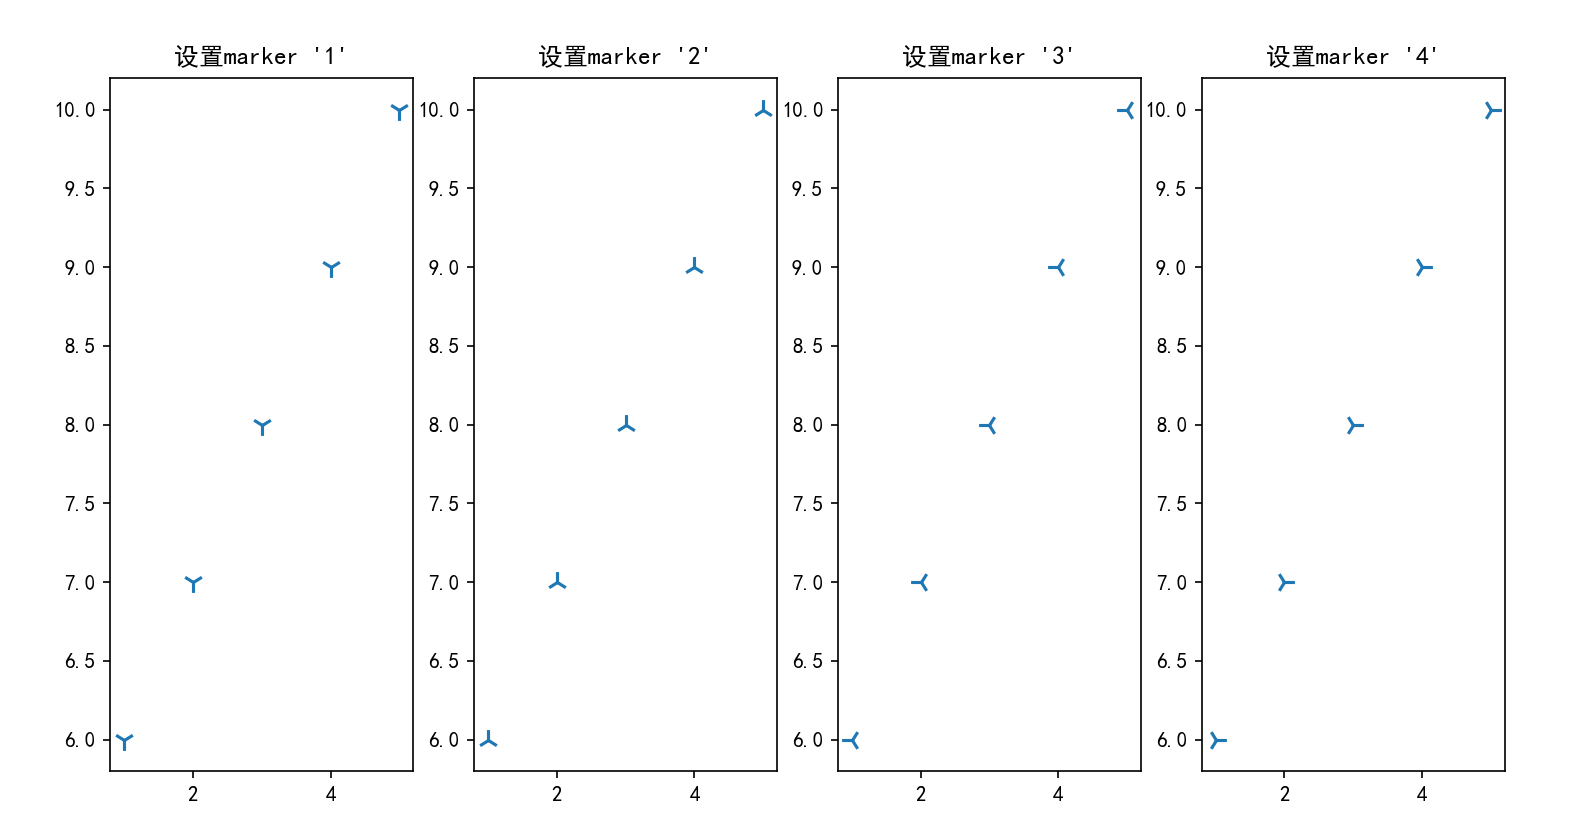
Here, maker=1 or 2 or 3 or 4 is displayed
import matplotlib.pyplot as plt

plt.figure(figsize=(12,6))
plt.rcParams['font.family'] = 'SimHei'

a = [1, 2, 3, 4, 5]
b = [6, 7, 8, 9, 10]

plt.subplot(141)
plt.title("set up marker '1'")
plt.scatter(a,b,s=100,marker='1')

plt.subplot(142)
plt.title("set up marker '2'")
plt.scatter(a,b,s=100,marker='2')

plt.subplot(143)
plt.title("set up marker '3'")
plt.scatter(a,b,s=100,marker='3')

plt.subplot(144)
plt.title("set up marker '4'")
plt.scatter(a,b,s=100,marker='4')

plt.show()
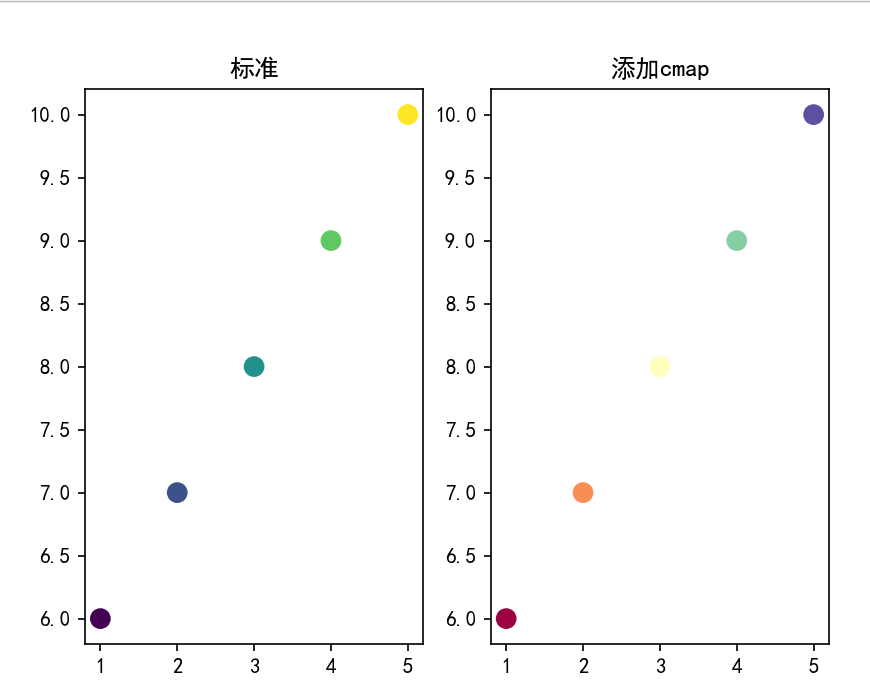
Parameter cmap
cmap is mainly used together with c parameter. c can be a color sequence, which is replaced by a number list
plt.cm.Spectral is a color mapping set, which does not mean that [0:5] represents a certain color. There are five different values for parameter c
Then assign a color to each value
import matplotlib.pyplot as plt

a = [1, 2, 3, 4, 5]
b = [6, 7, 8, 9, 10]
c = [0, 1, 2, 3, 4]
plt.rcParams['font.family'] = 'SimHei'

plt.subplot(121)
plt.title('standard')
plt.scatter(a, b, c=c, s=80)

plt.subplot(122)
plt.title('add to cmap')
plt.scatter(a, b, c=c, s=80, cmap=plt.cm.Spectral)

plt.show()
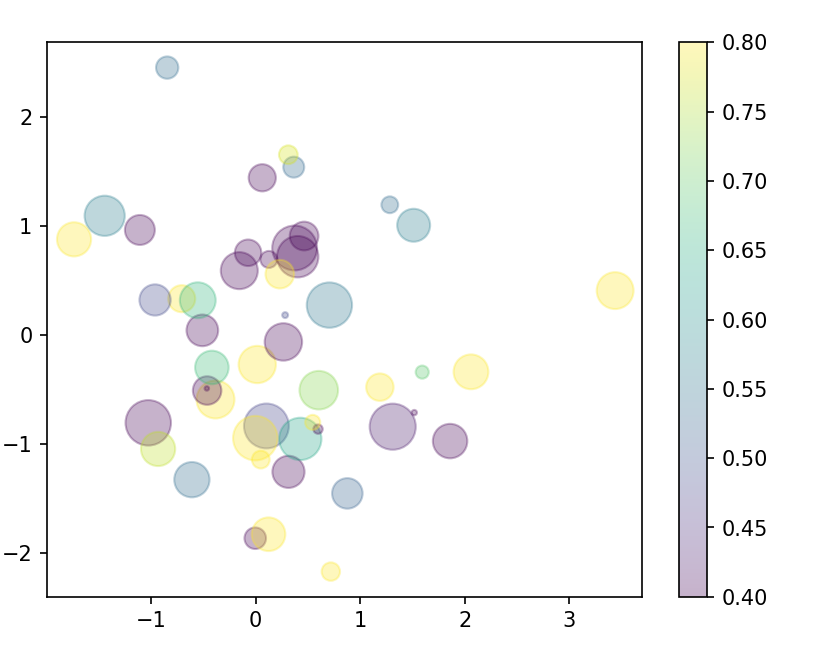
vmin,vmax,norm, scatter brightness setting, alpha transparency
plt. Colorbar
The scatter chart is set to be a bubble chart, which is shown below
import matplotlib.pyplot as plt
# Import color bar library
from matplotlib import colors
import numpy as np

x = np.random.randn(50) # Randomly generate 50 X coordinates
y = np.random.randn(50) # Randomly generate 50 Y coordinates
color = np.random.rand(50) # Randomly generate values for mapping colors
size = 500 * np.random.rand(50) # Values that randomly change the size of scatter points
changecolor = colors.Normalize(vmin=0.4, vmax=0.8)
plt.scatter(x, y, c=color, s = size, alpha=0.3, cmap='viridis', norm=changecolor)
plt.colorbar() # Show color bar
plt.show()