1. Introduction to link tracking
For a large micro-service architecture system consisting of dozens or hundreds of micro-services, the following problems are frequently encountered:
- How to connect the whole call link in series, express location problem?
- How can I distill the dependencies between micro-services?
- How to perform performance analysis for each microservice interface?
- How do I track the entire orchestration call processing sequence?
2. What is SkyWalking
skywalking is also an excellent domestic open source framework, which was opened by individual Wu Sheng (Huawei Developer) in 2015 and joined the Apache Incubator in 2017.
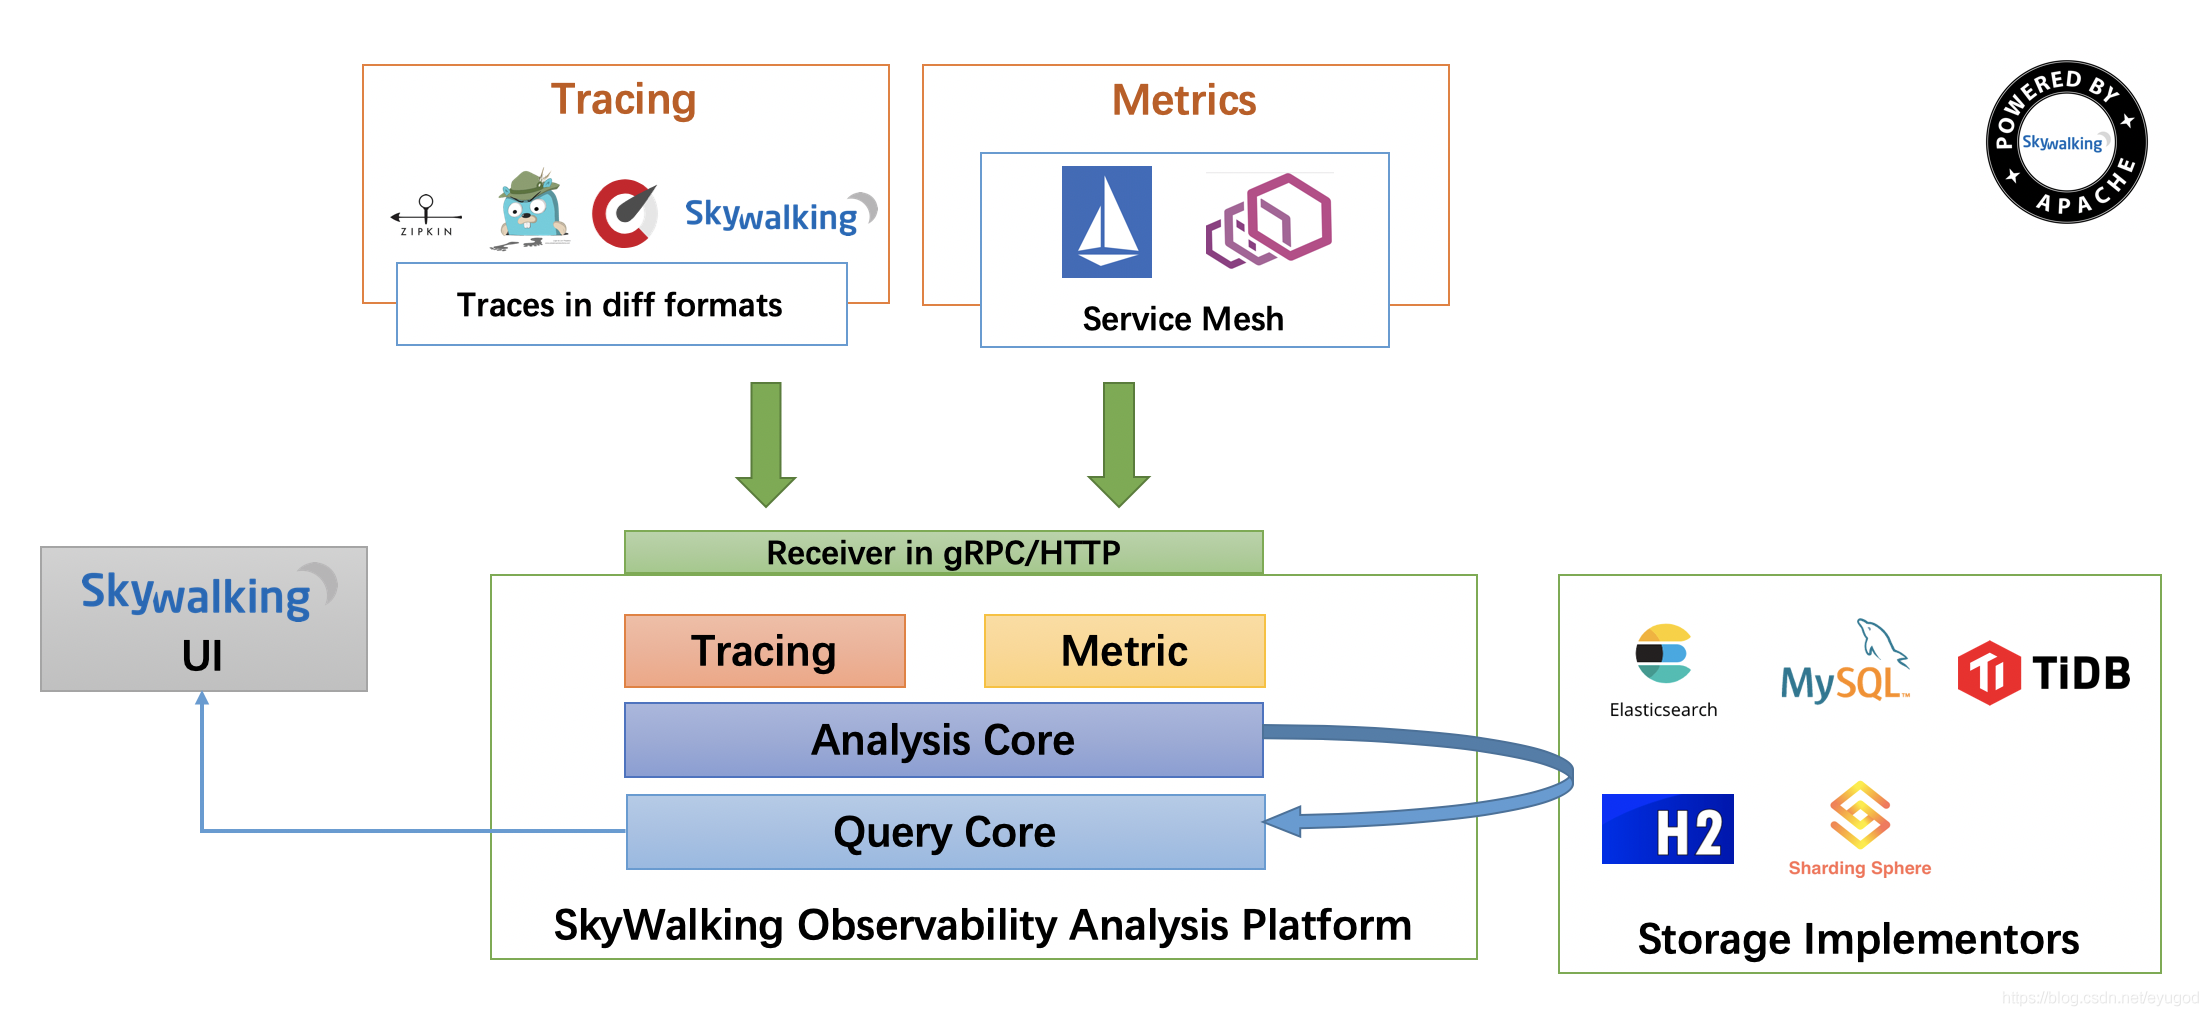
SkyWalking is an application performance monitoring tool for distributed systems designed for microservices, cloud native architectures, and container-based (Docker, K8s, Mesos) architectures. SkyWalking is an observational analysis platform and application performance management system. Provides integrated solutions for distributed tracking, service grid telemetry analysis, measurement aggregation, and visualization (Official Introduction). It is an excellent APM(Application Performance Management) tool.
Official website: https://skywalking.apache.org/
Download address: https://skywalking.apache.org/downloads/
File: https://skywalking.apache.org/docs/
Chinese Documents: https://skyapm.github.io/document-cn-translation-of-skywalking/
3. Server Setup
Download address: https://archive.apache.org/dist/skywalking/8.5.0/apache-skywalking-apm-es7-8.5.0.tar.gz
This time 8.5 is used. Version 0
3.1. Modify UI Port
Use port 8080 by default
Modify the port file path: apache-skywalking-apm-bin\webapp\webapp.yml
server:
  port: 8080 # Change here

collector:
  path: /graphql
  ribbon:
    ReadTimeout: 10000
    # Point to all backend's restHost:restPort, split by ,
    listOfServers: 127.0.0.1:12800
3.2. start-up
Double-click apache-skywalking-apm-bin\bin\startup under windows. Bat
Execute startup. After bat, the following two services are started:
(1) Skywalking-Collector: Tracking information collector, collects client collection information through gRPC/Http, Http default port 12800, gRPC default port 11800.
(2) Skywalking-Webapp: Default port 8080 of management platform page, login information admin/admin
3.3 Microservice Access to SkyWalking
3.3. Access in 1 idea
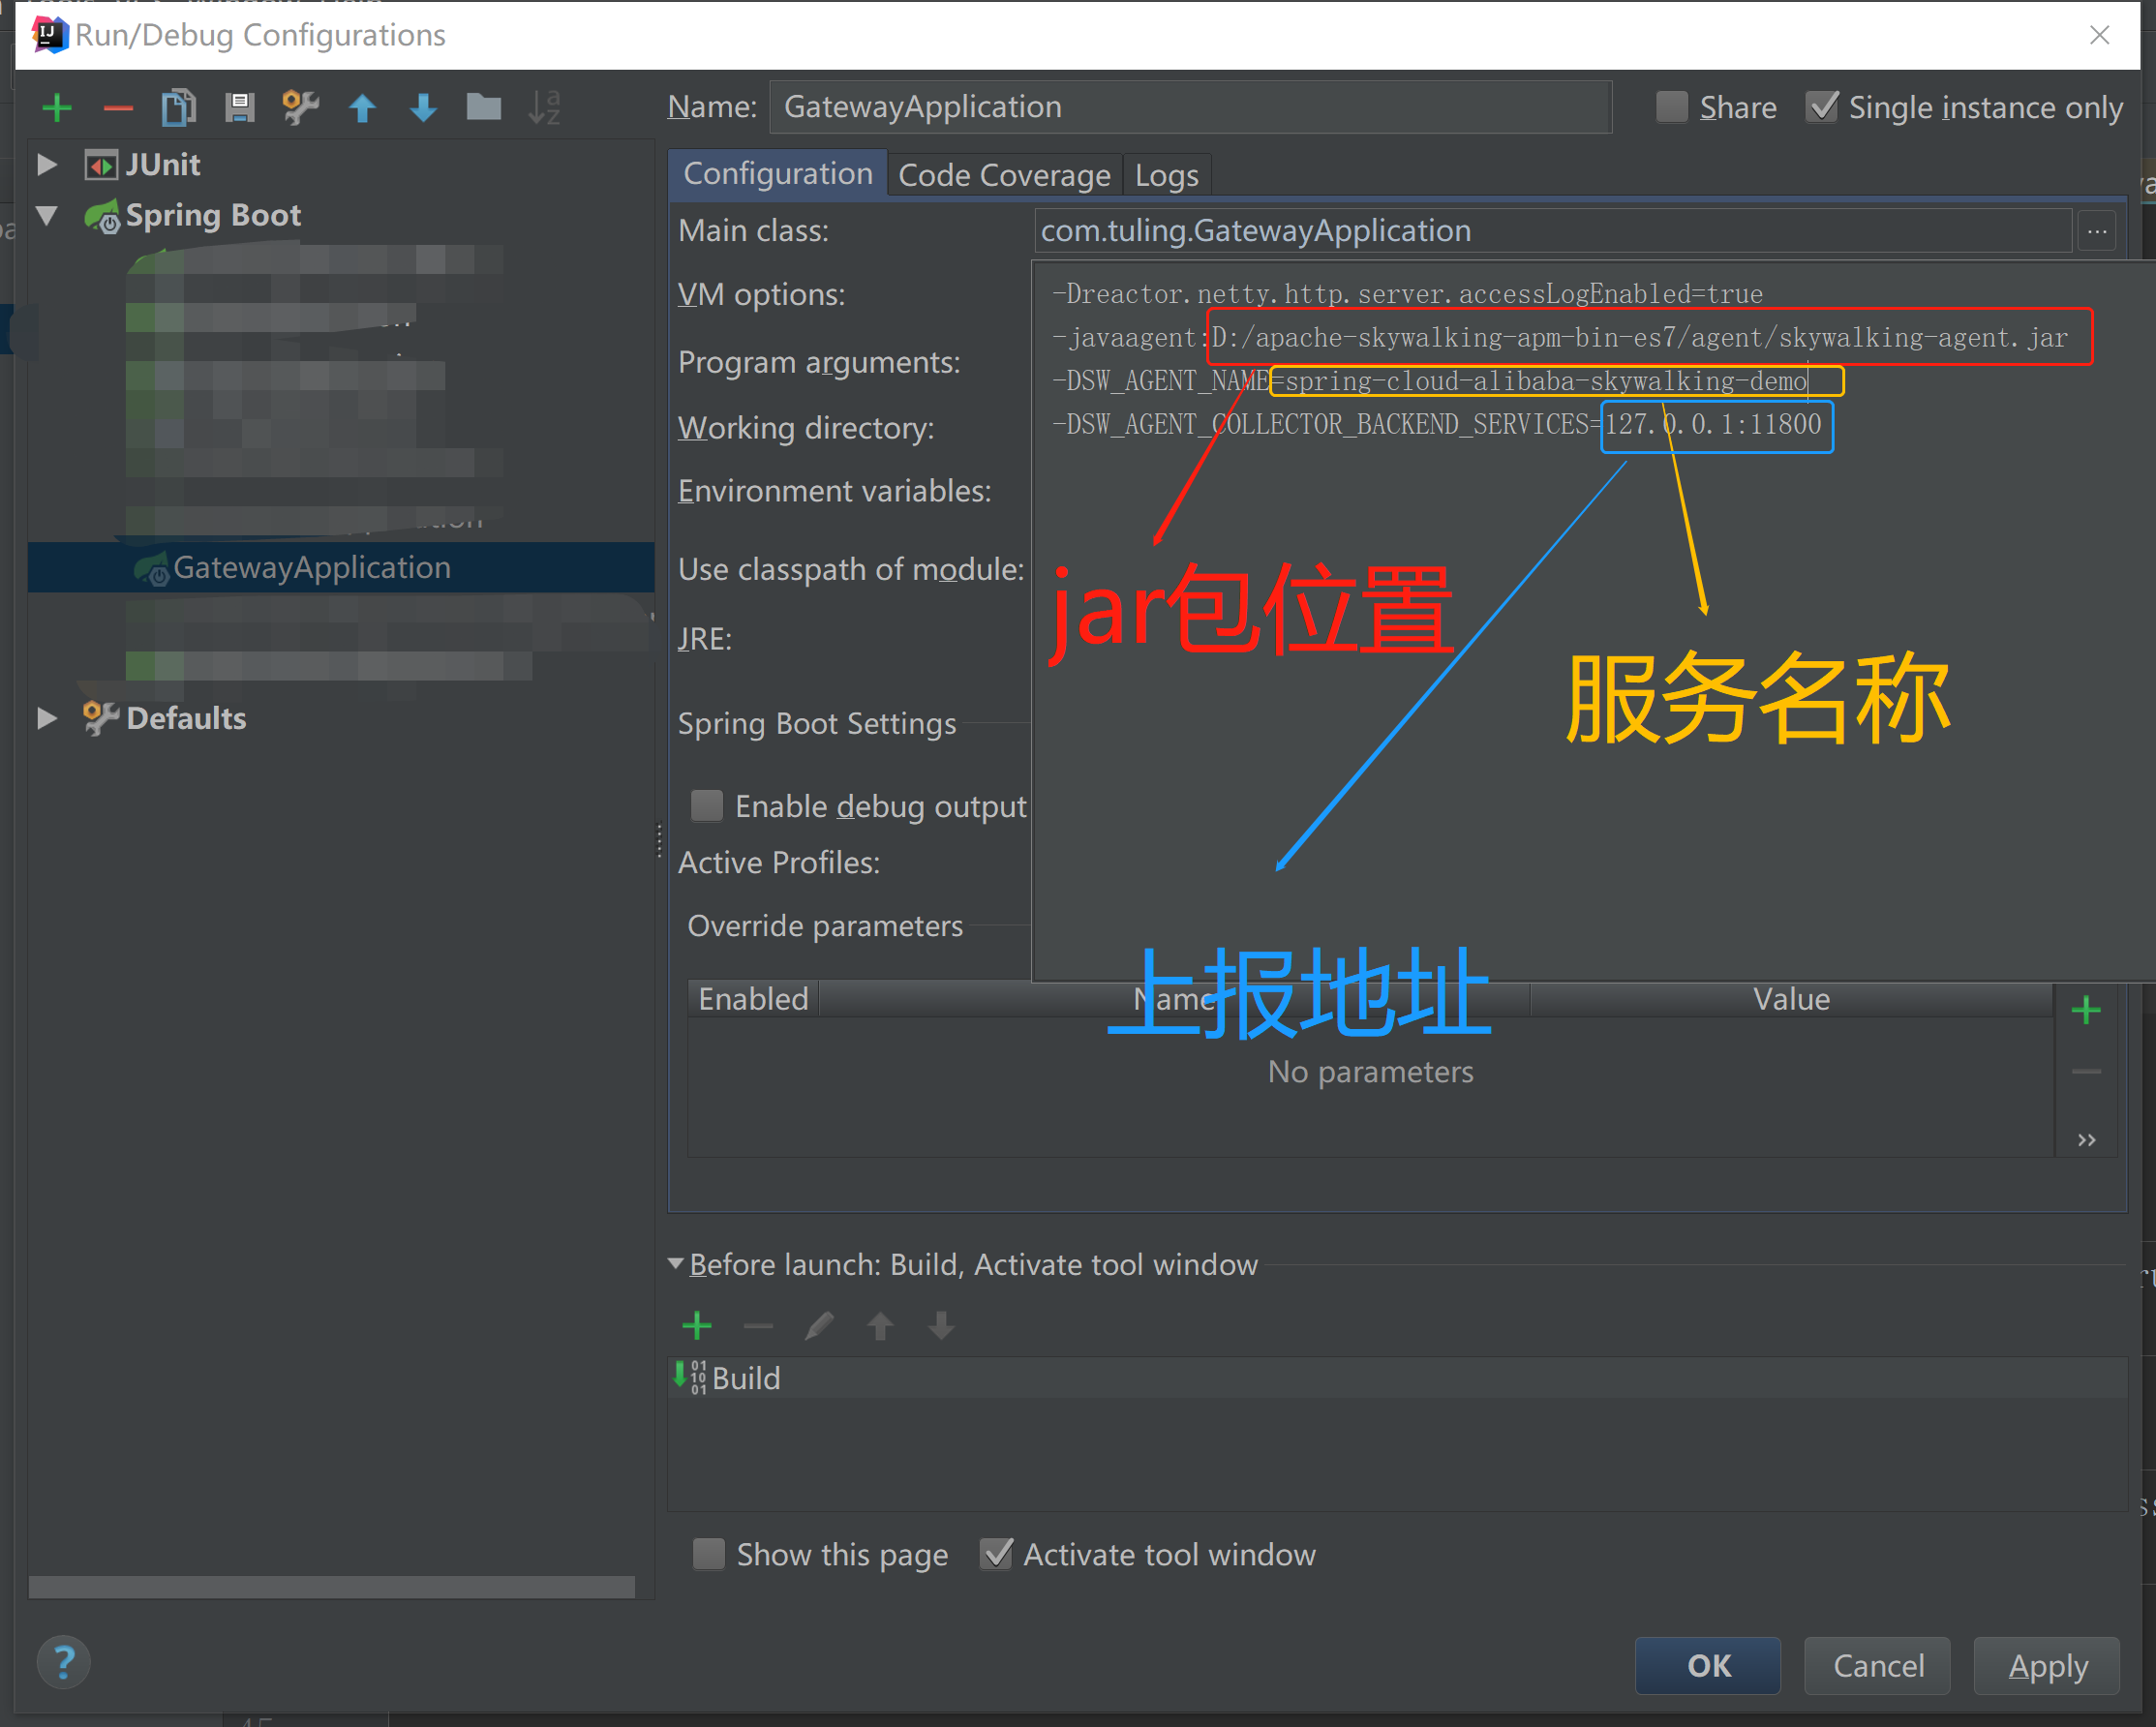
-javaagent:D:/apache-skywalking-apm-bin-es7/agent/skywalking-agent.jar
-DSW_AGENT_NAME=api-gateway
-DSW_AGENT_COLLECTOR_BACKEND_SERVICES=127.0.0.1:11800
Note: It is possible that the tracking link does not display gateway at this time
D:\apache-skywalking-apm-bin-es7\agent\optional-plugins\apm-spring-cloud-gateway-2.1.x-plugin-8.5.0.jar puts this jar package in the D:\apache-skywalking-apm-bin-es7agent\plugins path
4. Mysql persists data
4.1. Add jar package
Find mysql-connector-java-8.0 from the maven repository. 21.jar into D:\apache-skywalking-apm-bin-es7\oap-libs
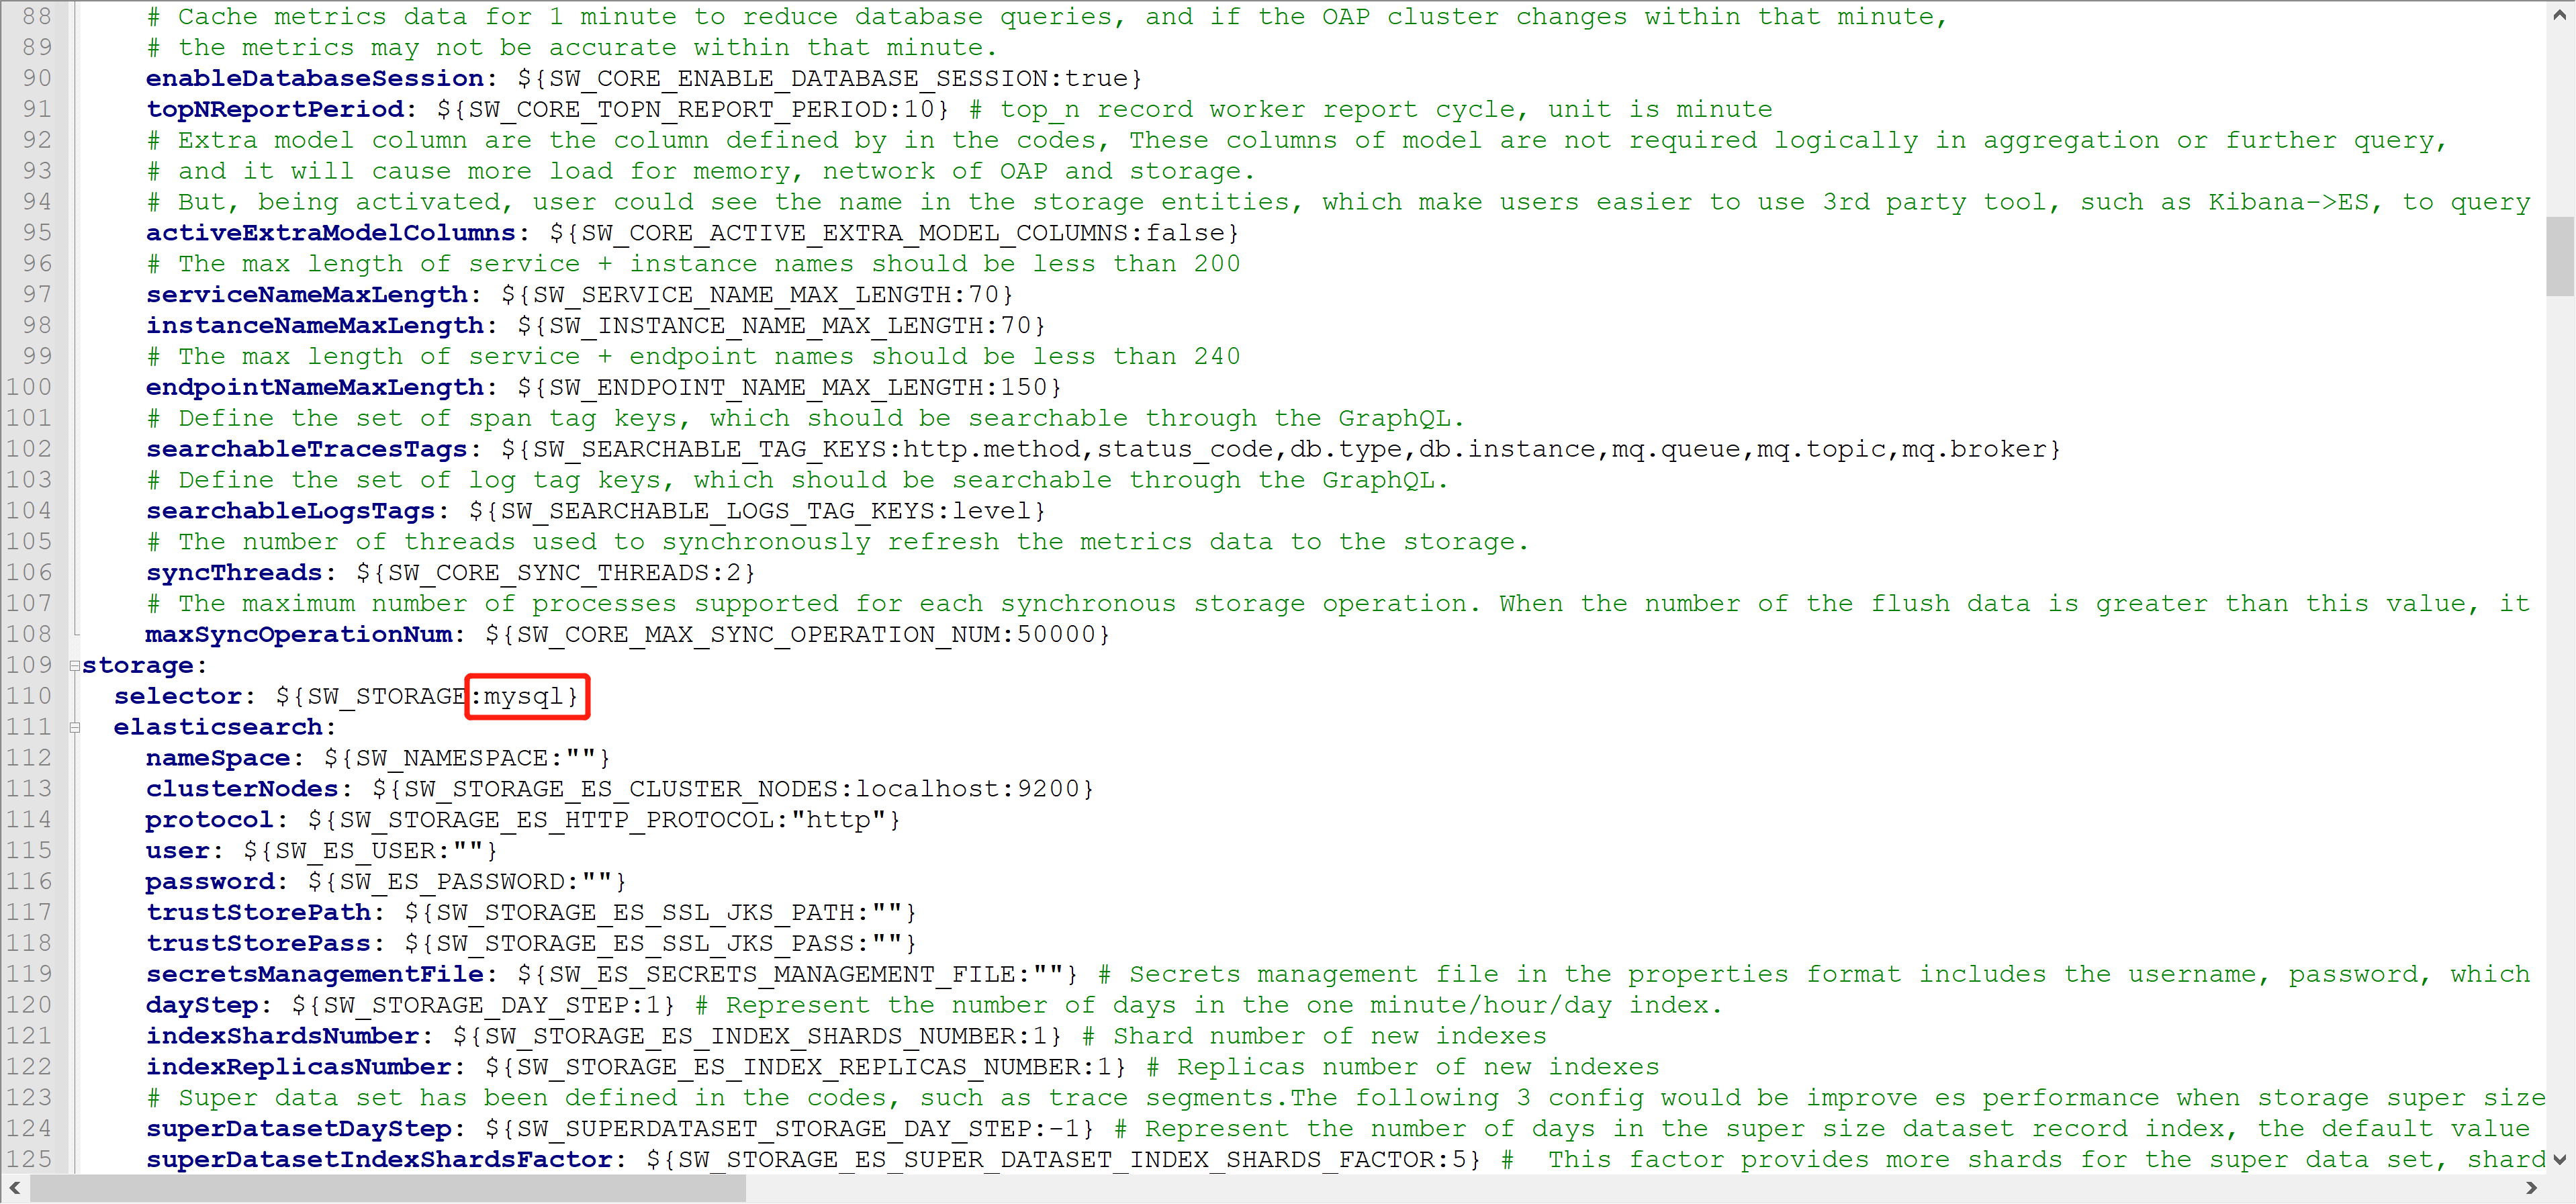
4.2. Modify Profile
Path D:\apache-skywalking-apm-bin-es7\config\application.yml
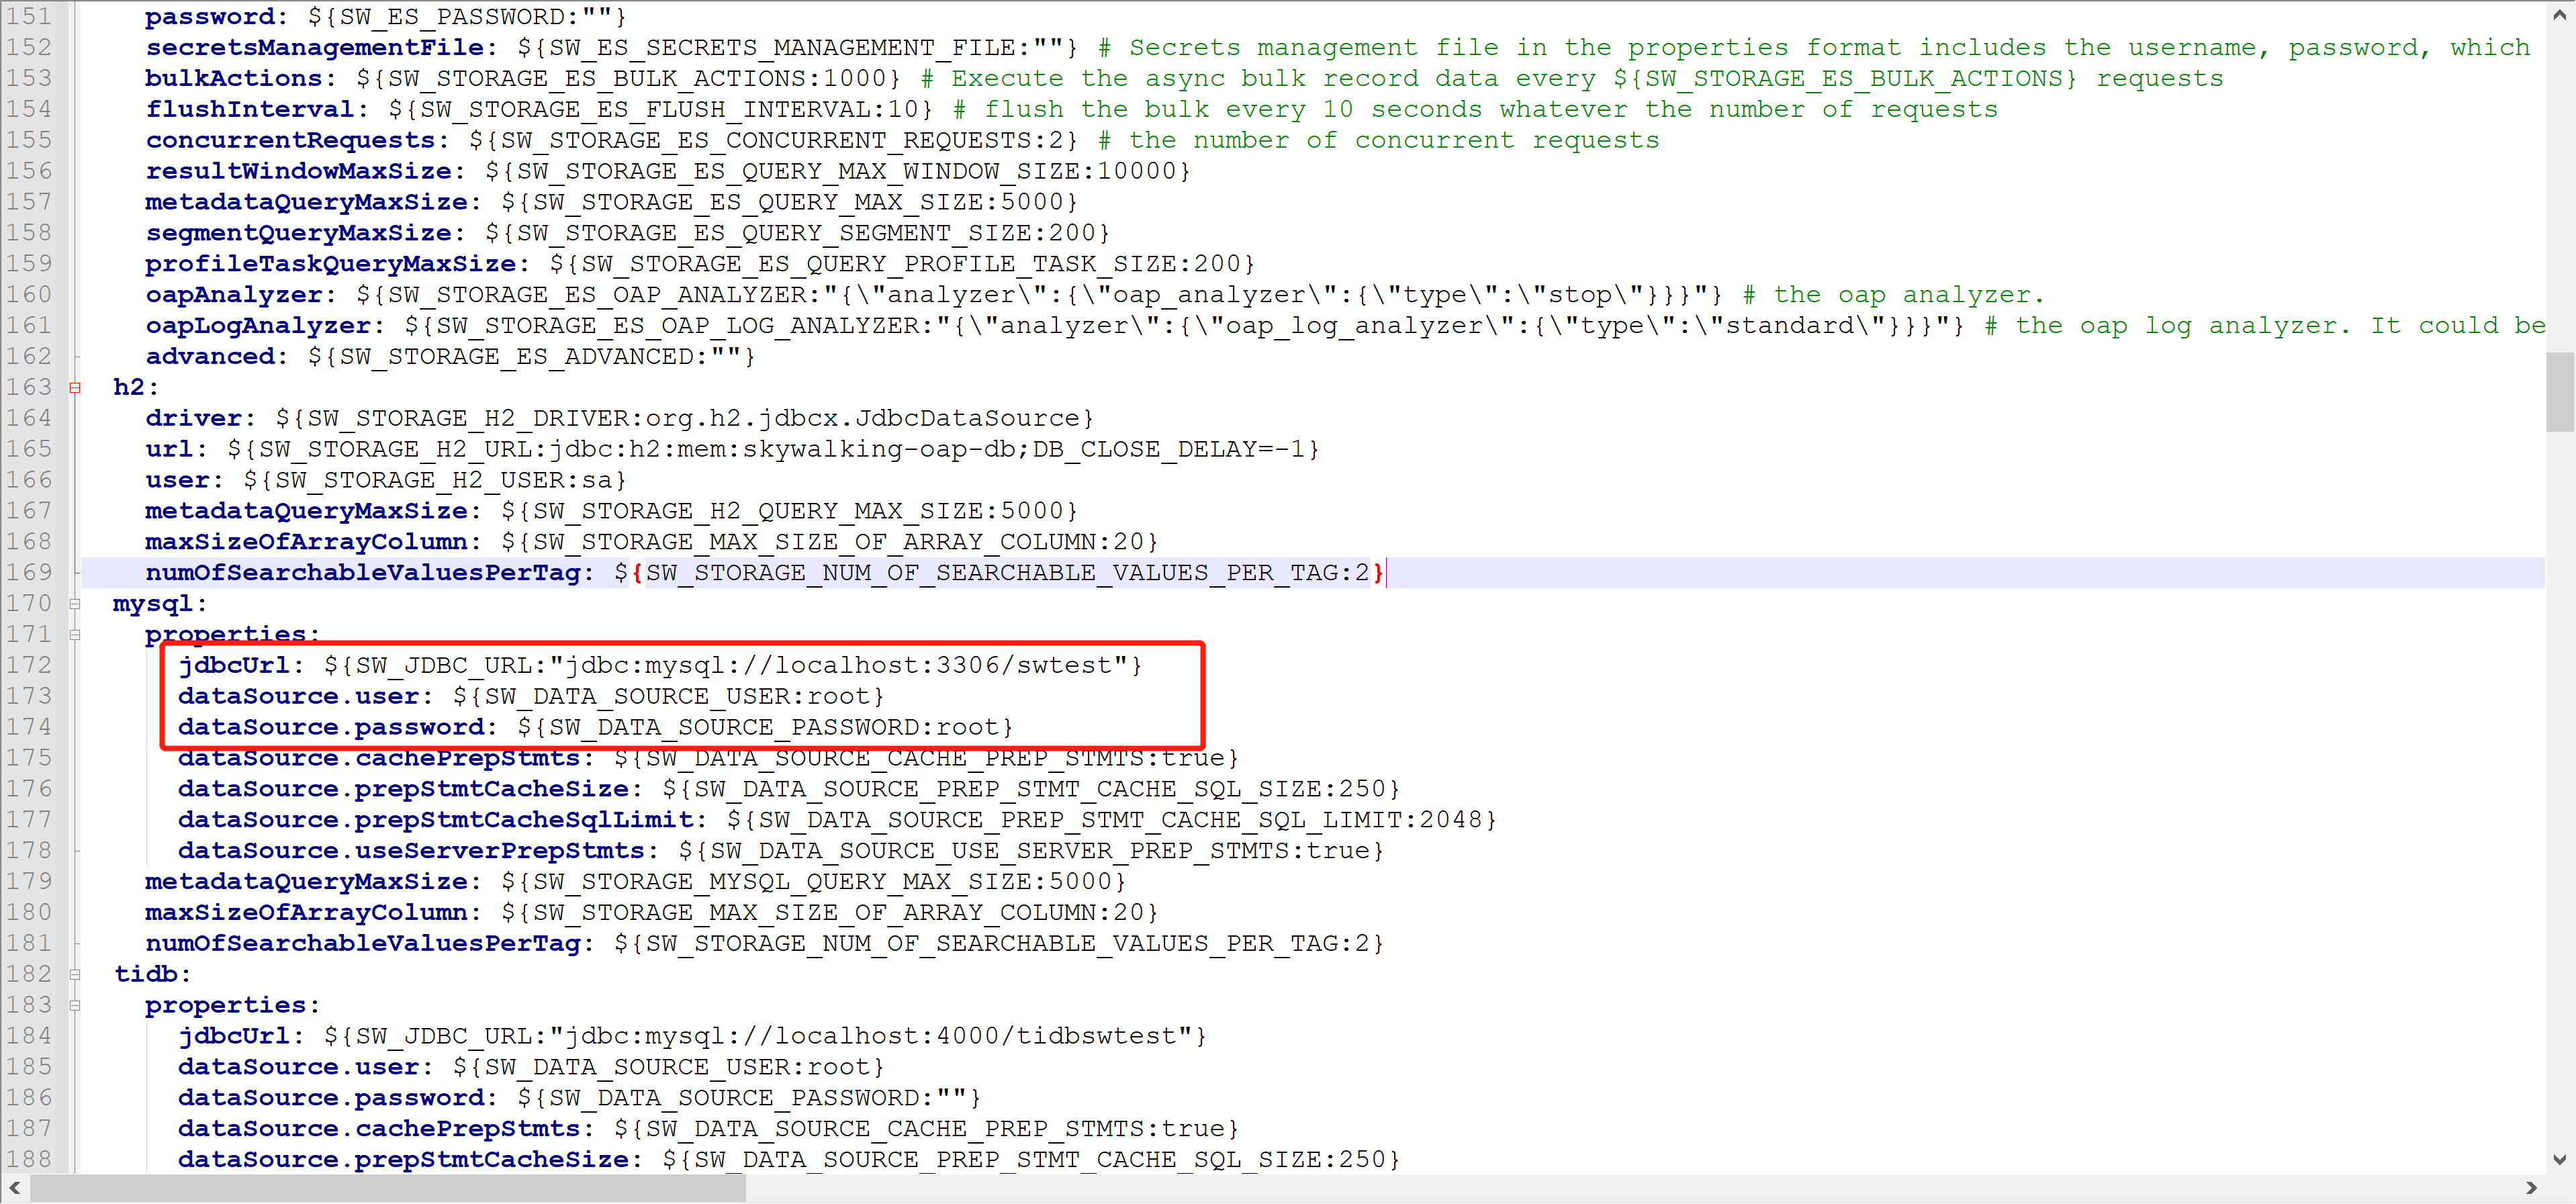
4.3. New Database
New database from configuration file
Note: If the following error occurs when starting the service, add a parameter to the 4.2 database address:? serverTimezone=GMT%2B8
java.sql.SQLException: The server time zone value '?й???????' is unrecognized or represents more than one time zone. You must configure either the server or JDBC driver (via the 'serverTimezone' configuration property) to use a more specifc time zone value if you want to utilize time zone support.
4.4. Startup effect
The database will create a new table
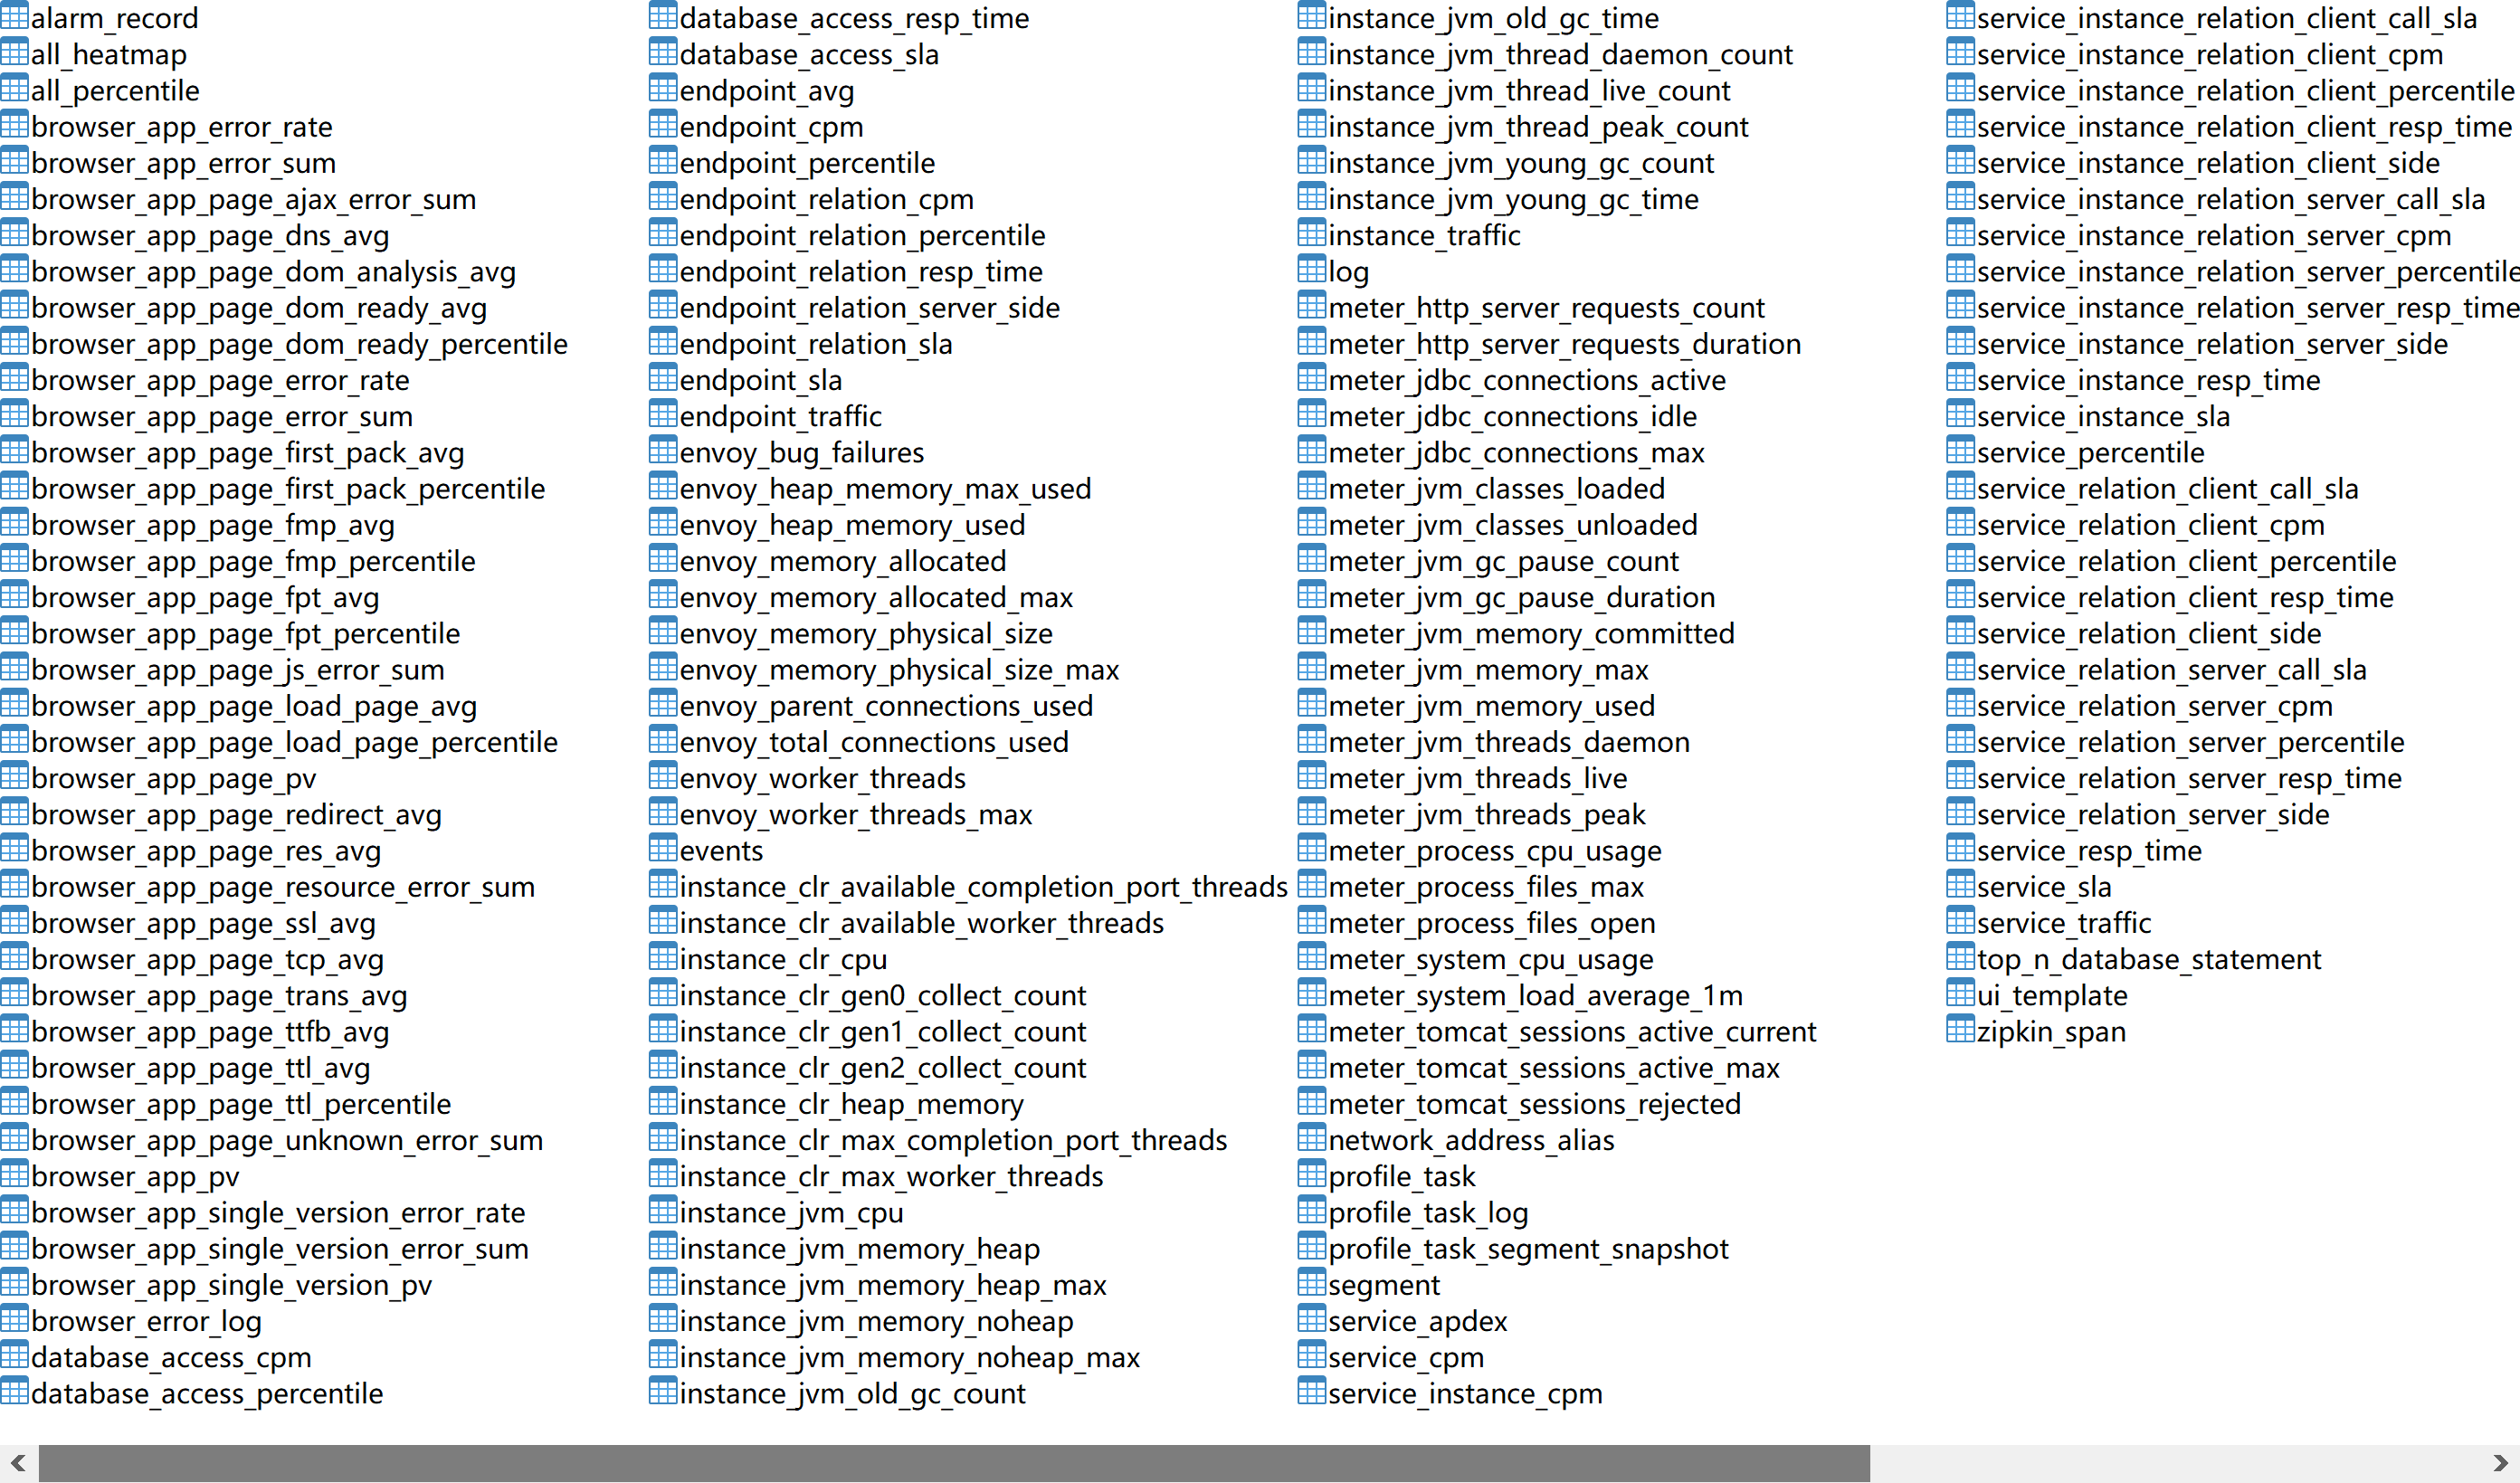
At the same time, probe acquisition data will not disappear with restart
5. Customize SkyWalking link tracking
If we want to enable link tracking for business methods in the project (e.g., service layer, enrollment, return value tracking) to facilitate our troubleshooting, we can use the following methods
5.1. Add Dependency
<dependency>
    <groupId>org.apache.skywalking</groupId>
    <artifactId>apm-toolkit-trace</artifactId>
    <!-- Version number and skywalking Consistent service version number -->
    <version>8.5.0</version>
</dependency>
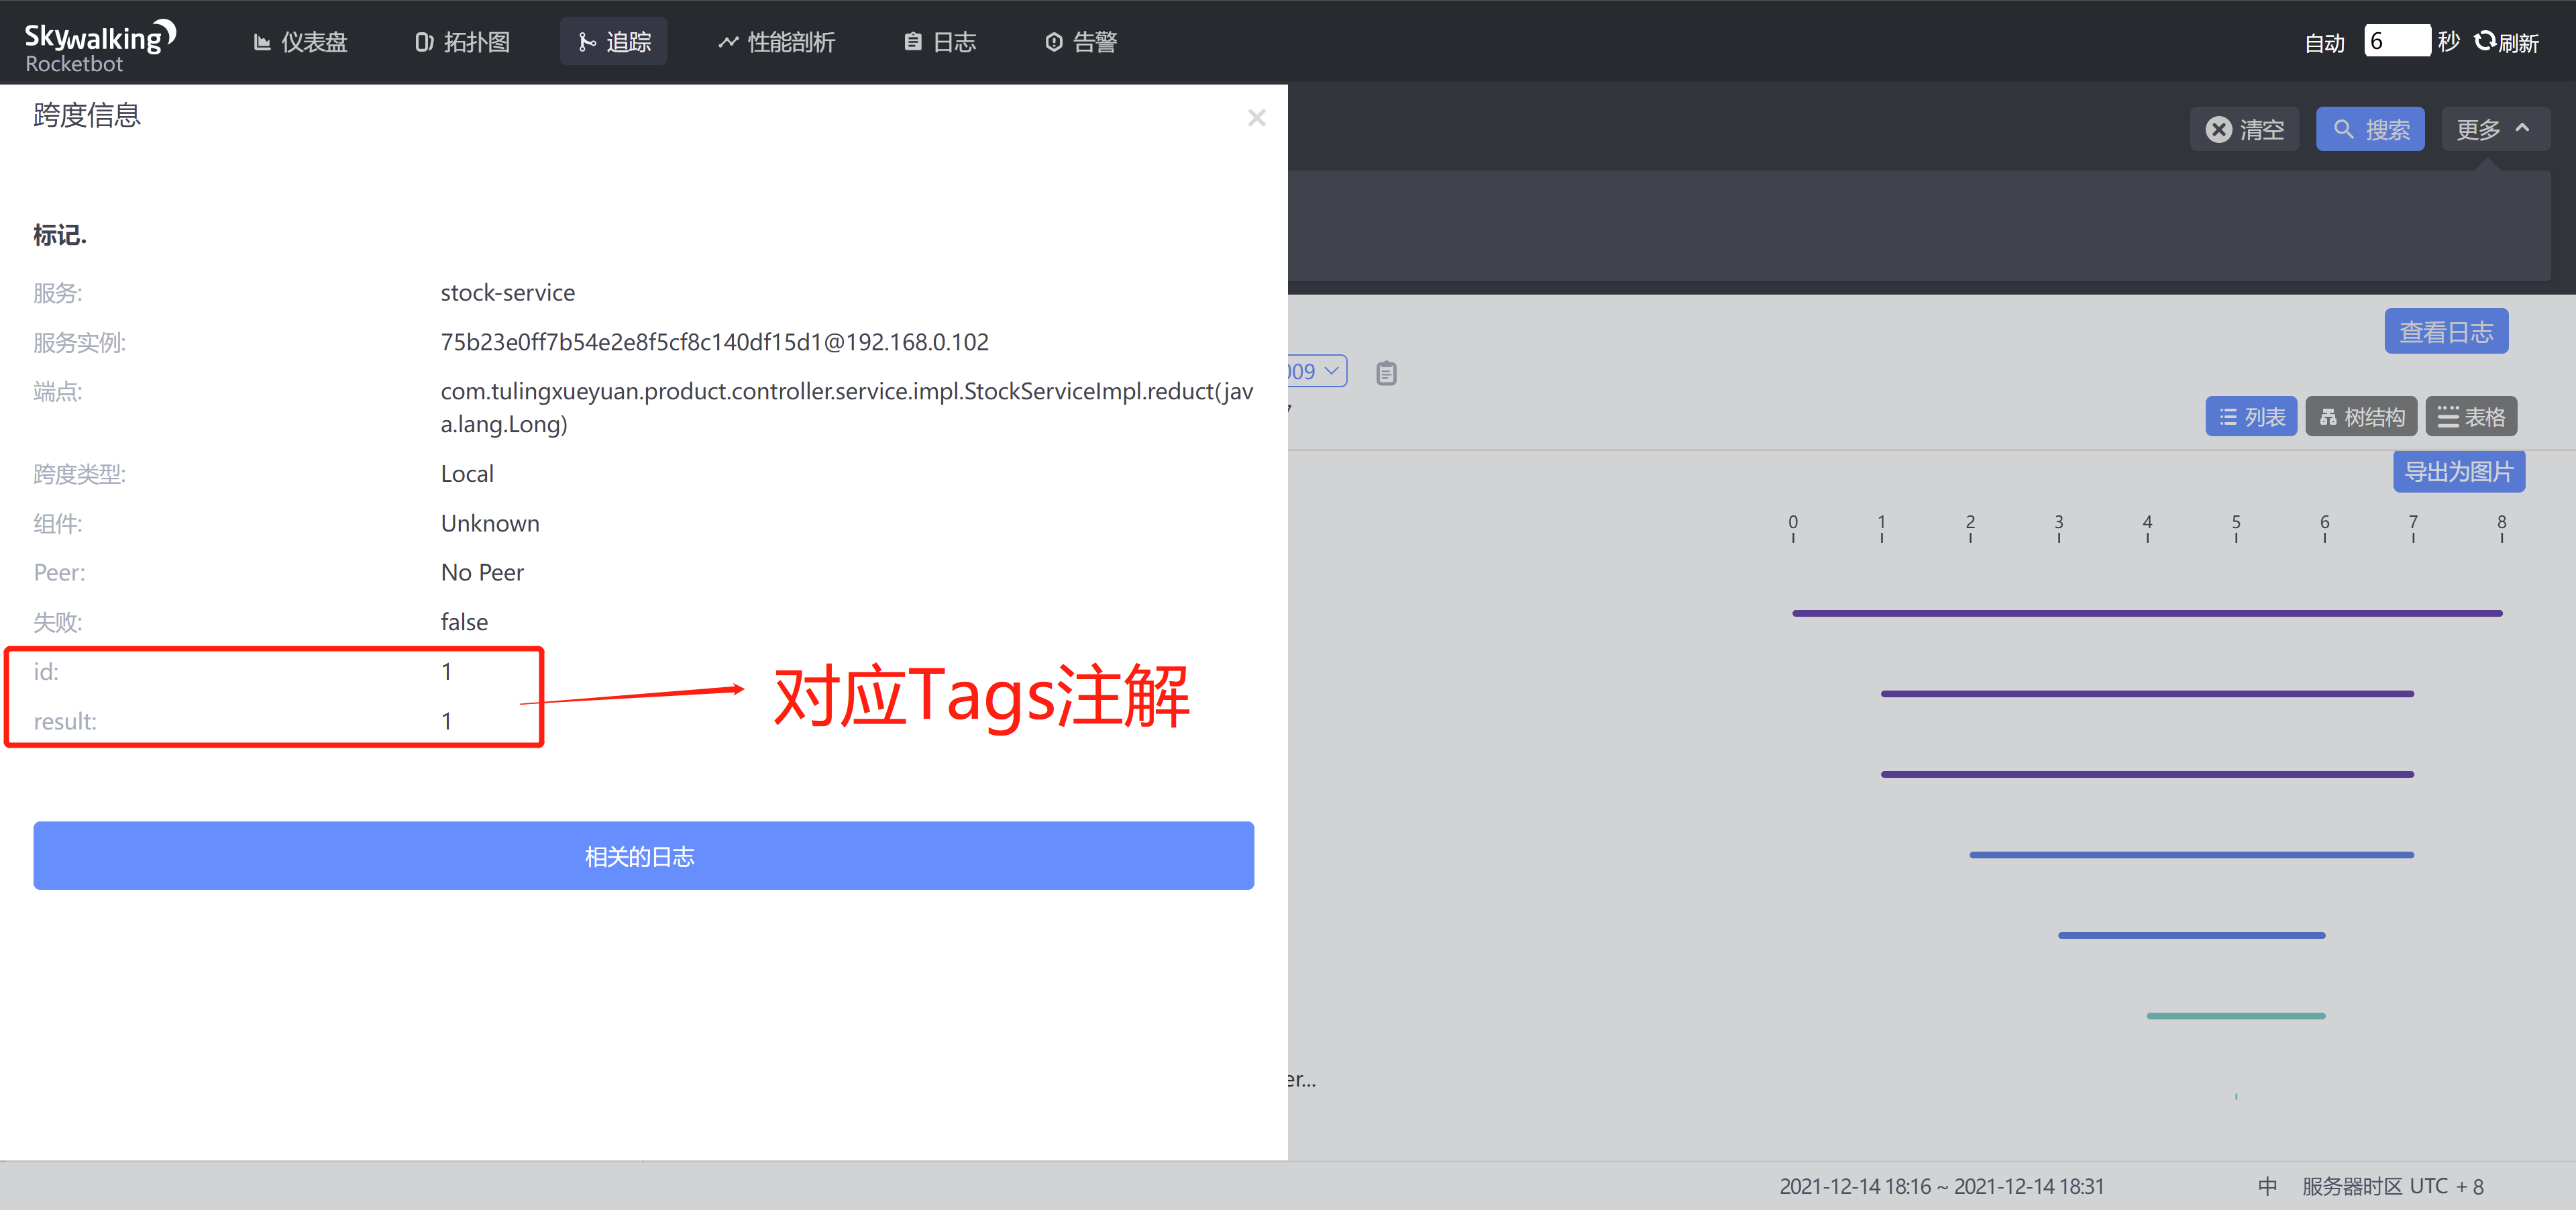
5.2. adding annotations
Add notes on methods that require link tracking, as shown below
import com.tulingxueyuan.product.controller.service.IStockService;
import org.apache.skywalking.apm.toolkit.trace.Tag;
import org.apache.skywalking.apm.toolkit.trace.Tags;
import org.apache.skywalking.apm.toolkit.trace.Trace;
import org.springframework.stereotype.Service;

/**
 * @ClassName StockServiceImpl
 * @Description TODO
 * @Author Xxx
 * @Date 2021/12/14 18:20
 * @Version 1.0
 */
@Service
public class StockServiceImpl implements IStockService {

    @Trace // skywalking Custom Link Tracking Notes
    @Tags({
            @Tag(key = "result", value = "returnedObj"), //  skywalking custom link tracking record return value, returnedObj value is fixed
            @Tag(key = "id", value = "arg[0]") //  skywalking Custom Link Tracking Record Entry, arg[X] Corresponds to Entry Subscript
    })
    public int reduct(Long id) {
        return 1;
    }
}
6. Log
- logback: https://skywalking.apache.org/docs/main/v8.5.0/en/setup/service-agent/java-agent/application-toolkit-logback-1.x/
- log4j2: https://skywalking.apache.org/docs/main/v8.5.0/en/setup/service-agent/java-agent/application-toolkit-log4j-2.x/
- log4j: https://skywalking.apache.org/docs/main/v8.5.0/en/setup/service-agent/java-agent/application-toolkit-log4j-1.x/
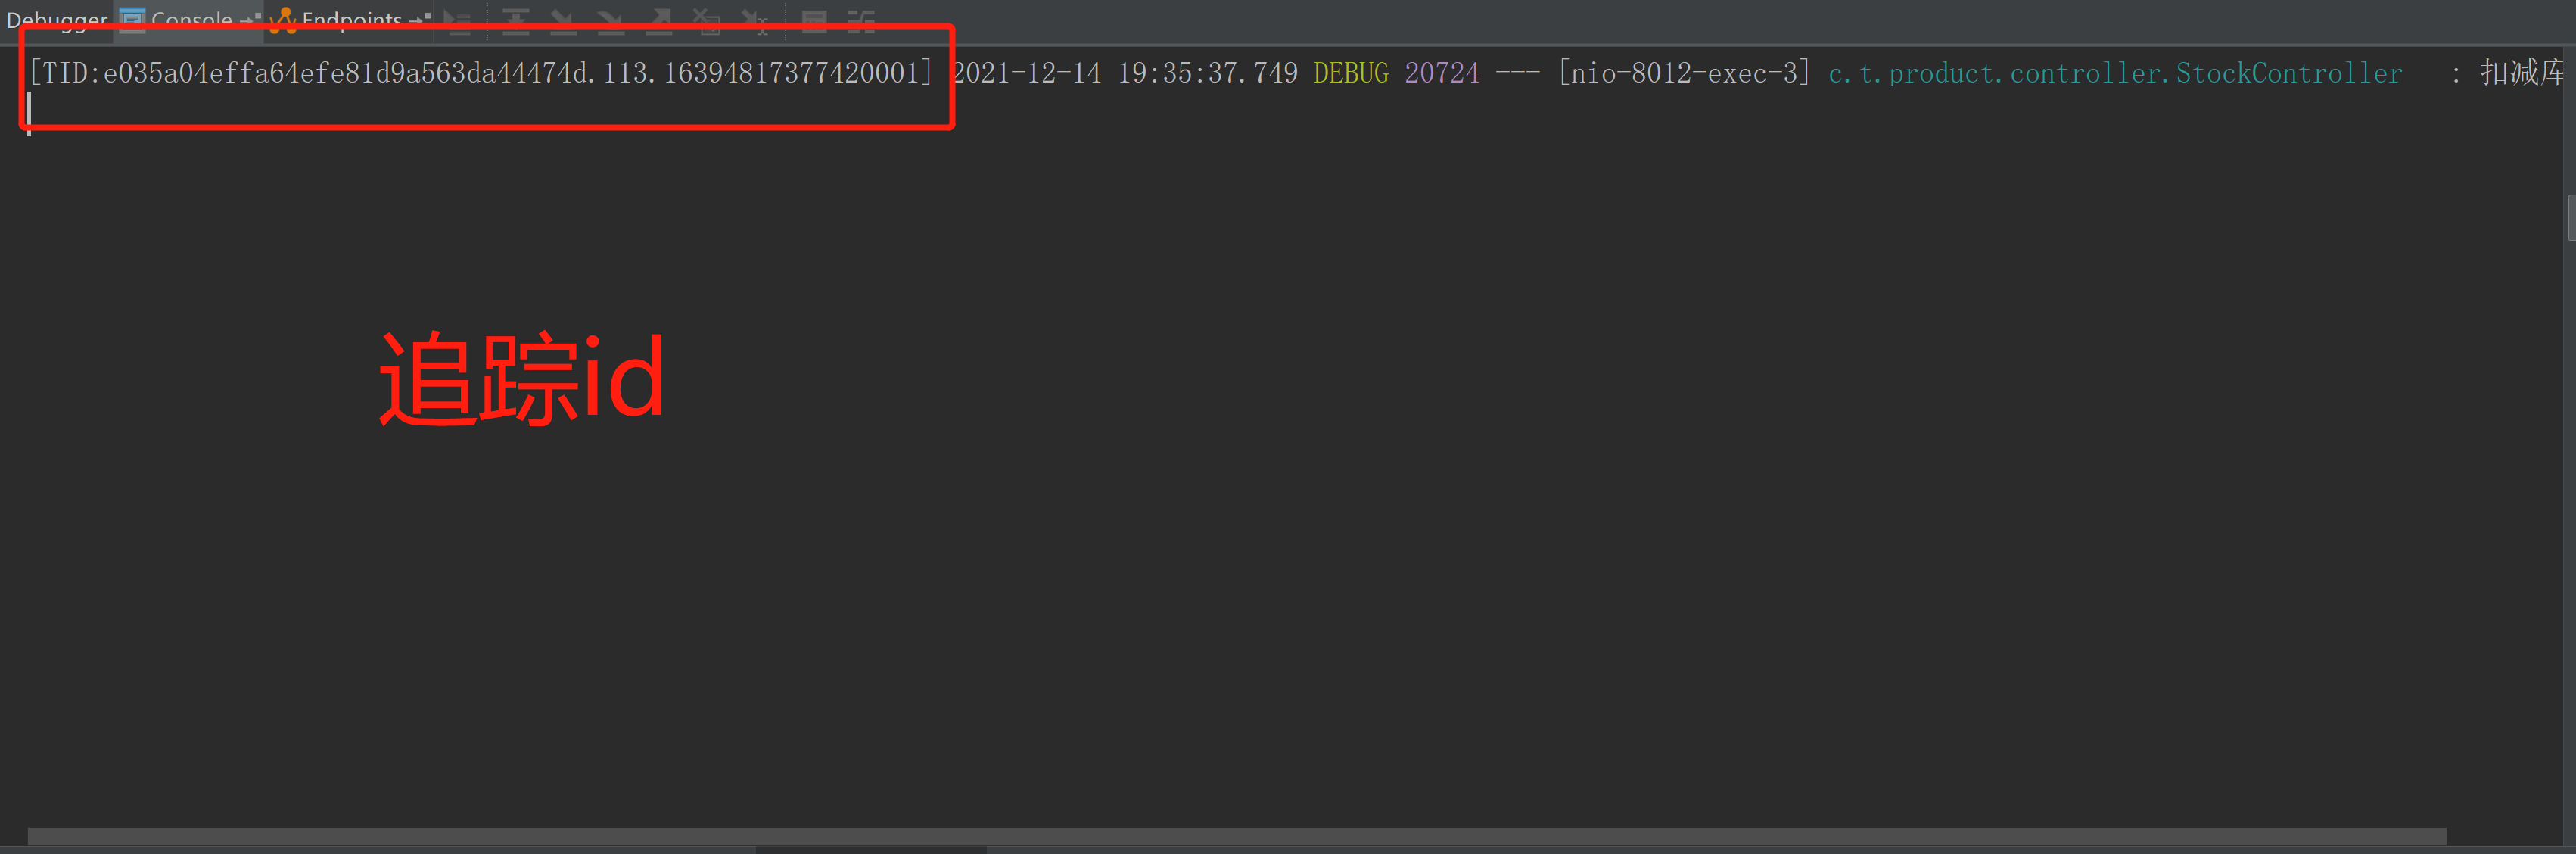
6.1. Local log print tracking id
6.1. 1. Add Dependency
<!-- skywalking Log Dependency -->
<dependency>
    <groupId>org.apache.skywalking</groupId>
    <artifactId>apm-toolkit-logback-1.x</artifactId>
    <version>8.5.0</version>
</dependency>
6.1. 2. Add logback-spring under resource. XML configuration file
<?xml version="1.0" encoding="UTF-8"?>
<configuration>
    <!-- Introduce Spring boot Default logback XML To configure-->
    <include resource="org/springframework/boot/logging/logback/defaults.xml"/>

    <appender name="console" class="ch.qos.logback.core.ConsoleAppender">
        <!--Log Formatting-->
        <encoder class="ch.qos.logback.core.encoder.LayoutWrappingEncoder">
            <layout class="org.apache.skywalking.apm.toolkit.log.logback.v1.x.mdc.TraceIdMDCPatternLogbackLayout">
                <!-- Add to SkyWalking Of tid This is the main query facility[%X{tid}] -->
                <pattern>[%X{tid}] ${CONSOLE_LOG_PATTERN:-%clr(%d{${LOG_DATEFORMAT_PATTERN:-yyyy-MM-dd HH:mm:ss.SSS}}){faint} %clr(${LOG_LEVEL_PATTERN:-%5p}) %clr(${PID:- }){magenta} %clr(---){faint} %clr([%15.15t]){faint} %clr(%-40.40logger{39}){cyan} %clr(:){faint} %m%n${LOG_EXCEPTION_CONVERSION_WORD:-%wEx}}</pattern>
            </layout>
        </encoder>
    </appender>

    <!--Set up Appender-->
    <root level="INFO">
        <!-- console log -->
        <appender-ref ref="console"/>
    </root>
</configuration>
Effect
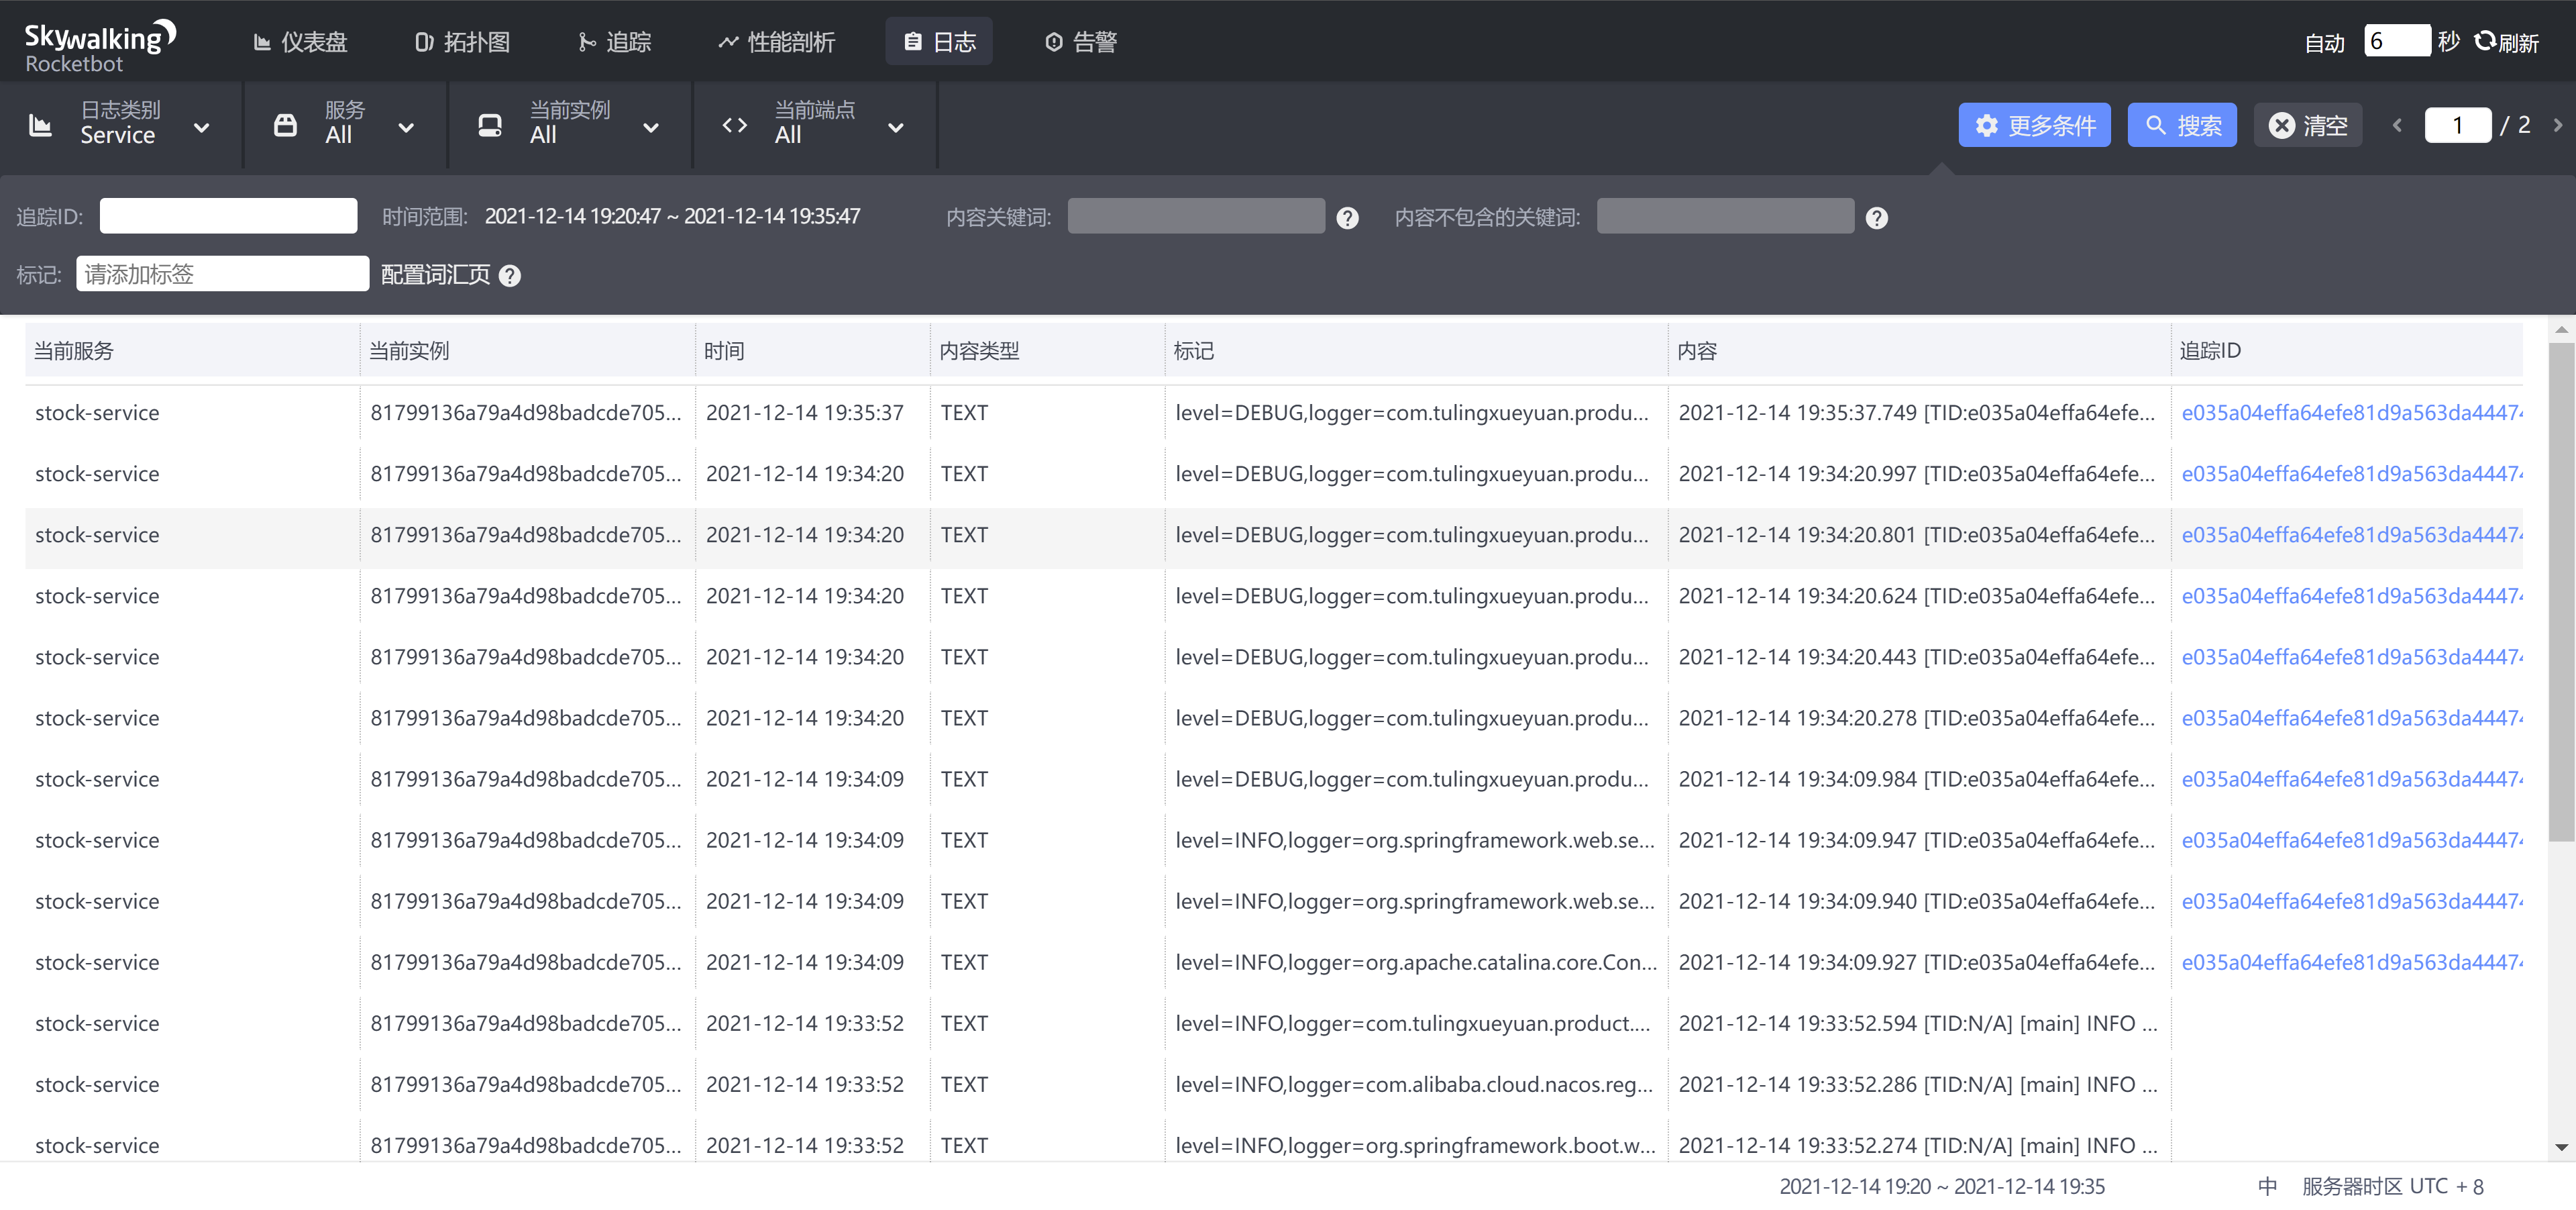
6.2. Log Update
Log upload can be queried directly in ui
Logback-spring. Add in XML
<!-- SkyWalking UI Log Upload Configuration -->
    <appender name="grpc-log" class="org.apache.skywalking.apm.toolkit.log.logback.v1.x.log.GRPCLogClientAppender">
        <encoder class="ch.qos.logback.core.encoder.LayoutWrappingEncoder">
            <layout class="org.apache.skywalking.apm.toolkit.log.logback.v1.x.mdc.TraceIdMDCPatternLogbackLayout">
                <Pattern>%d{yyyy-MM-dd HH:mm:ss.SSS} [%X{tid}] [%thread] %-5level %logger{36} -%msg%n</Pattern>
            </layout>
        </encoder>
    </appender>
<!--Set up Appender-->
    <root level="INFO">
        <!-- SkyWalking UI Log Update -->
        <appender-ref ref="grpc-log"/>
    </root>
Note: Agent/config/agent needs to be configured when agent and oap are on different servers. Config configuration file, add the following configuration information at the end of the file, note the grpc used by skywalking for log communication
# If Skywalking is not deployed locally, the following configuration is required
# Specify the host of the grpc server to which you want to report log data. Default value: 127.0. 0.1
plugin.toolkit.log.grpc.reporter.server_host=${SW_GRPC_LOG_SERVER_HOST:127.0.0.1}
# Specify the port of the grpc server to which you want to report log data. Default value: 11800
plugin.toolkit.log.grpc.reporter.server_port=${SW_GRPC_LOG_SERVER_PORT:11800}
# Specify the maximum size of log data that the grpc client will report. Default value: 10485760
plugin.toolkit.log.grpc.reporter.max_message_size=${SW_GRPC_LOG_MAX_MESSAGE_SIZE:10485760}
# How long will the data sent upstream by the client time out in seconds? Default value: 30
plugin.toolkit.log.grpc.reporter.upstream_timeout=${SW_GRPC_LOG_GRPC_UPSTREAM_TIMEOUT:30}
Effect
6.3. After Integration
<?xml version="1.0" encoding="UTF-8"?>
<configuration>
    <!-- Introduce Spring boot Default logback XML To configure-->
    <include resource="org/springframework/boot/logging/logback/defaults.xml"/>

    <appender name="console" class="ch.qos.logback.core.ConsoleAppender">
        <!--Log Formatting-->
        <encoder class="ch.qos.logback.core.encoder.LayoutWrappingEncoder">
            <layout class="org.apache.skywalking.apm.toolkit.log.logback.v1.x.mdc.TraceIdMDCPatternLogbackLayout">
                <!-- Add to SkyWalking Of tid Convenient query -->
                <pattern>[%X{tid}] ${CONSOLE_LOG_PATTERN:-%clr(%d{${LOG_DATEFORMAT_PATTERN:-yyyy-MM-dd HH:mm:ss.SSS}}){faint} %clr(${LOG_LEVEL_PATTERN:-%5p}) %clr(${PID:- }){magenta} %clr(---){faint} %clr([%15.15t]){faint} %clr(%-40.40logger{39}){cyan} %clr(:){faint} %m%n${LOG_EXCEPTION_CONVERSION_WORD:-%wEx}}</pattern>
            </layout>
        </encoder>
    </appender>

    <!-- SkyWalking UI Log Upload Configuration -->
    <appender name="grpc-log" class="org.apache.skywalking.apm.toolkit.log.logback.v1.x.log.GRPCLogClientAppender">
        <encoder class="ch.qos.logback.core.encoder.LayoutWrappingEncoder">
            <layout class="org.apache.skywalking.apm.toolkit.log.logback.v1.x.mdc.TraceIdMDCPatternLogbackLayout">
                <Pattern>%d{yyyy-MM-dd HH:mm:ss.SSS} [%X{tid}] [%thread] %-5level %logger{36} -%msg%n</Pattern>
            </layout>
        </encoder>
    </appender>

    <!--Set up Appender-->
    <root level="INFO">
        <!-- console log -->
        <appender-ref ref="console"/>
        <!-- SkyWalking UI Log Update -->
        <appender-ref ref="grpc-log"/>
    </root>
</configuration>
7. SkyWalking alert function
SkyWalking alert function is in 6. New to version x, the core of which is driven by a set of rules defined in config/alarm-settings.yml file. The definition of alarm rules is divided into two parts:
- Warning Rules : They define how and what conditions should be considered to trigger measure alerts.
- Webhook (Network Hook) : Define which service terminals need to be notified when a warning is triggered
7.1. Warning Rules
Reference resources: https://github.com/apache/skywalking/blob/website-docs/8.5.0/docs/en/setup/backend/backend-alarm.md#alarm
Both SkyWalking releases provide config/alarm-settings by default. YML file, which predefines some common alarm rules. The following:
- Average service response time over 1 second in the last 3 minutes
- Service success rate is less than 80% in the last 2 minutes
- Service 90% response time is less than 1000ms in the past 3 minutes
- The average response time of a service instance in the last 2 minutes exceeds one second
- Endpoint average response time exceeds 1 second in the past 2 minutes
Open config/alarm-settings with these predefined alert rules. The YML file is visible. The details are as follows:
rules:
  # Rule unique name, must be ended with `_rule`.
  service_resp_time_rule:
    metrics-name: service_resp_time
    op: ">"
    threshold: 1000
    period: 10
    count: 3
    silence-period: 5
    message: Response time of service {name} is more than 1000ms in 3 minutes of last 10 minutes.
  service_sla_rule:
    # Metrics value need to be long, double or int
    metrics-name: service_sla
    op: "<"
    threshold: 8000
    # The length of time to evaluate the metrics
    period: 10
    # How many times after the metrics match the condition, will trigger alarm
    count: 2
    # How many times of checks, the alarm keeps silence after alarm triggered, default as same as period.
    silence-period: 3
    message: Successful rate of service {name} is lower than 80% in 2 minutes of last 10 minutes
  service_p90_sla_rule:
    # Metrics value need to be long, double or int
    metrics-name: service_p90
    op: ">"
    threshold: 1000
    period: 10
    count: 3
    silence-period: 5
    message: 90% response time of service {name} is more than 1000ms in 3 minutes of last 10 minutes
  service_instance_resp_time_rule:
    metrics-name: service_instance_resp_time
    op: ">"
    threshold: 1000
    period: 10
    count: 2
    silence-period: 5
    message: Response time of service instance {name} is more than 1000ms in 2 minutes of last 10 minutes
In addition, a config/alarm-settings-sample is officially available. The YML file, which is a sample file of alert rules, shows all the currently supported alert rule configurations:
# Sample alarm rules.
rules:
  # Rule unique name, must be ended with `_rule`.
  endpoint_percent_rule:
    # Metrics value need to be long, double or int
    metrics-name: endpoint_percent
    threshold: 75
    op: "<"
    # The length of time to evaluate the metrics
    period: 10
    # How many times after the metrics match the condition, will trigger alarm
    count: 3
    # How many times of checks, the alarm keeps silence after alarm triggered, default as same as period.
    silence-period: 10
    message: Successful rate of endpoint {name} is lower than 75%
  service_percent_rule:
    metrics-name: service_percent
    # [Optional] Default, match all services in this metrics
    include-names:
      - service_a
      - service_b
    exclude-names:
      - service_c
    threshold: 85
    op: "<"
    period: 10
    count: 4
Description of the alert rule configuration item:
- Rule name: The name of the rule, which is also the only name displayed in the alert information. Must be _ Rule ends with a customizable prefix
- Metrics name: The measure name, which is taken as the measure name in the oal script, currently only supports long, double, and int types. See in detail Official OAL script
- Include names: Which entity names the rule applies to, such as service names and terminal names (optional, default to all)
- Exclude names: This rule is used for entity names that are not used, such as service names and terminal names (optional, empty by default)
- Threshold: Threshold
- OP: Operator, currently supported >, <, =
- Period: How often the alarm rule needs to be checked. This is a time window that matches the environment time of the back-end deployment
- Count: In a Period window, if values exceed the Threshold value (press op) and reach the Count value, an alert needs to be sent
- Silence period: After triggering the alarm in time N, do not alert at TN -> TN + period stage. By default, it is the same as Priod, which means that the same alert (with the same Id in the same Metrics name) will only be triggered once in the same Period
- Message: alert message
7.2. Webhook (Network Hook)
Reference resources: https://github.com/apache/skywalking/blob/website-docs/8.5.0/docs/en/setup/backend/backend-alarm.md#webhook
Webhook can be simply understood as a Web-level callback mechanism, triggered by some events, similar to event callbacks in code, but only at the web level. Since it is Web-level, when an event occurs, the callback is no longer a method or function in the code, but a service interface. For example, in a scenario of warning, a warning is an event. When this event occurs, SkyWalking actively calls a configured interface called Webhook.
SkyWalking's alert message is sent via an HTTP request with POST and Content-Type as application/json, and its JSON data is actually based on List<org. Apache. Skywalking. Oap. Server. Core. Alarm. AlarmMessage>Serialized. JSON data example:
[{
    "scopeId": 1,
    "scope": "SERVICE",
    "name": "serviceA",
    "id0": 12,
    "id1": 0,
    "ruleName": "service_resp_time_rule",
    "alarmMessage": "alarmMessage xxxx",
    "startTime": 1560524171000
}, {
    "scopeId": 1,
    "scope": "SERVICE",
    "name": "serviceB",
    "id0": 23,
    "id1": 0,
    "ruleName": "service_resp_time_rule",
    "alarmMessage": "alarmMessage yyy",
    "startTime": 1560524171000
}]
Field description:
- scopeId, Scope: All available copes are detailed at org.apache.skywalking.oap.server.core.source.DefaultScopeDefine
- Name: Entity name of the target Scope
- id0:ID of Scope entity
- id1: reserved field, not currently used
- ruleName: Alert rule name
- alarmMessage: Alert message content
- startTime: Alert time in time stamp format
7.3. Mail Alert Function Practice
From the above two subsections, you can see that SkyWalking does not support sending alert information directly to mailbox, SMS, etc. SkyWalking only sends alert information to the configured Webhook interface when an alert occurs.
But we can't always look at the interface's log information manually to see if there is an alert for the service, so we need to implement functions such as sending mail or text messages in the interface to achieve personalized alert notification.
Next, start with hands-on practice, which is implemented based on Spring Boot. First, add dependencies:
<dependency>
    <groupId>org.springframework.boot</groupId>
    <artifactId>spring-boot-starter-mail</artifactId>
</dependency>
Configure Mailbox Service:
server:
  port: 9134

#Mailbox Configuration
spring:
  mail:
    host: smtp.qq.com
    #Sender Mailbox Account
    username: Your mailbox@xx.com
    #Sender Key
    password: Your Mailbox Service Key
    default-encoding: utf-8
    port: 465   #Port number 465 or 587
    protocol: smtp
    properties:
      mail:
        debug:
          false
        smtp:
          socketFactory:
            class: javax.net.ssl.SSLSocketFactory
Define a DTO based on the JSON data sent by SkyWalking for the interface to receive data:
@Setter
@Getter
public class SwAlarmDTO {
    private int scopeId;
    private String scope;
    private String name;
    private String id0;
    private String id1;
    private String ruleName;
    private String alarmMessage;
    private long startTime;
    private transient boolean onlyAsCondition;
}
Next, define an interface that receives SkyWalking alert notifications and sends data to your mailbox:
import com.tuling.alarm.domain.SwAlarmDTO;
import lombok.RequiredArgsConstructor;
import lombok.extern.slf4j.Slf4j;
import org.springframework.beans.factory.annotation.Value;
import org.springframework.mail.SimpleMailMessage;
import org.springframework.mail.javamail.JavaMailSender;
import org.springframework.web.bind.annotation.PostMapping;
import org.springframework.web.bind.annotation.RequestBody;
import org.springframework.web.bind.annotation.RequestMapping;
import org.springframework.web.bind.annotation.RestController;

import java.util.List;

/**
 * @Author Xxx
 * @Date 2021/12/14 23:31
 * @Version 1.0
 */
@Slf4j
@RequiredArgsConstructor
@RestController
@RequestMapping("/alarm")
public class AlarmController {

    private final JavaMailSender sender;

    @Value("${spring.mail.username}")
    private String from;

    @PostMapping("/receive")
    public void receive(@RequestBody List<SwAlarmDTO> alarmList){
        alarmList.forEach(alarm -> log.info(alarm.toString()));

        SimpleMailMessage message = new SimpleMailMessage();
        // Sender Mailbox
        message.setFrom(from);
        // Recipient Mailbox
        message.setTo(from);
        // theme
        message.setSubject("Alert Mail");
        String content = getContent(alarmList);
        // Mail Content
        message.setText(content);
        sender.send(message);
        log.info("Alert message sent...");
    }

    private String getContent(List<SwAlarmDTO> alarmList) {
        StringBuilder sb = new StringBuilder();
        for (SwAlarmDTO dto : alarmList) {
            sb.append("scopeId: ").append(dto.getScopeId())
                    .append("\nscope: ").append(dto.getScope())
                    .append("\n target Scope Entity name: ").append(dto.getName())
                    .append("\nScope Entity's ID: ").append(dto.getId0())
                    .append("\nid1: ").append(dto.getId1())
                    .append("\n Alert Rule Name: ").append(dto.getRuleName())
                    .append("\n Alert message content: ").append(dto.getAlarmMessage())
                    .append("\n Warning Time: ").append(dto.getStartTime())
                    .append("\n\n---------------\n\n");
        }

        return sb.toString();
    }

}
Finally, configure the interface in SkyWalking, and the Webhook configuration is in config/alarm-setts. The end of the YML file in the format http://{ip}:{port}/{uri}. Examples include the following:
[root@ip-236-048 skywalking]# vim config/alarm-settings.yml
webhooks:
  - http://127.0.0.1:8088/alarm/receive
7.4. Test Alert Function
After developing and configuring the alarm interface, we will do a simple test. Here is a call link as follows:
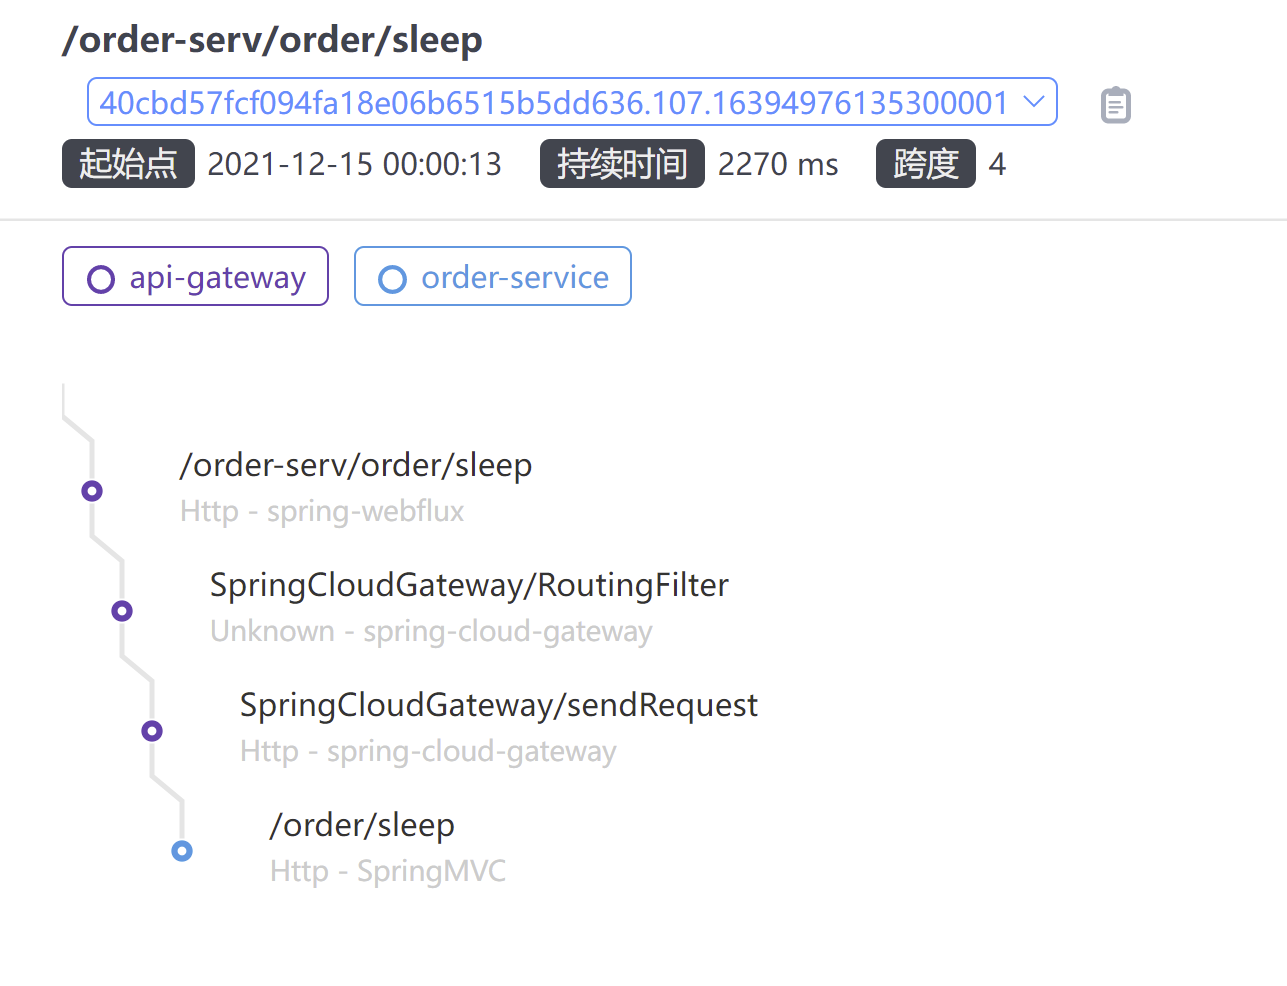
I added a line of code to the / sleep interface that hibernates threads, deliberately increasing the interface response time:
// Used to test skywalking alerts
@RequestMapping("/sleep")
public String sleep() throws InterruptedException {
    TimeUnit.SECONDS.sleep(2);
    return "ok";
}
Next, access the interface through the gateway and wait about two minutes before the mailbox receives information:
! [Insert picture description here] ( https://img-blog.csdnimg.cn/d792c56fff3b468e80b502012a2a3048.png?x-oss-process=image/watermark,type_d3F5LXplbmhlaQ,shadow_50,text_Q1NETiBA5peg6LCT5a-56ZSZ,size_20,color_FFFFFF,t_70,g_se,x_16)At this time, the mailbox normally receives alert messages:
6. Code
https://download.csdn.net/download/qq_42017523/63458748