We will use a series to explain the complete practice of microservices from requirements to online, from code to k8s deployment, from logging to monitoring.
The whole project uses the micro services developed by go zero, which basically includes go zero and some middleware developed by relevant go zero authors. The technology stack used is basically the self-developed component of the go zero project team, which is basically the go zero software.
Actual project address: https://github.com/Mikaelemmmm/go-zero-looklook
preface
Before the introduction, let me talk about the overall idea. If your business logs are not very large and you happen to use cloud services, you can directly use cloud service logs. For example, Alibaba cloud SLS basically collects your daily records into Alibaba cloud SLS with a few steps of mouse configuration, You can directly view the collected logs in Alibaba cloud. I don't think it's necessary to toss around.
If you have a large amount of logs, you can go to the log system.
1. Log system
After printing the business log to console and file, elk and efk are commonly used in the market. The basic idea is the same as elk. We take the commonly used elk as an example. The basic idea is to collect and filter logstash into elastic search, and then kibana presents it
However, logstash itself is developed in java, which takes up a lot of resources. We use go for business. In addition to fast, it takes up less resources and building blocks. Now we are engaged in logstash to waste resources. Then we use go stash instead of logstash. Go stash is officially developed by go zero and has been practiced online for a long time, but it is not responsible for collecting logs, Only responsible for filtering and collecting information.
go-stash: https://github.com/kevwan/go-stash
2. Architecture scheme
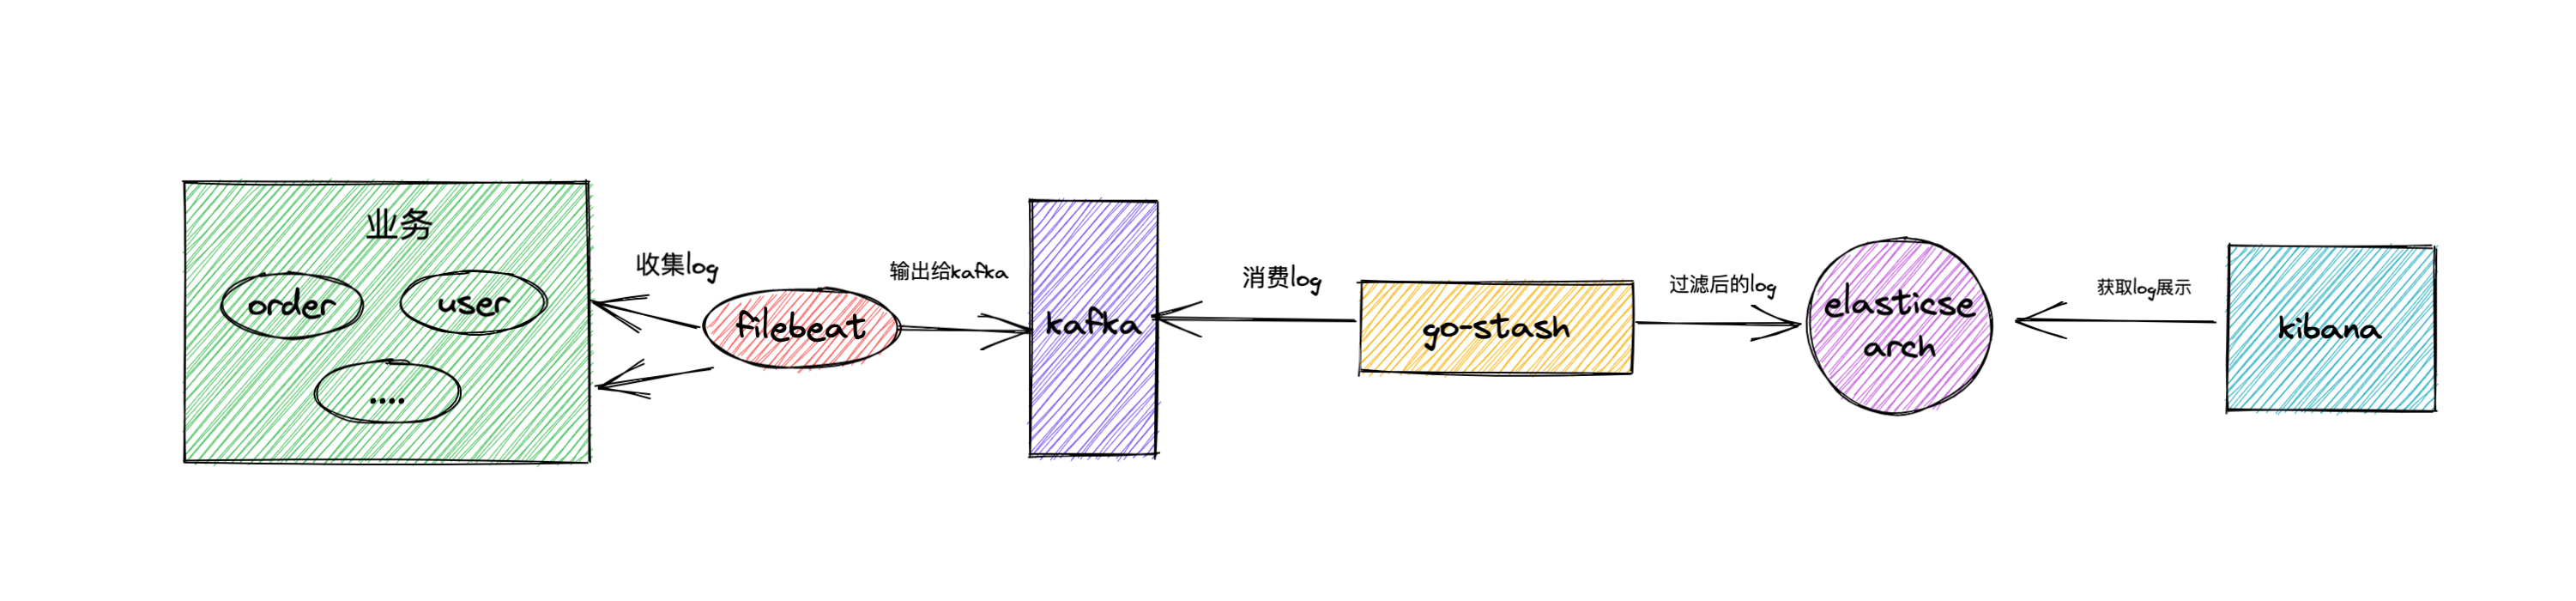
filebeat collects our business logs, and then outputs the logs to kafka as a buffer. Go stash obtains the logs in kafka, filters the fields according to the configuration, and then outputs the filtered fields to elastic search. Finally, kibana is responsible for rendering the logs
3. Implementation scheme
In the error handling in the previous section, we can see that the error log we want has been printed to the console. Now we only need to do subsequent collection
3.1 kafka
#Message queue
kafka:
  image: wurstmeister/kafka
  container_name: kafka
  ports:
    - 9092:9092
  environment:
    KAFKA_ADVERTISED_HOST_NAME: kafka
    KAFKA_ZOOKEEPER_CONNECT: zookeeper:2181
    TZ: Asia/Shanghai
  restart: always
  volumes:
    - /var/run/docker.sock:/var/run/docker.sock
  networks:
    - looklook_net
  depends_on:
    - zookeeper
Configure kafka and zookeeper first
Then we enter kafka. First, we create filebeat and collect logs to kafka's topic
Enter kafka container
$ docker exec -it kafka /bin/sh
Modify the kafka listening configuration (or you can mount the configuration file to the physical machine and modify it)
$ vi /opt/kafka/config/server.properties
listeners=PLAINTEXT://kafka:9092 # in the original file, kafka listeners=PLAINTEXT://:9092 should be added
advertised.listeners=PLAINTEXT://kafka:9092 # source file, Kafka advertised listeners=PLAINTEXT://:9092
Create topic
$  cd /opt/kafka/bin
$ ./kafka-topics.sh --create --zookeeper zookeeper:2181 --replication-factor 1 -partitions 1 --topic looklook-log
3.2 filebeat
Under the root directory of the project, docker-compose-env You can see from the YML file that we have configured filebeat
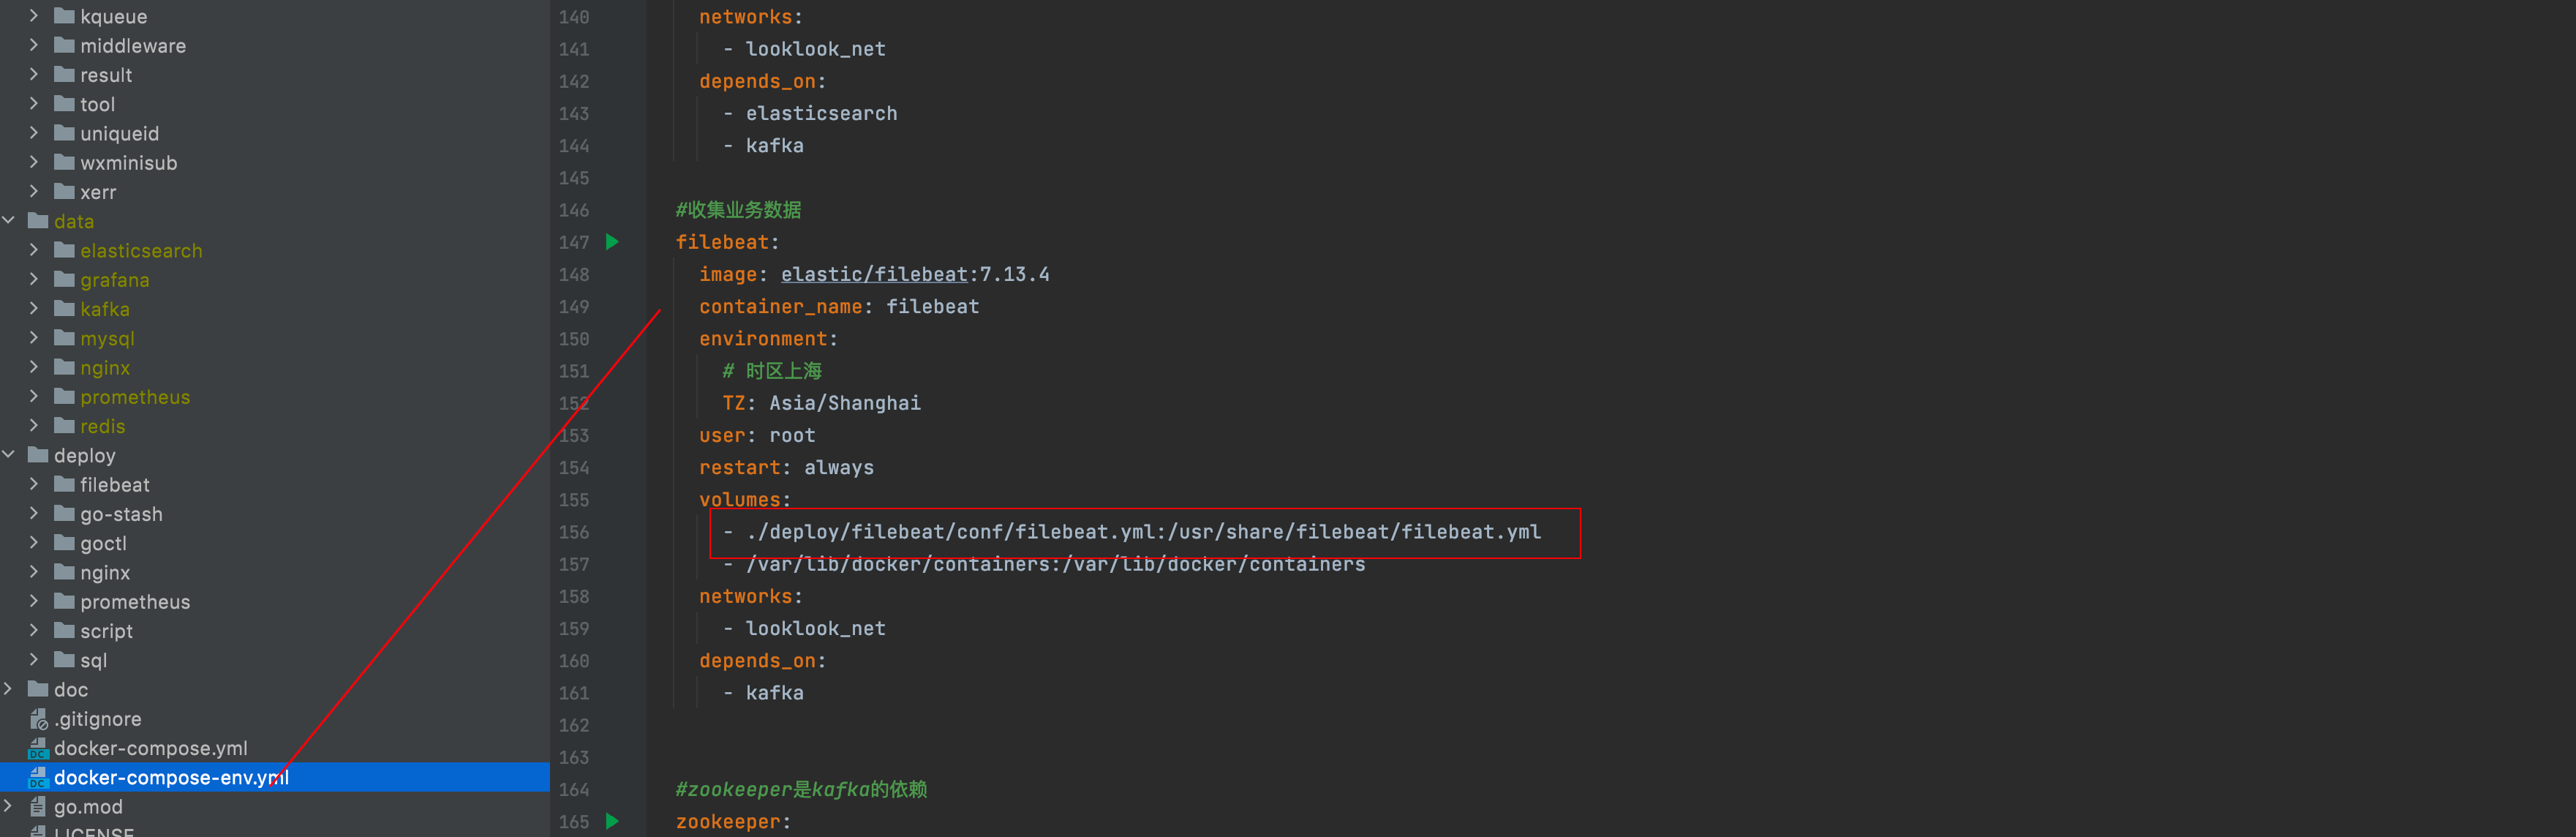
We mount the configuration of filebeat to deploy / filebeat / conf / filebeat yml
filebeat.inputs:
  - type: log
    enabled: true
    paths:
      - /var/lib/docker/containers/*/*-json.log

filebeat.config:
  modules:
    path: ${path.config}/modules.d/*.yml
    reload.enabled: false

processors:
  - add_cloud_metadata: ~
  - add_docker_metadata: ~

output.kafka:
  enabled: true
  hosts: ["kafka:9092"]
  #To create topic in advance
  topic: "looklook-log"
  partition.hash:
    reachable_only: true
  compression: gzip
  max_message_bytes: 1000000
  required_acks: 1
The configuration is relatively simple. You can see that we collect all logs and directly output them to our configured kafka. Configure the topic created in kafka in the previous step
3.3 configure go stash
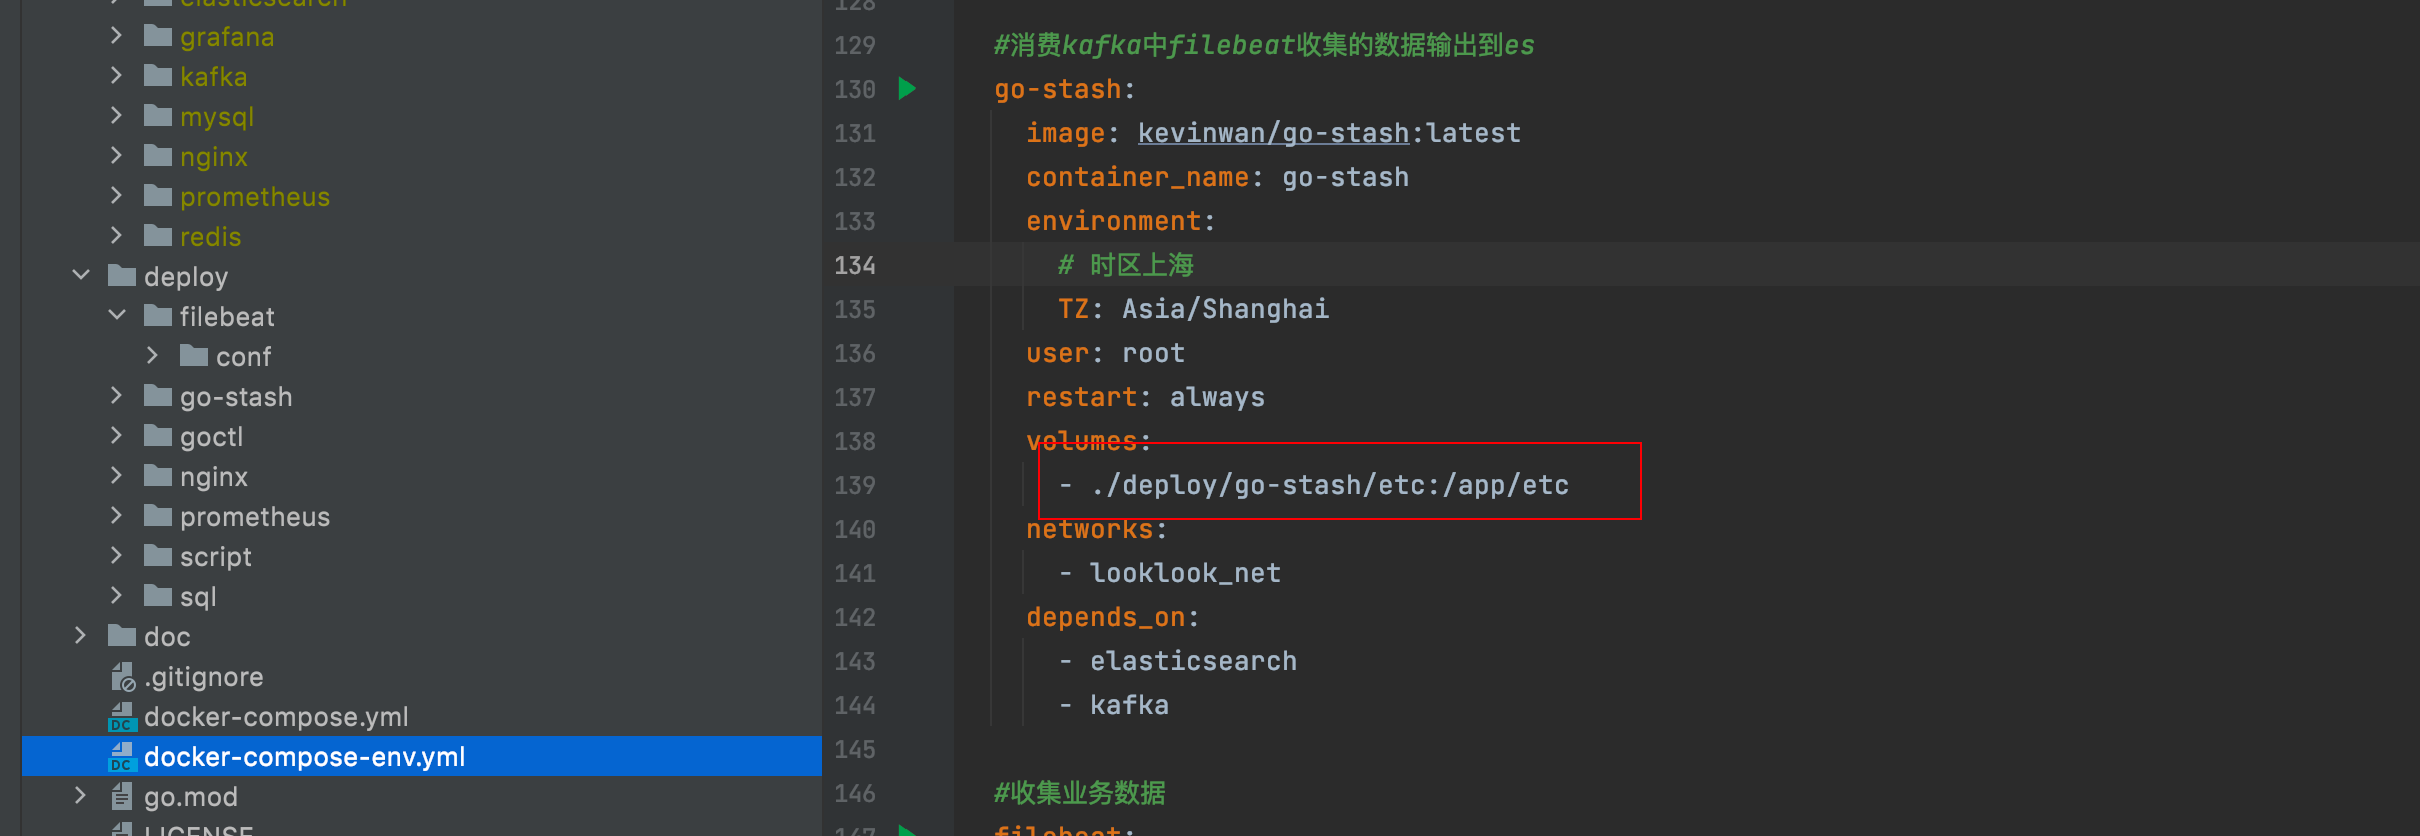
Let's take a look at the go stash configuration file deploy / go stash / etc / config yaml
Clusters:
  - Input:
      Kafka:
        Name: gostash
        Brokers:
          - "kafka:9092"
        Topics:
          - looklook-log
        Group: pro
        Consumers: 16
    Filters:
      - Action: drop
        Conditions:
          - Key: k8s_container_name
            Value: "-rpc"
            Type: contains
          - Key: level
            Value: info
            Type: match
            Op: and
      - Action: remove_field
        Fields:
          # - message
          - _source
          - _type
          - _score
          - _id
          - "@version"
          - topic
          - index
          - beat
          - docker_container
          - offset
          - prospector
          - source
          - stream
          - "@metadata"
      - Action: transfer
        Field: message
        Target: data
    Output:
      ElasticSearch:
        Hosts:
          - "http://elasticsearch:9200"
        Index: "looklook-{{yyyy-MM-dd}}"
Configure the kafka consumed, the elastic search output, and the fields to be filtered
3.4 elastic search,kibana
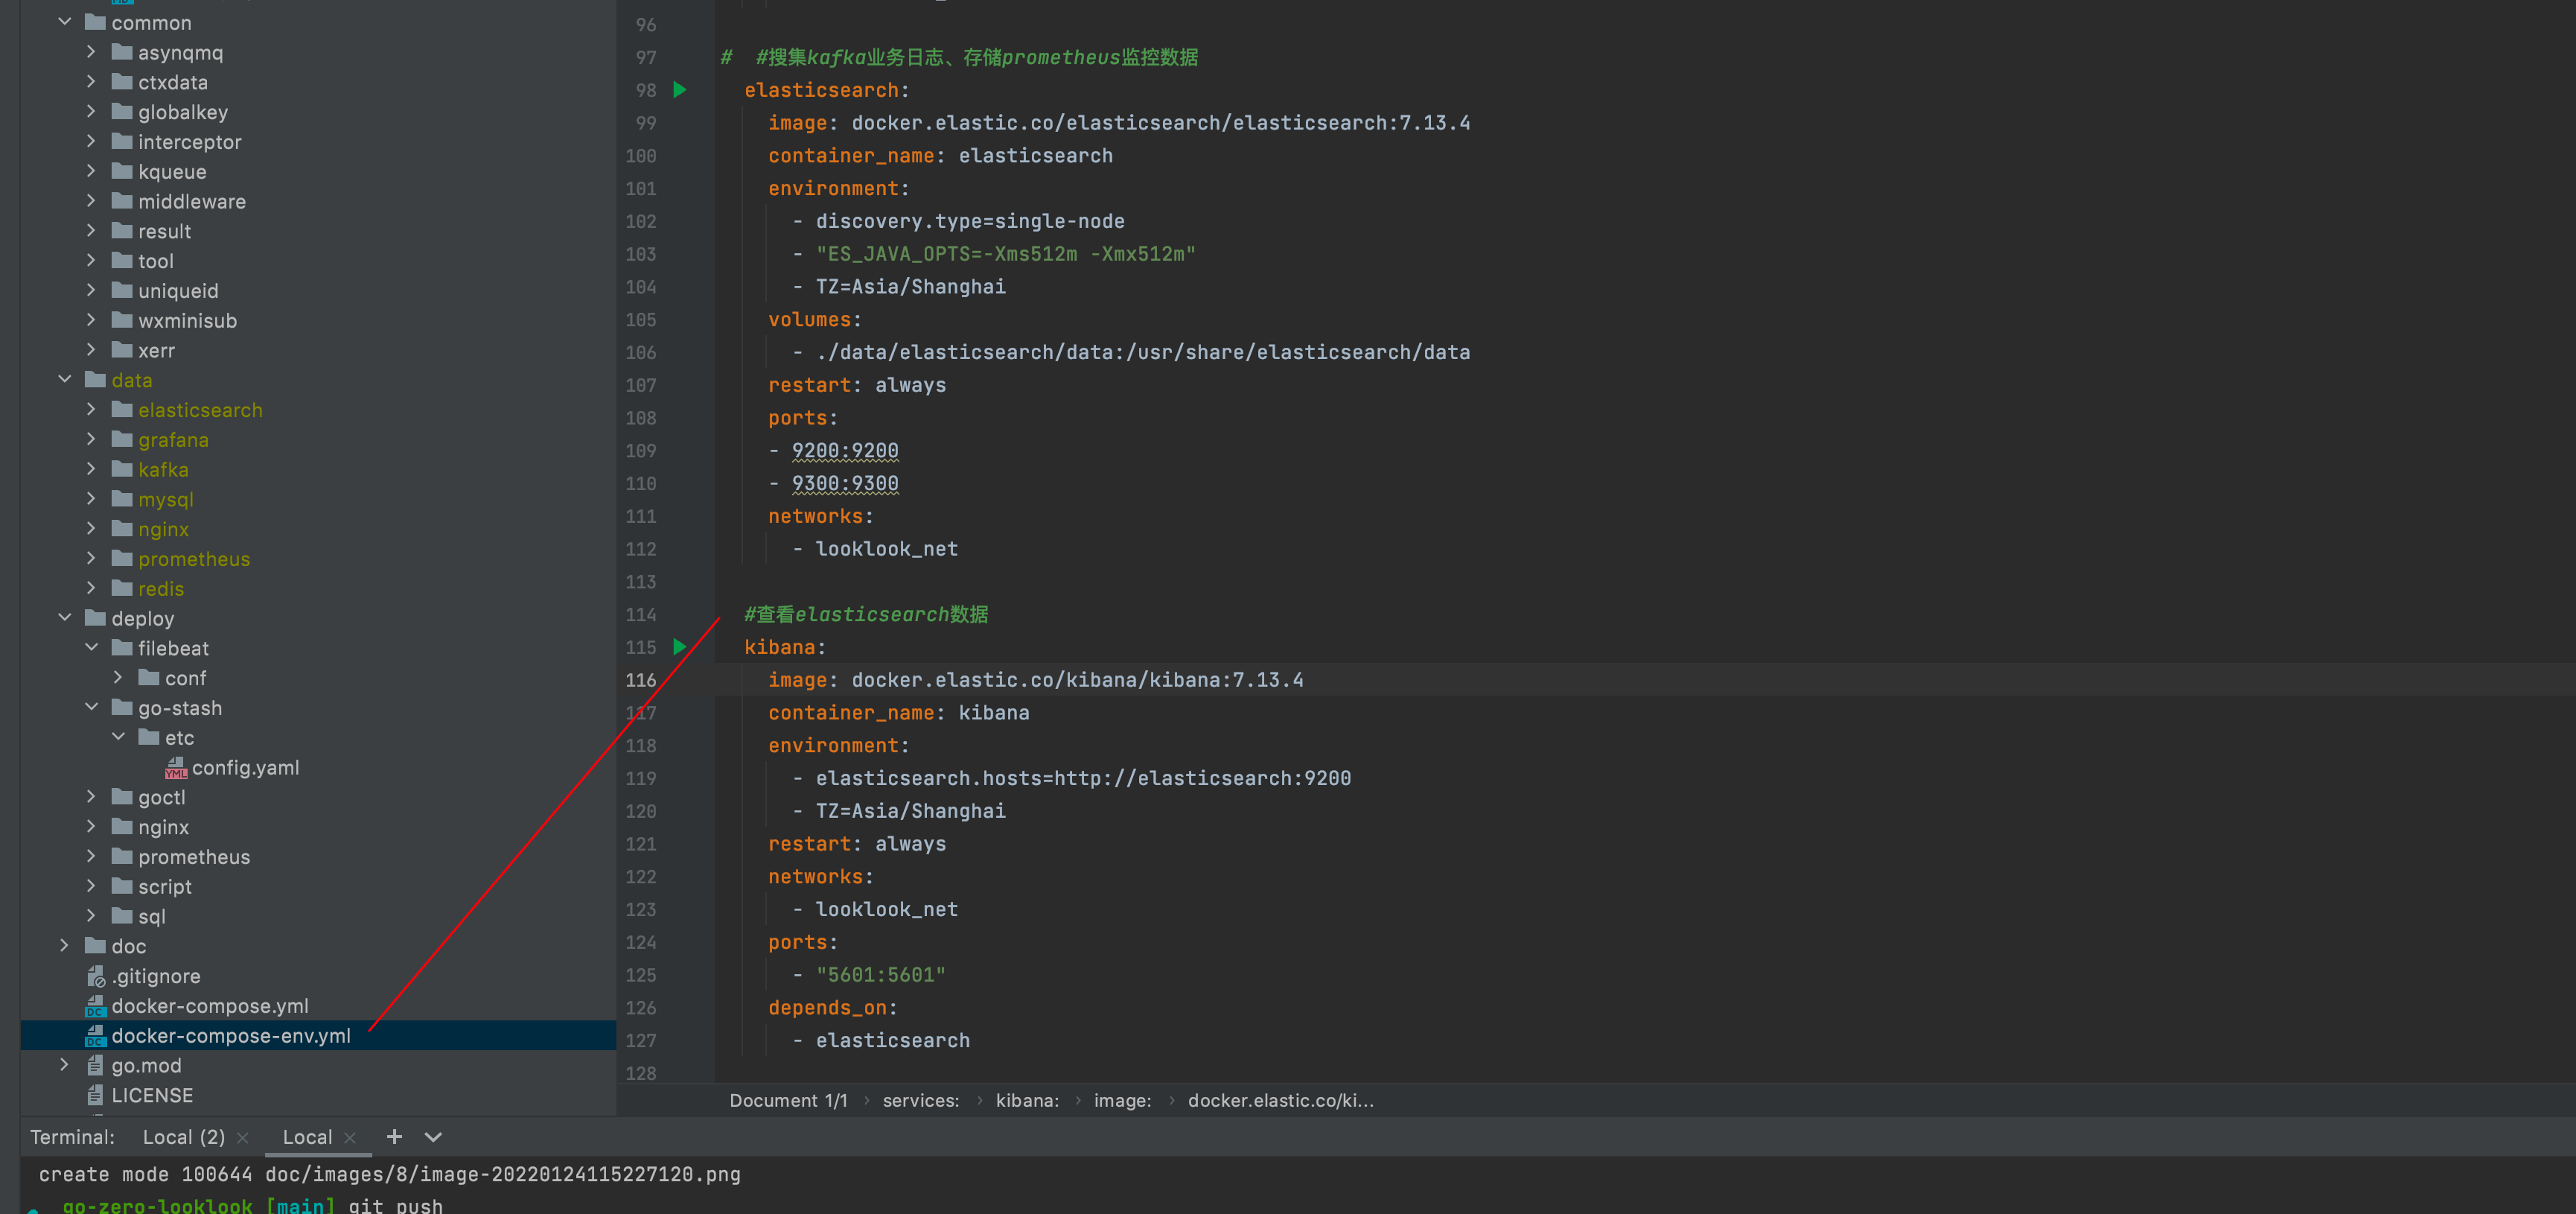
Visit kibana http://127.0.0.1:5601/ , create log index
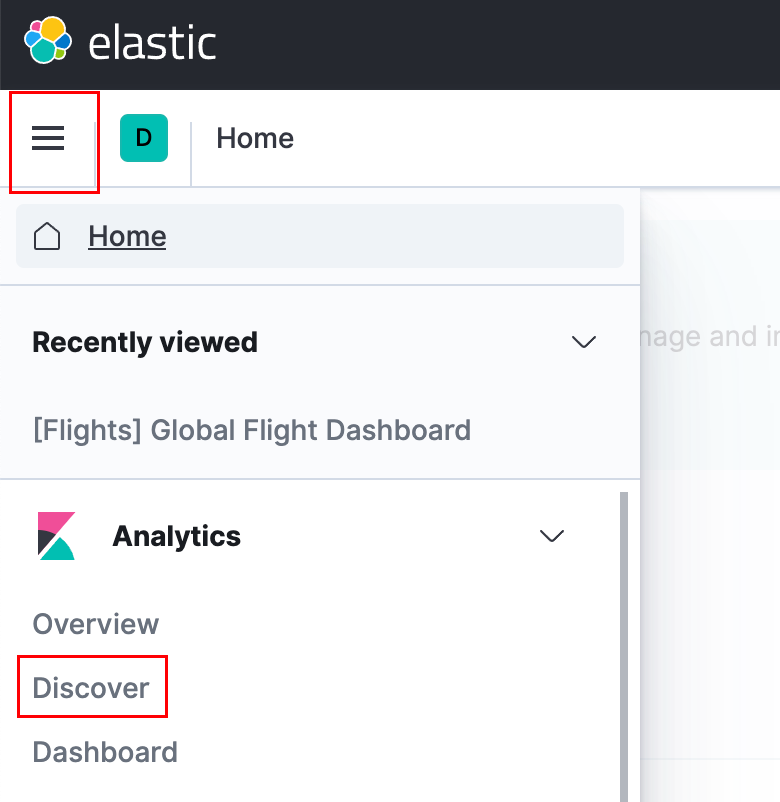
Click the menu in the upper left corner (the one with three horizontal lines), find Analytics - > Click discover
Then on the current page, create index pattern - > Enter look - * - > next step - > select @ timestamp - > create index pattern
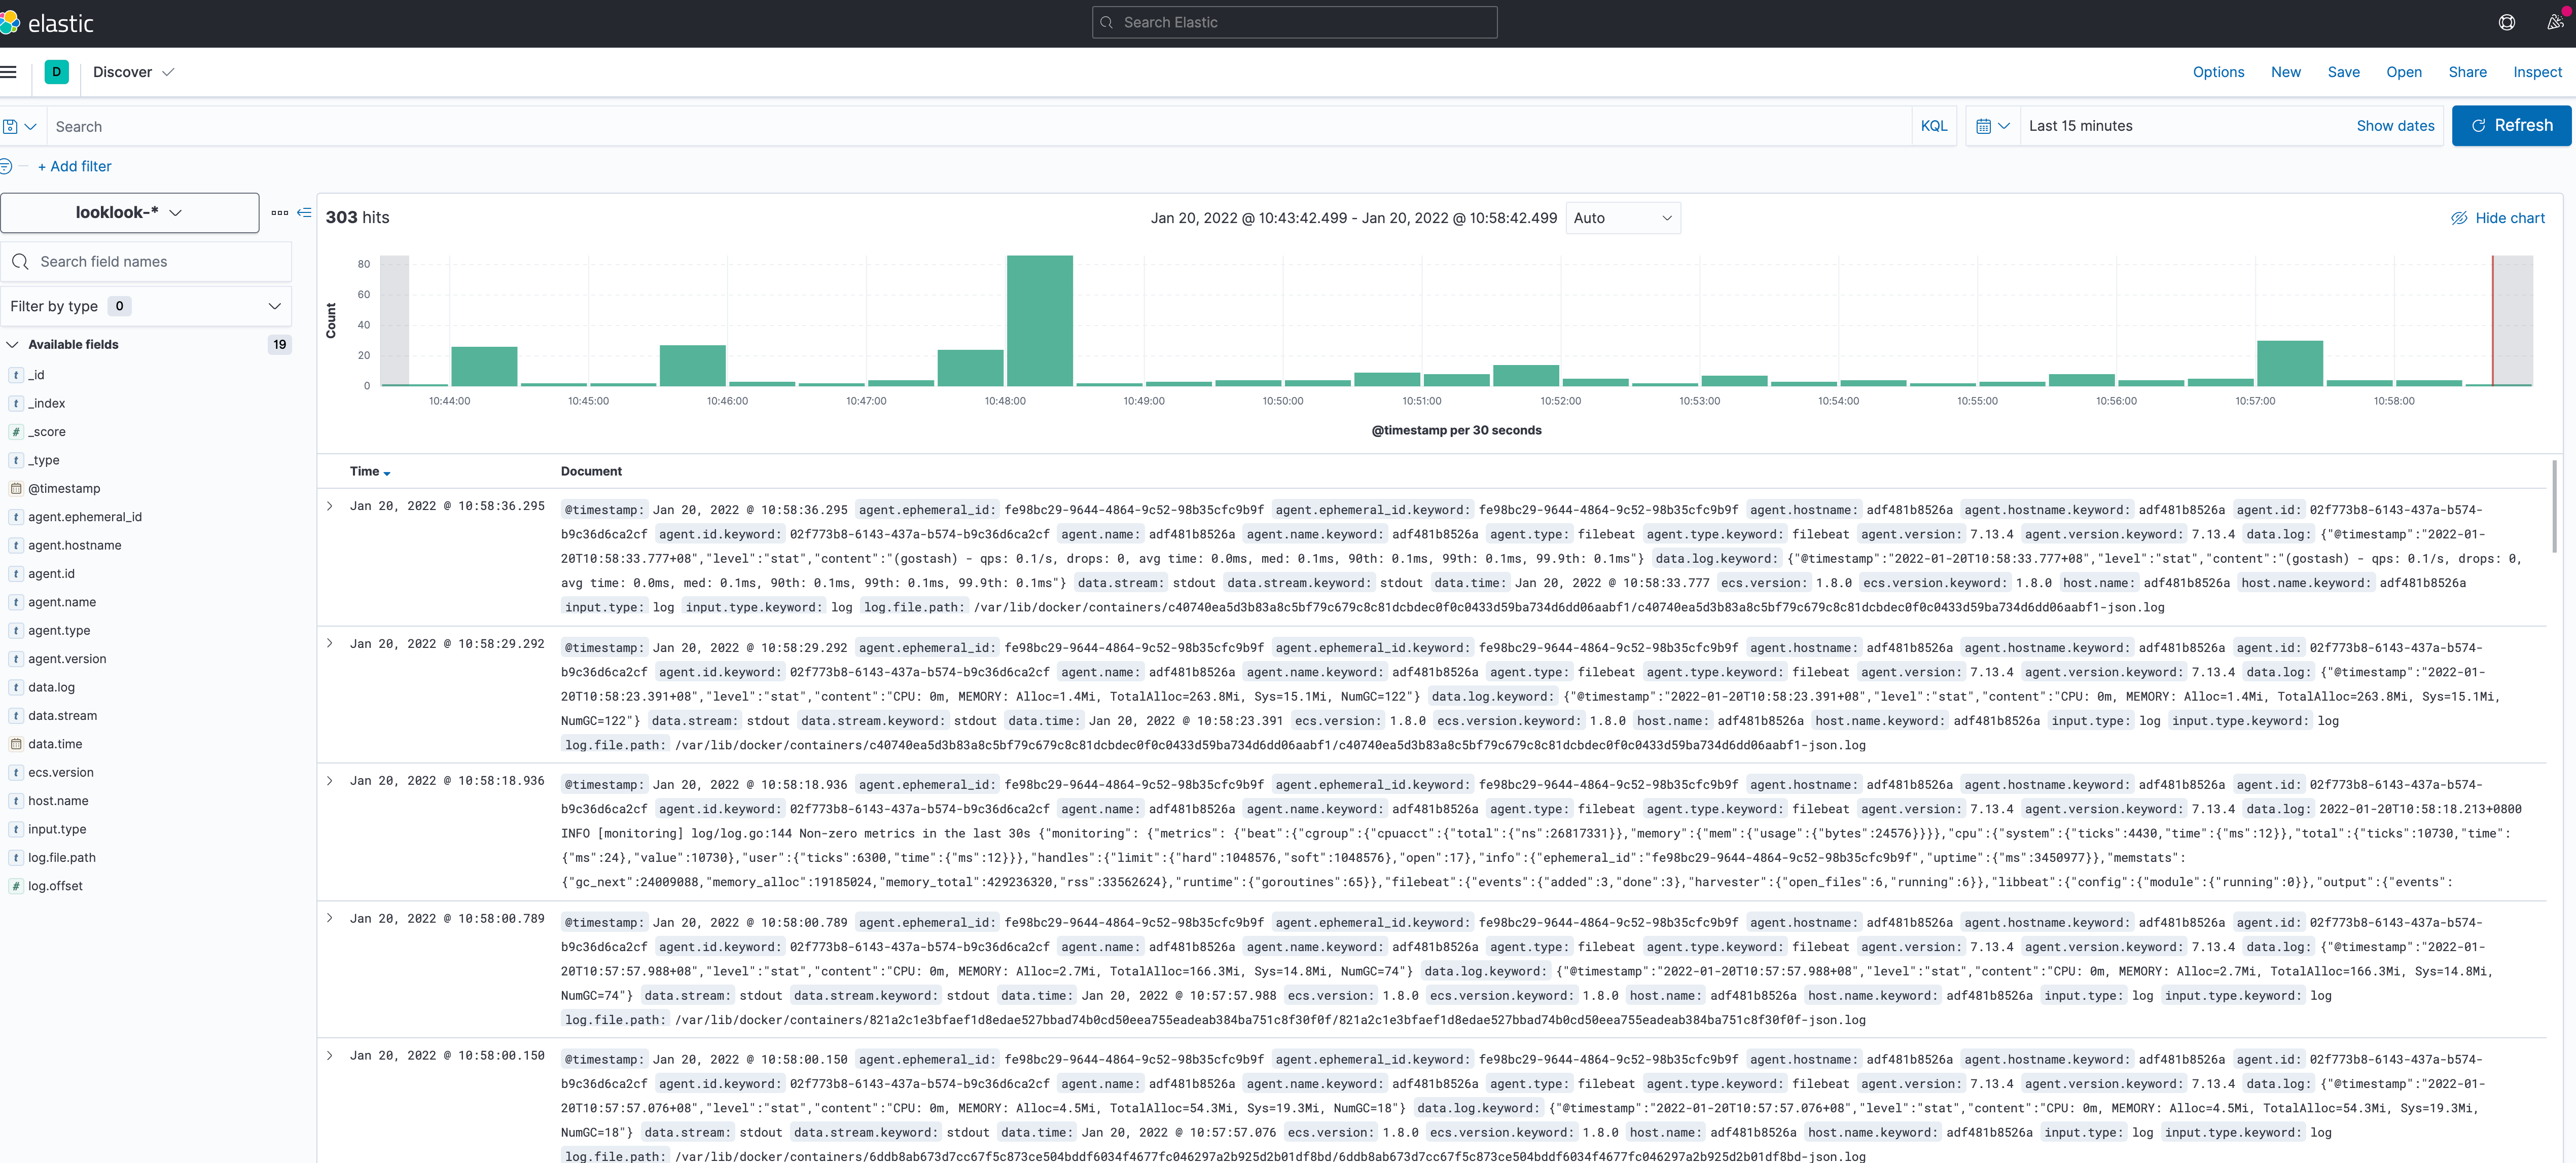
Then click the menu in the upper left corner, find Analytics - > Click discover, wait a moment, and the logs will be displayed (if not, check filebeat and go stash, and use docker logs -f filebeat to view)
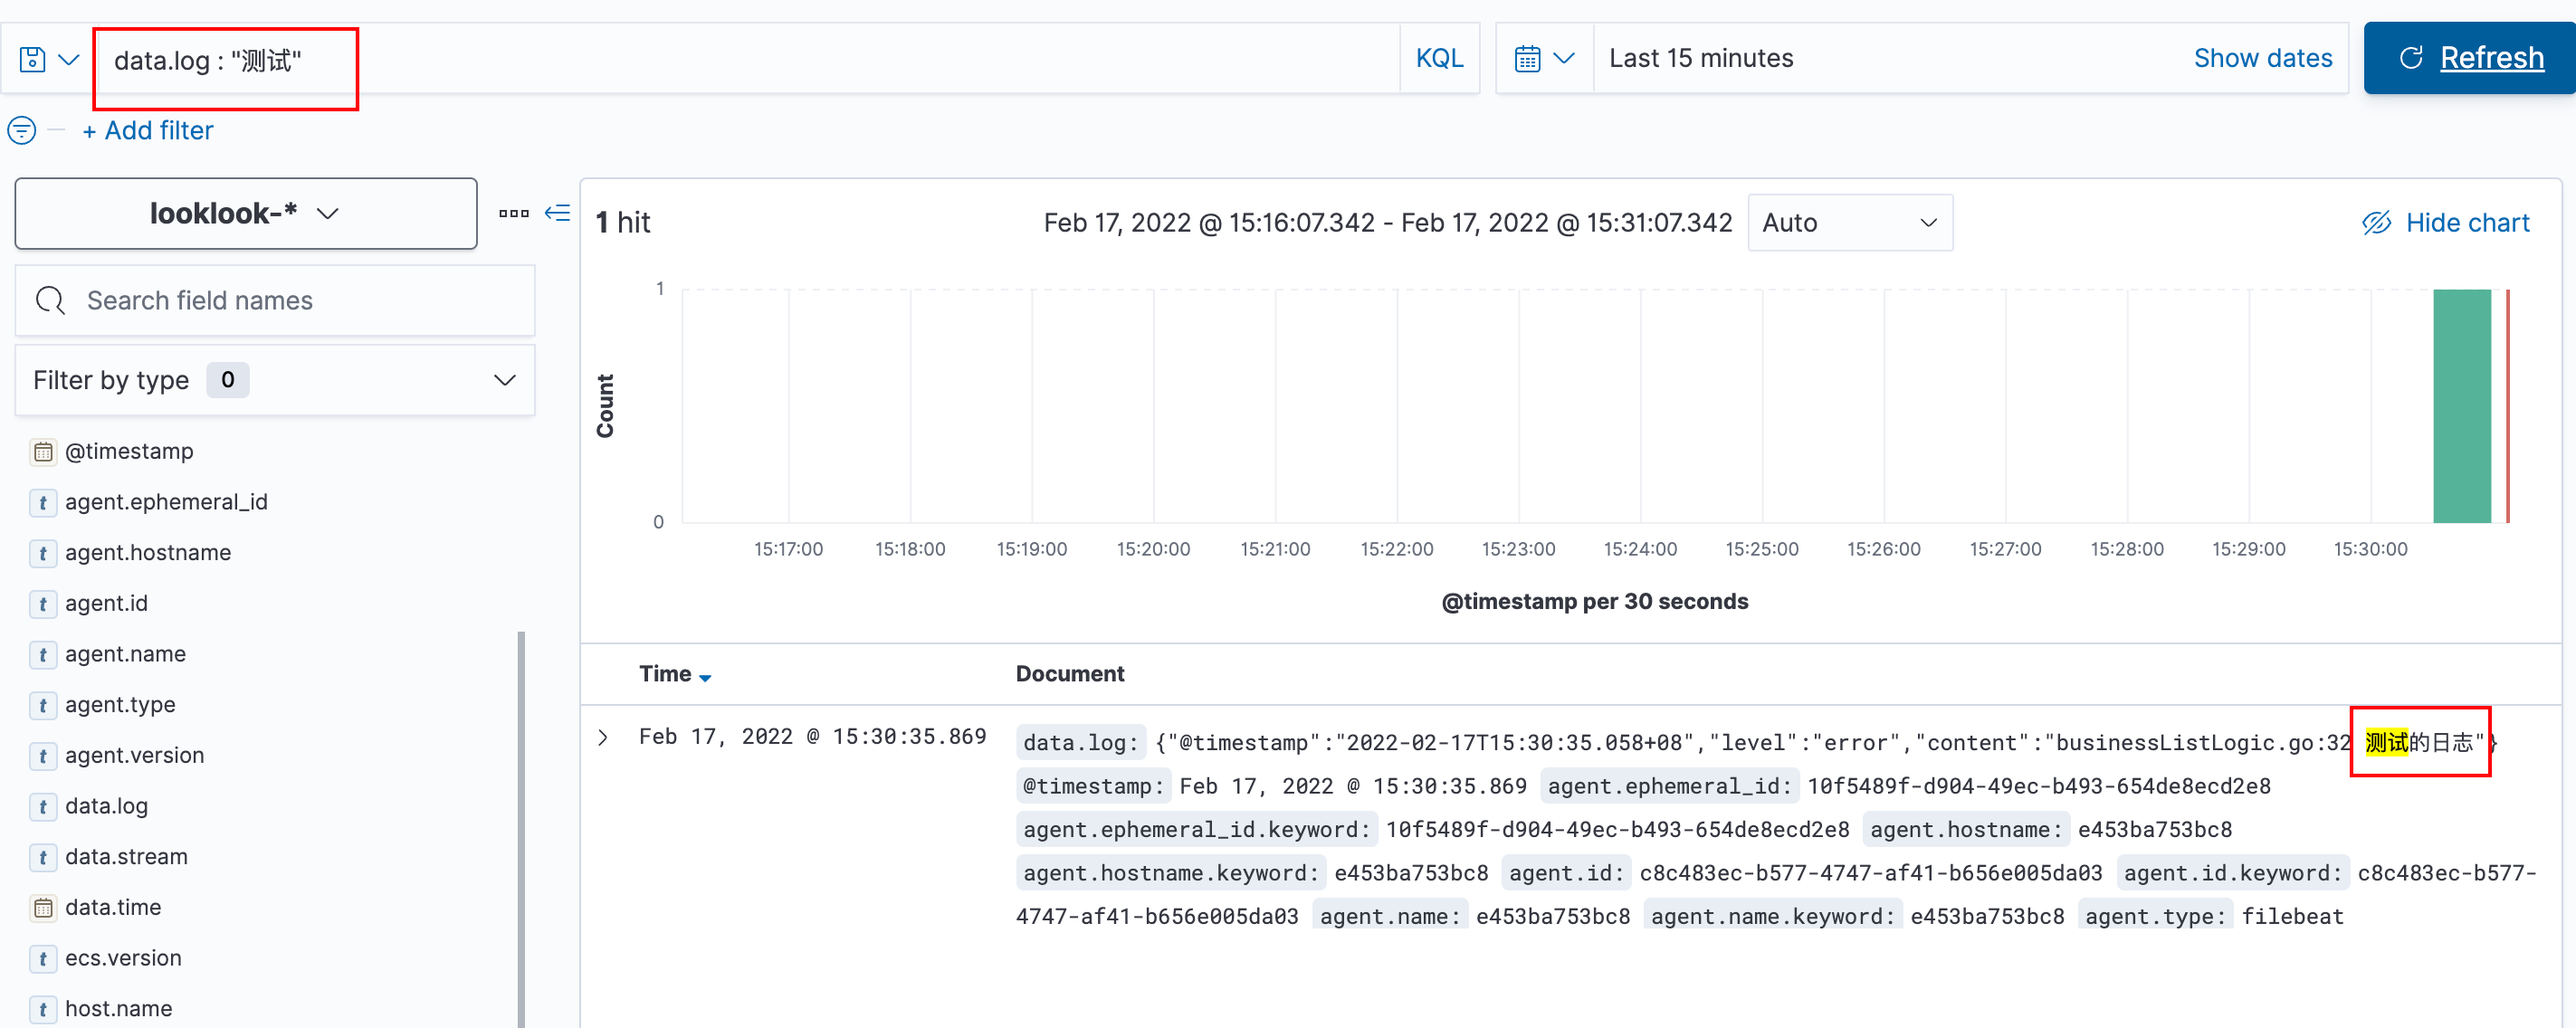
Let's add an error log to the code and try it. The code is as follows
func (l *BusinessListLogic) BusinessList(req types.BusinessListReq) (*types.BusinessListResp, error) {

	logx.Error("Test log")

	...
}
We visit this business method and search kibana for data The test diagram is as follows: "log"
4. Ending
This completes the log collection. Next, we need to implement link tracking
Project address
https://github.com/zeromicro/go-zero
https://gitee.com/kevwan/go-zero
Welcome to go zero and star support us!
Wechat communication group
Focus on the "micro service practice" official account and click on the exchange group to get the community community's two-dimensional code.