k-nearest neighbor learning
Mostly from watermelon books
1. General
k k k-nearest neighbor( k k K-nearest neighbor (KNN) learning is a commonly used supervised learning method, and its working mechanism is simple:
Given the test sample, find the closest distance in the training set based on a certain distance measure k k k training samples, and then based on this k k Predict the information of k "neighbors". In general, you can use "voting method" in classification tasks and select this method k k The most category markers in k samples are used as the prediction results; The "average method" can be used in the regression task, which is k k The real value of k samples outputs the average value of the mark as the prediction result; Weighted average or weighted voting can also be carried out based on distance. The closer the distance, the greater the weight of the sample.
KNN learning is a famous representative of "lazy learning". This kind of learning technology only saves the samples in the training stage, and the training time cost is zero. It will be processed after receiving the test samples. On the contrary, the method of learning and processing samples in the retraining stage is called "eager learning"
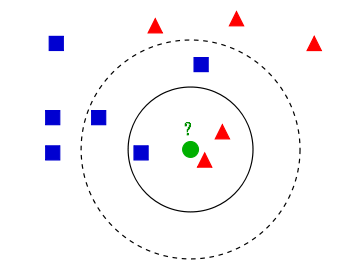
obviously, k k k is an important hyperparameter when k k When k takes different values, the classification results will also be significantly different. On the other hand, if different distance calculation methods are used, the "nearest neighbors" found may be significantly different, which will also lead to significantly different classification results.
2. Distance measurement
The following is taken from( https://blog.csdn.net/weixin_45884316/article/details/115221211)
The distance between two instance points in feature space is the response of their similarity, so k k An important problem in k-nearest neighbor algorithm is to calculate the distance between samples to determine which samples in the training samples are closer to the test samples.
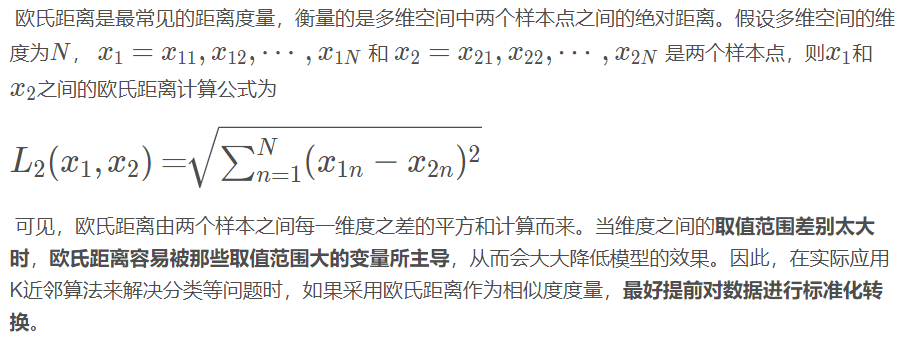
2.1 Euclidean distance
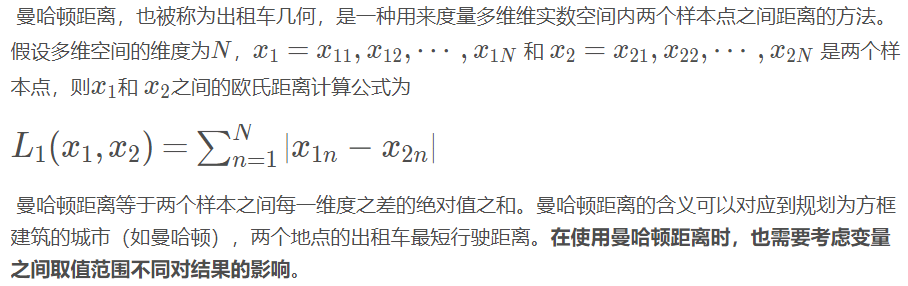
2.2 Manhattan distance
2.3 others
When the existing distance measurement methods can not meet the requirements, we can explore the distance measurement methods that meet the requirements.
In actual data, discrete variables and continuous variables often exist at the same time. How to calculate the sample similarity under this mixed variable is an open problem. A simple method is to perform one hot coding on the discrete variables in the sample before distance calculation, and then select the distance calculation method introduced above for processing.
3. Simple implementation of KNN
import numpy as np
import pandas as pd
from sklearn.datasets import load_breast_cancer
from sklearn.model_selection import train_test_split

# Handwritten KNN algorithm (classification task)
class KNN():
    def __init__(self, k=5):
        self.k = k

    def fit(self, xtrain, ytrain):  # Lazy learning, save training data
        self.xtrain = xtrain
        self.ytrain = ytrain

    # Construct distance calculation function
    def cal_distance(self, x):
        # x is a sample
        # Euclidean distance
        distance = np.sqrt(np.sum(np.power((np.mat(self.xtrain) - np.mat(x)), 2), axis=1))  # Broadcasting mechanism
        return distance

    # According to k voting law
    def k_vote(self, distance):
        index = np.argsort(distance, axis=0)[:self.k]
        labels = self.ytrain[index]
        labels = [i[0] for i in labels]  # Convert multiple nested array s into list s for easy processing
        label = pd.Series(labels).value_counts().idxmax()
        return label

    # Construct prediction function
    def predict(self, xtest):
        y_pred = []
        for i in xtest:
            distance = self.cal_distance(i)
            label = self.k_vote(distance)
            y_pred.append(label)
        return y_pred

    # Construct scoring score function
    def score(self, xtest, ytest):
        y_pred = self.predict(xtest)
        from sklearn.metrics import accuracy_score
        return accuracy_score(ytest, y_pred)


if __name__ == '__main__':
    # Read dataset
    data = load_breast_cancer()
    # Display in DateFrame format
    X = data.data
    y = data.target
    name = ['Average radius', 'Average texture', 'Average perimeter', 'Average area',
            'Average smoothness', 'Average compactness', 'Average concavity',
            'Average concave point', 'Average symmetry', 'Average fractal dimension',
            'Radius error', 'Texture error', 'Perimeter error', 'Area error',
            'Smoothness error', 'Compactness error', 'Concavity error',
            'Concave error', 'Symmetry error',
            'Fractal dimension error', 'Worst radius', 'Worst texture',
            'Worst boundary', 'Worst area', 'Worst smoothness',
            'Worst compactness', 'Worst depression', 'Worst concave point',
            'Worst symmetry', 'Worst fractal dimension', 'Sick or not']
    data = np.concatenate((X, y.reshape(-1, 1)), axis=1)
    table = pd.DataFrame(data=data, columns=name)

    X = table.iloc[:, :-1]  # features
    y = table.iloc[:, -1]  # label
    Xtrain, Xtest, Ytrain, Ytest = train_test_split(X, y, test_size=0.3, random_state=420)

    clf = KNN()
    clf.fit(np.array(Xtrain), np.array(Ytrain))
    acc = clf.score(np.array(Xtest), np.array(Ytest))
    print(acc)

    """
    0.9181286549707602
    """
4. Implementation of sklearn Library
from sklearn.neighbors import KNeighborsClassifier
from sklearn.datasets import load_breast_cancer
from sklearn.model_selection import train_test_split
import pandas as pd
import numpy as np


#Read dataset
data = load_breast_cancer()
#Display in DateFrame format
X = data.data
y = data.target
name = ['Average radius','Average texture','Average perimeter','Average area',
    'Average smoothness','Average compactness','Average concavity',
    'Average concave point','Average symmetry','Average fractal dimension',
    'Radius error','Texture error','Perimeter error','Area error',
    'Smoothness error','Compactness error','Concavity error',
    'Concave error','Symmetry error',
    'Fractal dimension error','Worst radius','Worst texture',
    'Worst boundary','Worst area','Worst smoothness',
    'Worst compactness','Worst depression','Worst concave point',
    'Worst symmetry','Worst fractal dimension','Sick or not']
data=np.concatenate((X,y.reshape(-1,1)),axis=1)
table=pd.DataFrame(data=data,columns=name)
X = table.iloc[:,:-1] # features
y = table.iloc[:,-1] # label

# Divide test set and training set (Xtrain,Xtest,Ytrain,Ytest)
Xtrain,Xtest,Ytrain,Ytest = train_test_split(X,y,test_size = 0.2,random_state=420)# random_state random seed random sampling

#modeling
clf = KNeighborsClassifier(n_neighbors=5)
clf = clf.fit(Xtrain,Ytrain)

score = clf.score(Xtest,Ytest)
print(score)
'''
0.9385964912280702
'''
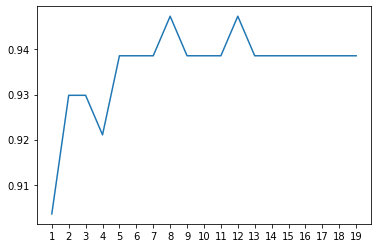
5. Draw the learning curve to determine the optimal super parameters k k k
import matplotlib.pyplot as plt
score = [] # Score list

k = range(1,20) # Set k range

# Traverse k and calculate scores respectively
for i in k:
    clf = KNeighborsClassifier(n_neighbors=i)
    clf = clf.fit(Xtrain,Ytrain)

    score.append(clf.score(Xtest,Ytest))

plt.plot(k,score)
_ = plt.xticks(range(1,20)) # x-axis scale
plt.show
It is only used for learning notes, and can be infringed or deleted