1, K-fold cross validation
If the given sample data is sufficient, a simple method for model selection is to randomly cut the data set into three parts, including training set, verification set and test set. The training set is used to train the model. Generally speaking, the amount of data is larger. The verification set is used to select the model, and the test set is used to finally evaluate the learning method (view the generalization ability of the model)
Among the learned models with different complexity, the model with the minimum prediction error for the verification set is selected. Because the verification set has enough data, it is also effective to use it for model selection.
However, in many practical applications, the data is insufficient. In order to better select the model, the cross validation method can be used. The basic idea of cross validation is to reuse data; The given data is segmented, and the segmented data set is combined into training set and test set. On this basis, training, testing and model selection are carried out repeatedly.
In the course, the teacher gave an example of using k-fold cross validation to select the hyperparameters of k-nearest neighbor algorithm, and calculated the accuracy of the model under different K values, so as to select the appropriate hyperparameters.
import matplotlib.pyplot as plt
import numpy as np
import pandas as pd
# Another drawing tool, the bottom layer is matplotlib, which is improved on the basis of
import seaborn as sns
from sklearn.metrics import accuracy_score
from sklearn import datasets # Import dataset
# Import dataset partitioning tool
from sklearn.model_selection import train_test_split, cross_val_score
# Standardization
from sklearn.preprocessing import StandardScaler
# Import model
from sklearn.linear_model import LogisticRegression
# Import k nearest neighbor package
from sklearn.neighbors import KNeighborsClassifier
# Import dataset
iris = datasets.load_iris()
# Divide the model into data and labels
X, target = iris.data, iris.target
# Data standardization, calculate the mean and standard deviation of the data
X = StandardScaler().fit_transform(X)
def K_nn_model_train(X, y):
    # Ten times cross validation method is used to select the hyperparameters of k-nearest neighbor algorithm and divide the data set
    X_train, X_test, y_train, y_test = train_test_split(X, y, test_size=0.3, random_state=111, stratify=y)
    # Hyperparametric interval
    k = range(1, 31)
    # Store the mean value of 10 cross verifications for each parameter adjustment
    cv_scores = []
    for i in k:
        knn = KNeighborsClassifier(i,algorithm='brute')
        scores = cross_val_score(knn, X_train, y_train, scoring='accuracy', cv=10)
        cv_scores.append(scores.mean())
    return cv_scores

def plt__knn_score(cv_score):
    # Draw knn parameter selected image
    plt.plot(cv_score, '.-')
    plt.xlabel("knn-k value")
    plt.ylabel("mean accuracy")
    plt.title("KNN super-args of mean accuracy")
    plt.show()
2, Evaluation method - self help method
The self-help method is directly based on the self-help sampling method. Given a data set D containing m samples, sample it to generate a data set D(new), randomly select a sample from D each time, copy it into D(new), and then put the sample back into the original data set D, so that the sample may still be collected at the next sampling. Repeat this process m times to obtain the data set D(new) containing m samples.
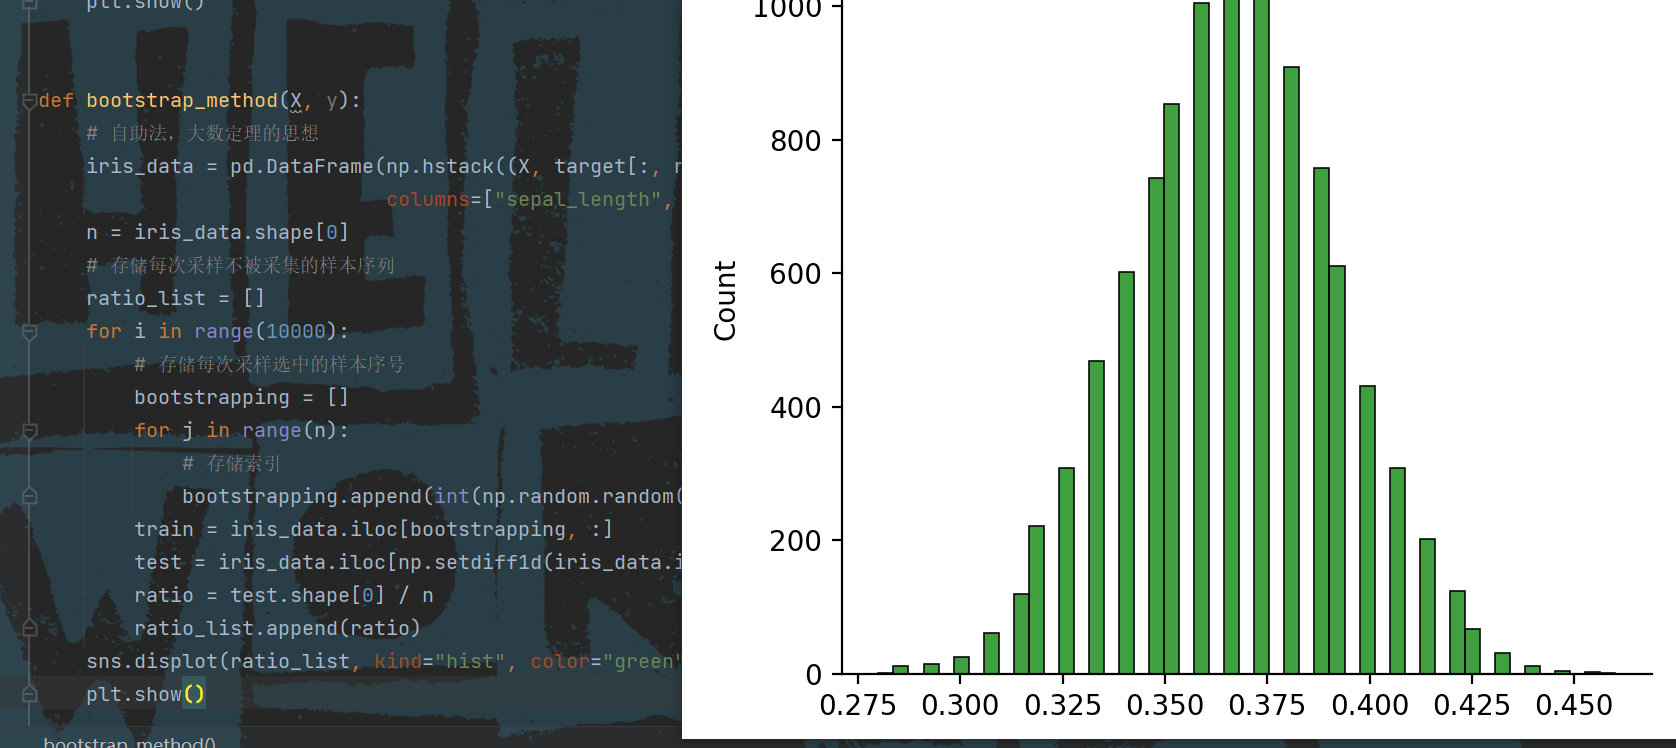
About 36.8% of the samples in the initial data set D do not appear in the new data set, so the new data set can be used as the training set, and the original data set can be used as the test set after removing the elements in the new data set. In this way, both the actual evaluation model and the expected evaluation model use m training samples, and still one third of the samples that do not appear in the training set are used for testing. Such test results are called out of bad estimate
The self-help method is useful when the data set is small, but it will change the original data distribution and introduce estimation bias.
The code is:
import matplotlib.pyplot as plt
import numpy as np
import pandas as pd
# Another drawing tool, the bottom layer is matplotlib, which is improved on the basis of
import seaborn as sns
from sklearn.metrics import accuracy_score
from sklearn import datasets # Import dataset
# Import dataset partitioning tool
from sklearn.model_selection import train_test_split, cross_val_score
# Standardization
from sklearn.preprocessing import StandardScaler
# Import model
from sklearn.linear_model import LogisticRegression
# Import k nearest neighbor package
from sklearn.neighbors import KNeighborsClassifier
# Import dataset
iris = datasets.load_iris()
# Divide the model into data and labels
X, target = iris.data, iris.target
# Data standardization, calculate the mean and standard deviation of the data
X = StandardScaler().fit_transform(X)
def bootstrap_method(X, y):
    # Self help method, the idea of large number theorem
    iris_data = pd.DataFrame(np.hstack((X, target[:, np.newaxis])),
                             columns=["sepal_length", "sepal_width", "petal_length", "petal_width", "class"])
    n = iris_data.shape[0]
    # Store the sample sequence that is not collected for each sampling
    ratio_list = []
    for i in range(10000):
        # Stores the serial number of the selected samples for each sampling
        bootstrapping = []
        for j in range(n):
            # Storage index
            bootstrapping.append(int(np.random.random()*n))
        train = iris_data.iloc[bootstrapping, :]
        test = iris_data.iloc[np.setdiff1d(iris_data.index, train.index)]
        ratio = test.shape[0] / n
        ratio_list.append(ratio)
    sns.displot(ratio_list, kind="hist", color="green")
    plt.show()
Operation results:
3, Use
With the data set sampled by the above self-service method, the model can be trained and tested on the data set. Due to too many sampling times and slow running speed, some changes have been made here. At the same time, the model is trained and predicted with its data after each sampling
The code is as follows:
import matplotlib.pyplot as plt
import numpy as np
import pandas as pd
# Another drawing tool, the bottom layer is matplotlib, which is improved on the basis of
import seaborn as sns
from sklearn.metrics import accuracy_score
from sklearn import datasets # Import dataset
# Import dataset partitioning tool
from sklearn.model_selection import train_test_split, cross_val_score
# Standardization
from sklearn.preprocessing import StandardScaler
# Import model
from sklearn.linear_model import LogisticRegression
# Import k nearest neighbor package
from sklearn.neighbors import KNeighborsClassifier
# Import dataset
iris = datasets.load_iris()
# Divide the model into data and labels
X, target = iris.data, iris.target
# Data standardization, calculate the mean and standard deviation of the data
X = StandardScaler().fit_transform(X)


def bootstrap_method(X, y):
    # Self help method, the idea of large number theorem
    iris_data = pd.DataFrame(np.hstack((X, target[:, np.newaxis])),
                             columns=["sepal_length", "sepal_width", "petal_length", "petal_width", "class"])
    n = iris_data.shape[0]
    # Store the sample sequence that is not collected for each sampling
    ratio_list = []
    for i in range(100):
        # Stores the serial number of the selected samples for each sampling
        bootstrapping = []
        for j in range(n):
            # Storage index
            bootstrapping.append(int(np.random.random()*n))
        train = iris_data.iloc[bootstrapping, :]
        # The method function of pandas can extract the data in the data frame according to the index
        test = iris_data.iloc[np.setdiff1d(iris_data.index, train.index)]
        bootstrap_train_model(train, test)
        ratio = test.shape[0] / n
        ratio_list.append(ratio)
    sns.displot(ratio_list, kind="hist", color="green")
    plt.show()


def bootstrap_train_model(train, test):
    X_train, y_train = train.iloc[:, 0:4].values, train.iloc[:, 4].values
    X_test, y_test = test.iloc[:, 0:4].values, test.iloc[:, 4].values
    print(len(X_train))
    print(len(X_test))
    # The hyperparameter obtained by K-fold cross validation is 14 for the teacher and 7 for me
    knn = KNeighborsClassifier(7)
    knn.fit(X_train, y_train)
    y_pre = knn.predict(X_test)
    acc = accuracy_score(y_test, y_pre)
    print("The generalization accuracy is:", acc)


if __name__ == "__main__":
    # cv_score = K_nn_model_train(X,target)
    # train_precision, test_precision = model_learn(X, LogisticRegression)
    # plt_precision(train_precision, test_precision)
    # plt__knn_score(cv_score)
    bootstrap_method(X, target)
Summary: the self-help method is used to extract data and obtain multiple data sets. During training, it is ensured that 150 data are sent into the model training every time, and the data in it comes from sampling the original data set; The test set changes according to each sampling. The data in the test set is always the original data set, excluding the data in the sampling data set, so that the data content in the test set is completely different from the training set.
Methods to master:
K-fold cross validation idea
Self help method to enhance data
DataFrame data structure of pandas
numpy. The setdiffld (List 1, list 2) method can compare the elements in the two lists and return the data contained in list 1 but not in list 2, which is equivalent to culling the data in list 1. The culled objects are the data in list 2.
give an example:
List 1 = [1, 2, 3, 4]
List 2 = [2, 3]
Return value: [1, 4]