Introduction: If the model is used to scan the identified picture, a peak will appear at the corresponding picture position. But for other figures, there are different fluctuations. Based on this phenomenon, it is necessary to further test the annotation for dynamically determining the position of the number.
Key words: seven segment numbers, recognition
§ 01 scanning pictures
in Improving the seven segment digital model: a key digital 1 problem A network model with better generalization characteristics is trained in. Let's test its one-dimensional and two-dimensional scanning of images. Is:
- Find a better method of image segmentation;
- Realize the positioning of specific objects in the picture;
give the experimental basis.
1.1 seven segment digital recognition model
in Improving the seven segment digital model: a key digital 1 problem The seven segment digital recognition model established in is seg7model4_1_all.pdparams. Its structure code:
import paddle
import paddle.fluid as fluid
import cv2

imgwidth = 48
imgheight = 48
inputchannel = 1
kernelsize   = 5
targetsize = 10
ftwidth = ((imgwidth-kernelsize+1)//2-kernelsize+1)//2
ftheight = ((imgheight-kernelsize+1)//2-kernelsize+1)//2

class lenet(paddle.nn.Layer):
    def __init__(self, ):
        super(lenet, self).__init__()
        self.conv1 = paddle.nn.Conv2D(in_channels=inputchannel, out_channels=6, kernel_size=kernelsize, stride=1, padding=0)
        self.conv2 = paddle.nn.Conv2D(in_channels=6, out_channels=16, kernel_size=kernelsize, stride=1, padding=0)
        self.mp1    = paddle.nn.MaxPool2D(kernel_size=2, stride=2)
        self.mp2    = paddle.nn.MaxPool2D(kernel_size=2, stride=2)
        self.L1     = paddle.nn.Linear(in_features=ftwidth*ftheight*16, out_features=120)
        self.L2     = paddle.nn.Linear(in_features=120, out_features=86)
        self.L3     = paddle.nn.Linear(in_features=86, out_features=targetsize)

    def forward(self, x):
        x = self.conv1(x)
        x = paddle.nn.functional.relu(x)
        x = self.mp1(x)
        x = self.conv2(x)
        x = paddle.nn.functional.relu(x)
        x = self.mp2(x)
        x = paddle.flatten(x, start_axis=1, stop_axis=-1)
        x = self.L1(x)
        x = paddle.nn.functional.relu(x)
        x = self.L2(x)
        x = paddle.nn.functional.relu(x)
        x = self.L3(x)
        return x

model = lenet()
model.set_state_dict(paddle.load('/home/aistudio/work/seg7model4_1_all.pdparams'))
1.2 test pictures
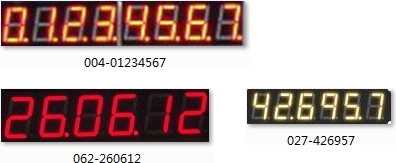
the digital pictures used for test scanning are shown in the figure below. Stored in ③ rk/7seg/SegScan.
1.3 scanning digital pictures
1.3.1 scan code
OUT_SIZE            = 48
def scanimg1d(imgfile, scanStep):
    img = cv2.imread(imgfile)
    gray = cv2.cvtColor(img, cv2.COLOR_BGR2GRAY)

    imgwidth = gray.shape[1]
    imgheight = gray.shape[0]

    imgarray = []
    blockwidth = int(imgheight * 0.5)
    startid = linspace(0, imgwidth-blockwidth, scanStep)
    for s in startid:
        left = int(s)
        right = int(s+blockwidth)

        data = gray[0:imgheight, left:right]
        dataout =cv2.resize(data, (OUT_SIZE, OUT_SIZE))
        dataout = dataout - mean(dataout)
        stdd = std(dataout)
        dataout = dataout/stdd

        imgarray.append(dataout[newaxis, :,:])

    model_input = paddle.to_tensor(imgarray, dtype='float32')
    preout = model(model_input)

    return preout

picimage = '/home/aistudio/work/7seg/SegScan/004-01234567.BMP'

out = scanimg1d(picimage, 200).numpy()

plt.figure(figsize=(12,8))
plt.plot(out[:,:3])
plt.xlabel("Scan Step")
plt.ylabel("Prediction")
plt.grid(True)
plt.tight_layout()
plt.show()
1.3.2 scanning results
the width of the scanning number is half the height.
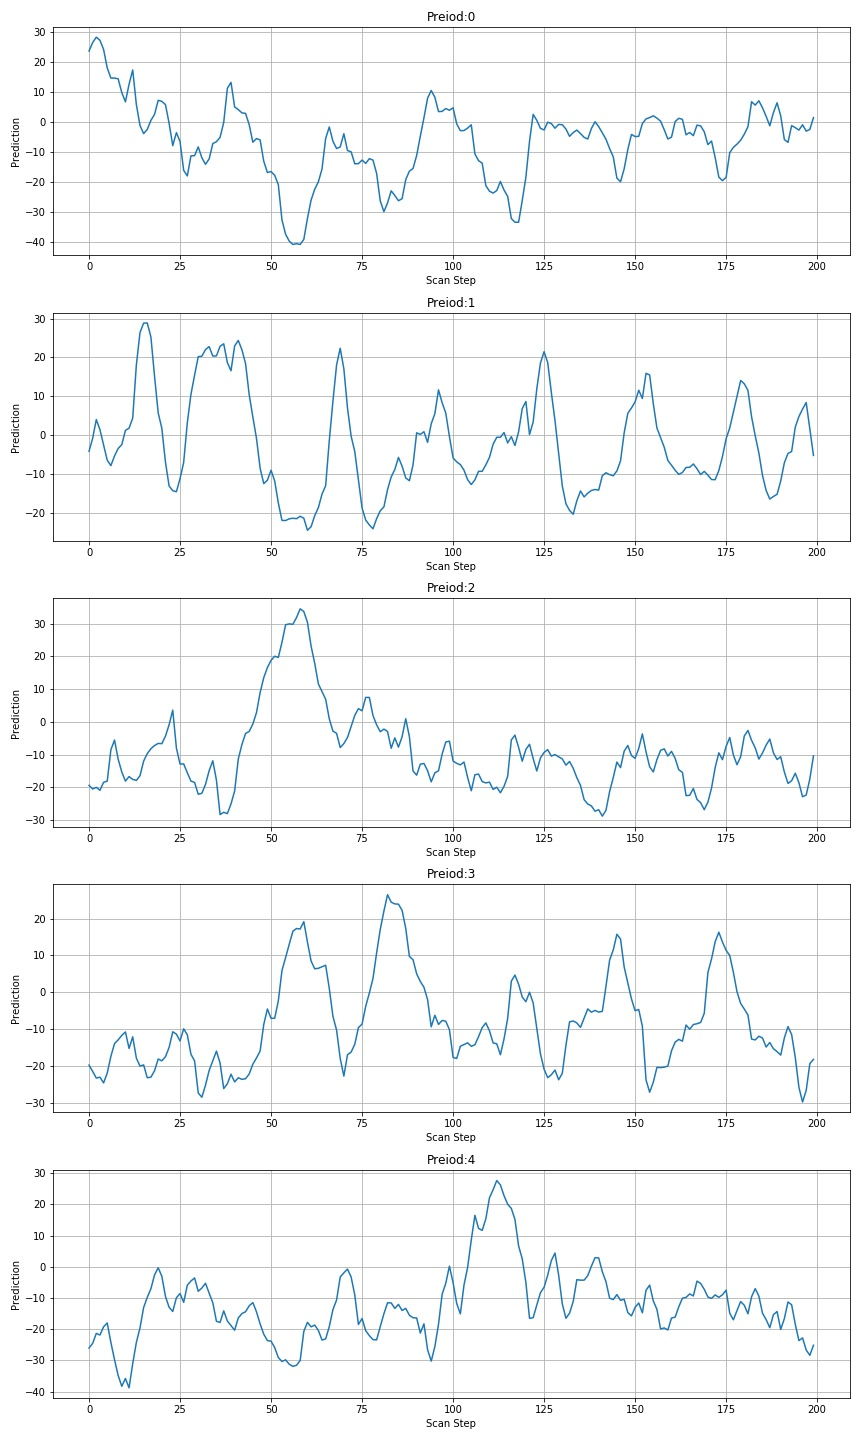
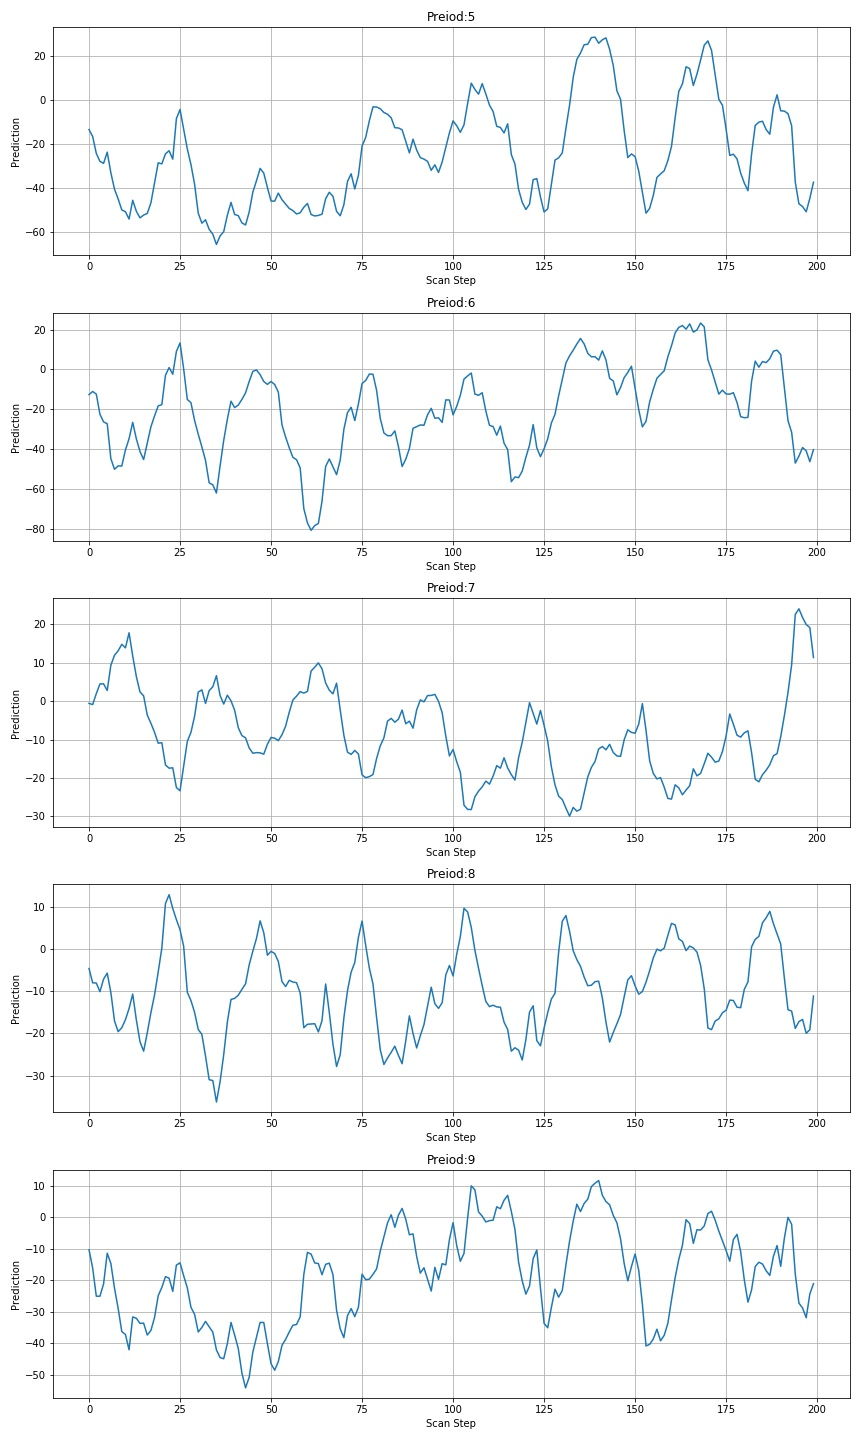 ▲ figure 1.3.2 prediction results of the last five digital scans
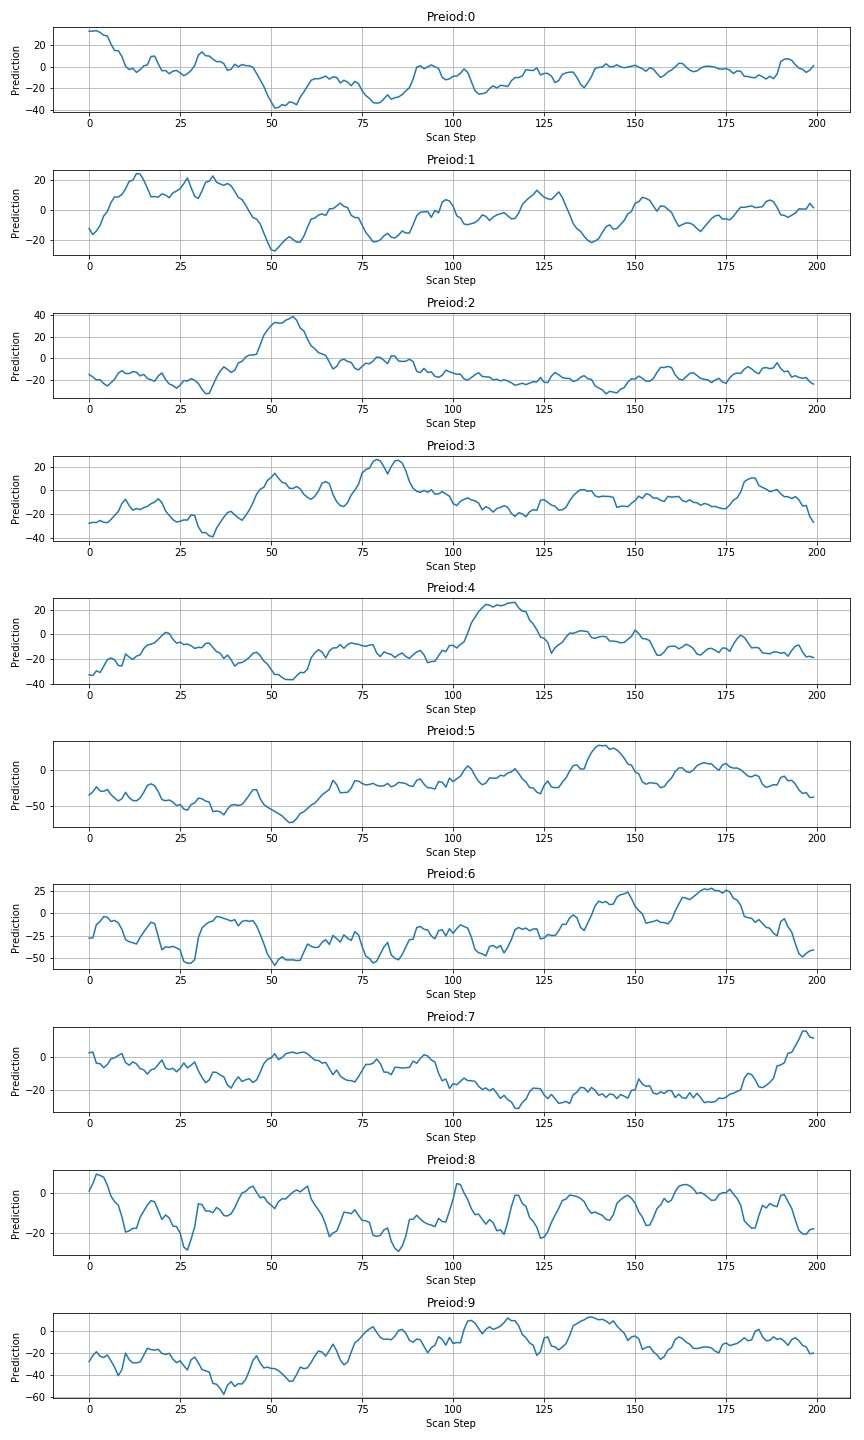
the following is the value after scanning with 0.75 times the height and width:
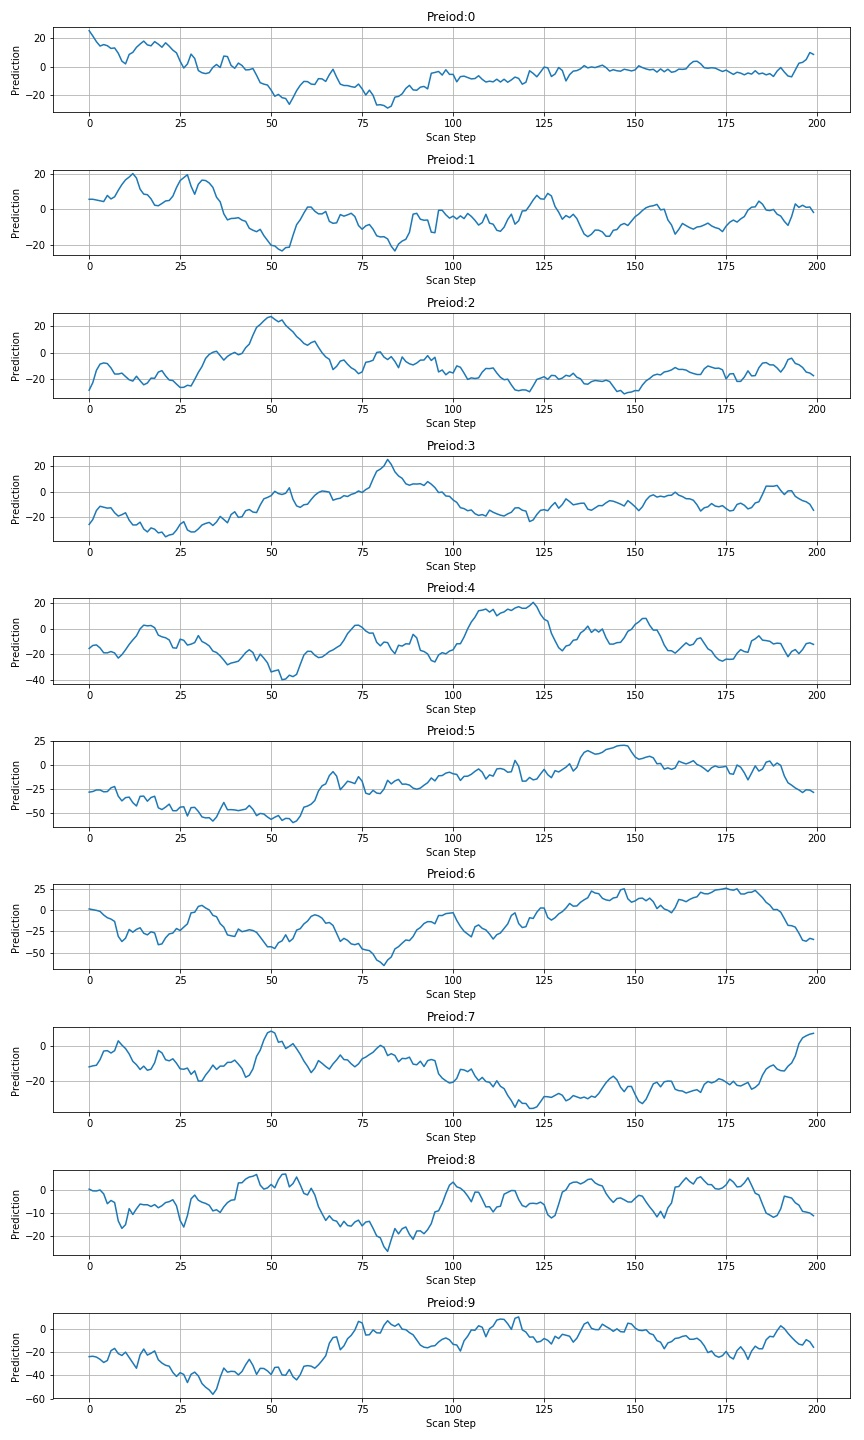
1.3.3 scanning 426957
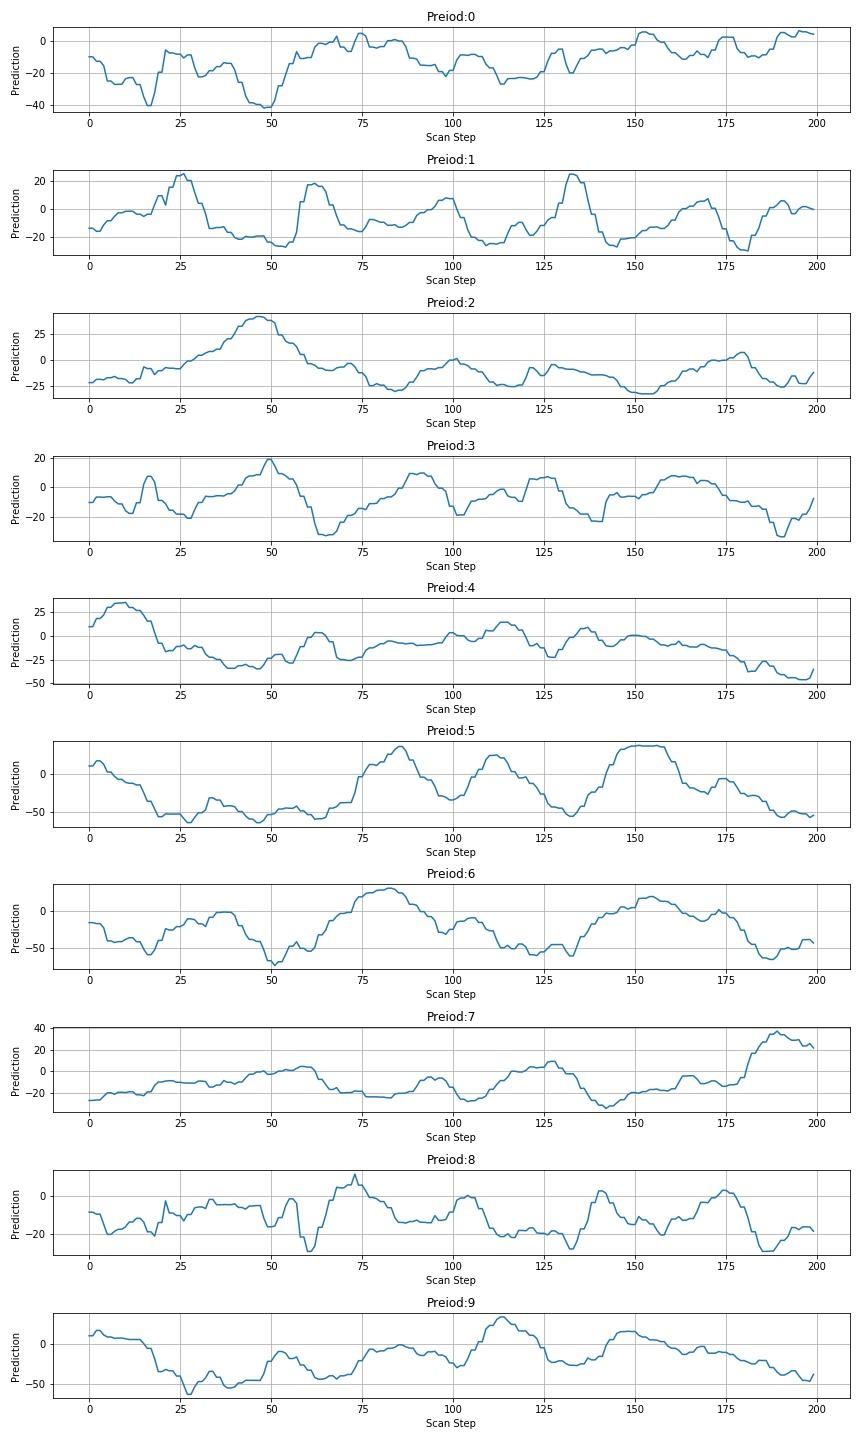
1.3.4 scan 260612 pictures
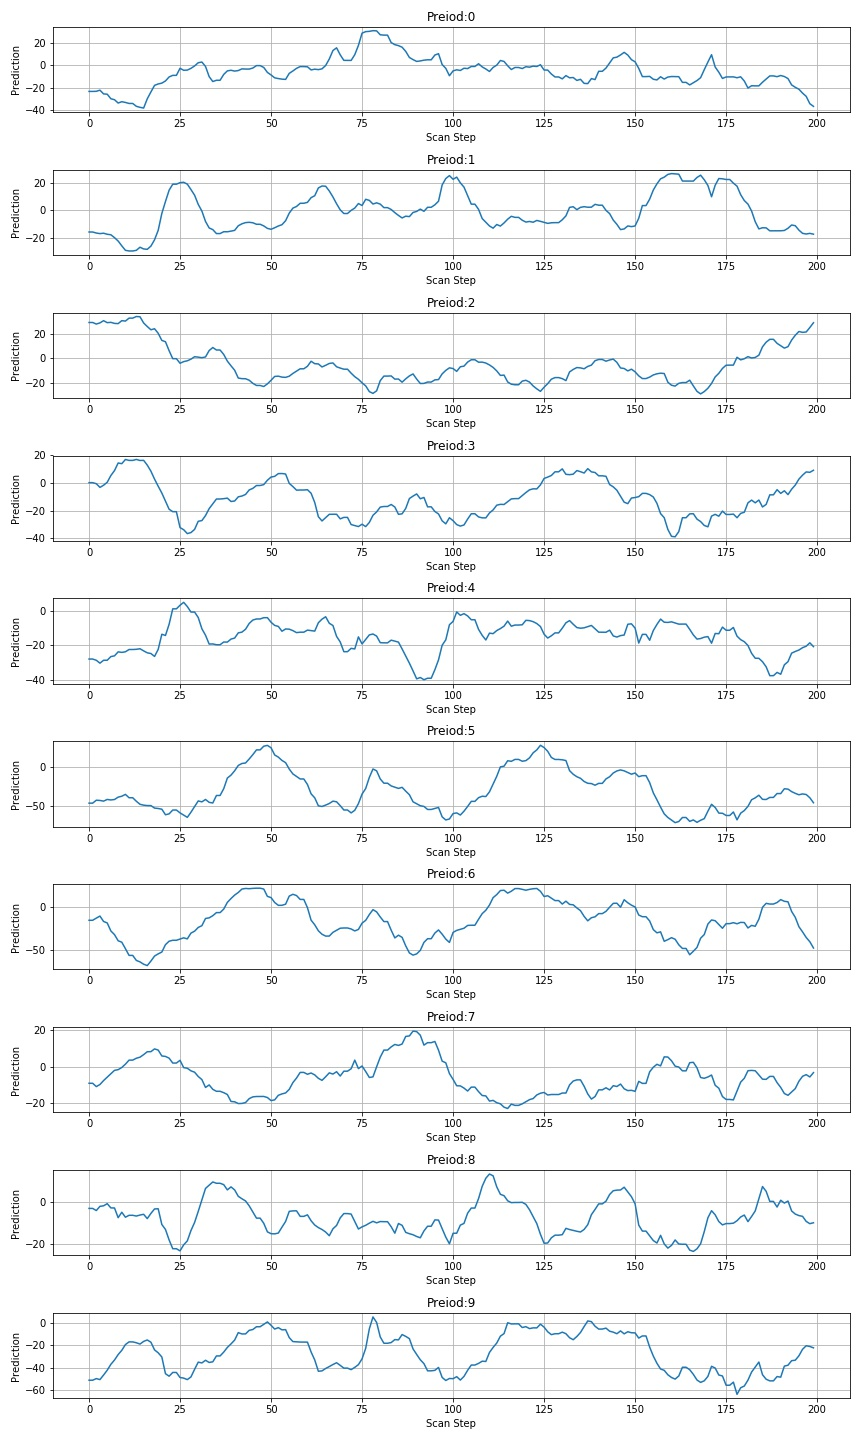
※ test summary ※
if the model is used to scan the identified picture, a peak will appear at the corresponding picture position. But for other figures, there are different fluctuations. Based on this phenomenon, it is necessary to further test the annotation for dynamically determining the position of the number.
■ links to relevant literature:
● relevant chart links:
- Figure 1.2.1 three digital bars for testing
- Figure 1.3.1 prediction results of the first five digital scans
- Figure 1.3.2 prediction results of the last five digital scans
- Figure 1.3.3 values after scanning using 0.75 times the height
- Figure 1.3.4 values after scanning with the same height and width
- Figure 1.3.5 scanning 426957 pictures
- Figure 1.3.6 scanning 260612 pictures
#!/usr/local/bin/python
# -*- coding: gbk -*-
#============================================================
# TEST1.PY                     -- by Dr. ZhuoQing 2022-01-03
#
# Note:
#============================================================

from headm import *                 # =


import paddle
import paddle.fluid as fluid
import cv2

#------------------------------------------------------------
imgwidth = 48
imgheight = 48
inputchannel = 1
kernelsize   = 5
targetsize = 10
ftwidth = ((imgwidth-kernelsize+1)//2-kernelsize+1)//2
ftheight = ((imgheight-kernelsize+1)//2-kernelsize+1)//2

class lenet(paddle.nn.Layer):
    def __init__(self, ):
        super(lenet, self).__init__()
        self.conv1 = paddle.nn.Conv2D(in_channels=inputchannel, out_channels=6, kernel_size=kernelsize, stride=1, padding=0)
        self.conv2 = paddle.nn.Conv2D(in_channels=6, out_channels=16, kernel_size=kernelsize, stride=1, padding=0)
        self.mp1    = paddle.nn.MaxPool2D(kernel_size=2, stride=2)
        self.mp2    = paddle.nn.MaxPool2D(kernel_size=2, stride=2)
        self.L1     = paddle.nn.Linear(in_features=ftwidth*ftheight*16, out_features=120)
        self.L2     = paddle.nn.Linear(in_features=120, out_features=86)
        self.L3     = paddle.nn.Linear(in_features=86, out_features=targetsize)

    def forward(self, x):
        x = self.conv1(x)
        x = paddle.nn.functional.relu(x)
        x = self.mp1(x)
        x = self.conv2(x)
        x = paddle.nn.functional.relu(x)
        x = self.mp2(x)
        x = paddle.flatten(x, start_axis=1, stop_axis=-1)
        x = self.L1(x)
        x = paddle.nn.functional.relu(x)
#        x = paddle.fluid.layers.dropout(x, 0.2)
        x = self.L2(x)
        x = paddle.nn.functional.relu(x)
        x = self.L3(x)
        return x

model = lenet()
model.set_state_dict(paddle.load('/home/aistudio/work/seg7model4_1_all.pdparams'))


#------------------------------------------------------------
OUT_SIZE            = 48
def scanimg1d(imgfile, scanStep):
    img = cv2.imread(imgfile)
    gray = cv2.cvtColor(img, cv2.COLOR_BGR2GRAY)

    imgwidth = gray.shape[1]
    imgheight = gray.shape[0]


    imgarray = []
    blockwidth = int(imgheight * .5)
    startid = linspace(0, imgwidth-blockwidth, scanStep)
    for s in startid:
        left = int(s)
        right = int(s+blockwidth)

        data = gray[0:imgheight, left:right]
        dataout =cv2.resize(data, (OUT_SIZE, OUT_SIZE))
        dataout = dataout - mean(dataout)
        stdd = std(dataout)
        dataout = dataout/stdd

        imgarray.append(dataout[newaxis, :,:])

    model_input = paddle.to_tensor(imgarray, dtype='float32')
    preout = model(model_input)

    return preout

#------------------------------------------------------------
#picimage = '/home/aistudio/work/7seg/SegScan/004-01234567.BMP'
#picimage = '/home/aistudio/work/7seg/SegScan/027-426957.JPG'
picimage = '/home/aistudio/work/7seg/SegScan/062-260612.JPG'


out = scanimg1d(picimage, 200).numpy()

plt.figure(figsize=(12,20))
plotnum = 10
plotstart = 0

for i in range(plotnum):
    plt.subplot(plotnum,1,i+1)
    plt.plot(out[:,i+plotstart])
    plt.title('Preiod:%d'%(i+plotstart))
    plt.xlabel("Scan Step")
    plt.ylabel("Prediction")
    plt.grid(True)
    plt.tight_layout()


plt.savefig('/home/aistudio/stdout.jpg')
plt.show()


#------------------------------------------------------------
#        END OF FILE : TEST1.PY
#============================================================