problem
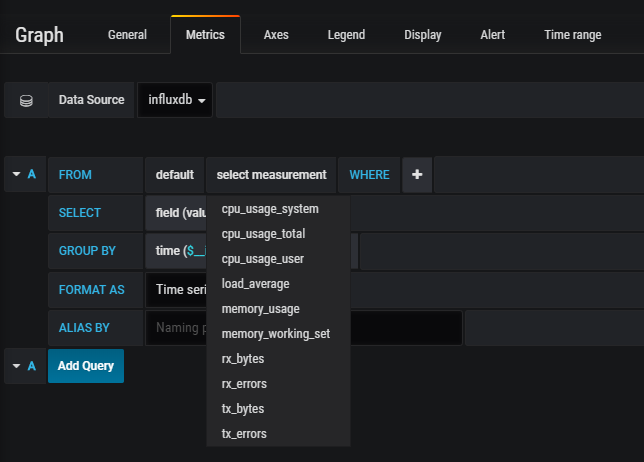
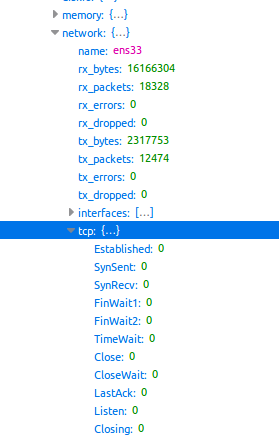
After setting up the monitoring cluster of ccadvisor influxdb grafana, it is found that there is no tcp related data
Source version:
https://github.com/google/cad...
git commit hash:9db8c7dee20a0c41627b208977ab192a0411bf93
Build a cfisor influxdb grafana reference
https://botleg.com/stories/mo...
Positioning process
Is there no tcp state recorded by cadviser?
It's easy to search, because of the high cpu usage of cadviser, it needs to -- Disable "metrics =" "
https://github.com/google/cad...
In fact, this is not the case
Start cadviser locally without any parameters
~/gopath/src/github.com/google/cadvisor(master*) » sudo ./cadvisor -logtostderr
Open in browser http://127.0.0.1 : 8080/containers / you can see the response with TcpState
Is the influxdb written?
- Open the implux DB shell
InfluxDB shell 0.9.6.1
> show databases
name: databases
---------------
name
_internal
mydb
cadvisor
> use cadvisor
Using database cadvisor
> show tag keys
name: cpu_usage_system
----------------------
tagKey
container_name
machine
As you can see, these tagkeys correspond to the select column in grafana
So, is cadviser not writing to influxdb?
cadvisor/storage/influxdb/influxdb.go:174
func (self *influxdbStorage) containerStatsToPoints(
    cInfo *info.ContainerInfo,
    stats *info.ContainerStats,
) (points []*influxdb.Point) {
    // CPU usage: Total usage in nanoseconds
    points = append(points, makePoint(serCpuUsageTotal, stats.Cpu.Usage.Total))

    // CPU usage: Time spend in system space (in nanoseconds)
    points = append(points, makePoint(serCpuUsageSystem, stats.Cpu.Usage.System))

    // CPU usage: Time spent in user space (in nanoseconds)
    points = append(points, makePoint(serCpuUsageUser, stats.Cpu.Usage.User))

    // CPU usage per CPU
    for i := 0; i < len(stats.Cpu.Usage.PerCpu); i++ {
        point := makePoint(serCpuUsagePerCpu, stats.Cpu.Usage.PerCpu[i])
        tags := map[string]string{"instance": fmt.Sprintf("%v", i)}
        addTagsToPoint(point, tags)

        points = append(points, point)
    }

    // Load Average
    points = append(points, makePoint(serLoadAverage, stats.Cpu.LoadAverage))

    // Memory Usage
    points = append(points, makePoint(serMemoryUsage, stats.Memory.Usage))

    // Working Set Size
    points = append(points, makePoint(serMemoryWorkingSet, stats.Memory.WorkingSet))

    // Network Stats
    points = append(points, makePoint(serRxBytes, stats.Network.RxBytes))
    points = append(points, makePoint(serRxErrors, stats.Network.RxErrors))
    points = append(points, makePoint(serTxBytes, stats.Network.TxBytes))
    points = append(points, makePoint(serTxErrors, stats.Network.TxErrors))

    self.tagPoints(cInfo, stats, points)

    return points
}
conclusion
You need to modify cadviser code and add the metrics you need