What happened to the MP Android chart radar map
Introduction to mpadroidchart - use of radar chart. Detailed tutorial on the use of custom radar a x is labels and basic colors. MPAndroidChart_ About the line chart MPAndroidChart_ The pie chart thing MPAndroidChart_ Dynamic histogram MPAndroidChart_ About the horizontal bar chart MPAndroidChart_ Parallel bar chart, and how to click to hide unwanted items.
In recent use, RadarChart is used, that is, radar map or spider map. There are not many online introductions to RadarChart, so here is a more detailed introduction. Today I will bring you some usage methods and the operation of customizing vertex color by rewriting the source code. If you read my previous posts, you should get started soon. Well, no more nonsense. Let's start.
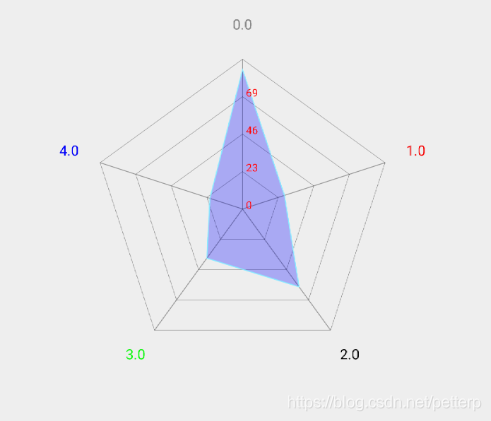
Let's take a look at the general effect first.

Do you think it's good? Let's take a look at the specific code.
Let's start with the layout. There's nothing to say
<?xml version="1.0" encoding="utf-8"?>
<LinearLayout xmlns:android="http://schemas.android.com/apk/res/android"
    xmlns:app="http://schemas.android.com/apk/res-auto"
    xmlns:tools="http://schemas.android.com/tools"
    android:layout_width="match_parent"
    android:layout_height="match_parent"
    tools:context=".MainActivity">
    <com.github.mikephil.charting.charts.RadarChart
        android:id="@+id/chart"
        android:layout_width="match_parent"
        android:layout_height="match_parent" />
</LinearLayout>
Then look at the code
/**
 * @author Petterp on 2019/5/11
 * Summary:RoadarChart Use of radar chart
 * Email: 1509492795@qq.com
 */
public class MainActivity extends AppCompatActivity {
    private RadarChart chart;
    private int[] colors = {Color.RED, Color.BLACK, Color.GREEN, Color.BLUE, Color.GRAY};

    @Override
    protected void onCreate(Bundle savedInstanceState) {
        super.onCreate(savedInstanceState);
        setContentView(R.layout.activity_main);
        initChart();
        setData();
    }

    /**
     * Settings on some axes, etc
     */
    private void initChart() {
        chart = findViewById(R.id.chart);
        //Set the color of the web line (that is, the color wrapped outside)
        chart.setWebColorInner(Color.BLACK);
        //Set the centerline color (i.e. vertical lines)
        chart.setWebColor(Color.BLACK);
        chart.setWebAlpha(50);

        XAxis xAxis = chart.getXAxis();
        //Sets the font color of the x-axis label
        xAxis.setLabelCount(4, true);
        xAxis.setAxisMaximum(4f);
        xAxis.setAxisMinimum(0f);
        xAxis.setTextSize(20f);

        //Custom y-axis label, the same as x-axis
        xAxis.setValueFormatter(new ValueFormatter() {
            @Override
            public String getFormattedValue(float value) {
        //Here is only the custom label color. If you want to use the custom label color, please change the layout file to customize it as the RoadarCharts class
                chart.getXAxis().setTextColor(colors[(int) Math.abs(value % 5)]);
                return super.getFormattedValue(value);
            }
        });

        YAxis yAxis = chart.getYAxis();
        //Sets the number of labels for the y-axis
        yAxis.setLabelCount(5, true);
        //Set y-axis from 0f
        yAxis.setAxisMinimum(0f);
        /*Enable the drawing of Y-axis vertex labels, which is a newly added function
         * */
        yAxis.setDrawTopYLabelEntry(false);
        //Set font size
        yAxis.setTextSize(15f);
        //Set font color
        yAxis.setTextColor(Color.RED);

        //Enable lines, if disabled, there are no lines
        chart.setDrawWeb(true);

        //Disable legend and chart description
        chart.getDescription().setEnabled(false);
        chart.getLegend().setEnabled(false);
    }

    /**
     * Set data
     */
    private void setData() {
        List<RadarEntry> list = new ArrayList<>();
        for (int i = 0; i < 5; i++) {
            list.add(new RadarEntry((float) (Math.random() * 100)));
        }
        RadarDataSet set = new RadarDataSet(list, "Petterp");

        //Disable labels
        set.setDrawValues(false);
        //Set fill color
        set.setFillColor(Color.BLUE);
        //Set fill transparency
        set.setFillAlpha(40);
        //Set enable fill
        set.setDrawFilled(true);
        //Set whether the label displays the circular periphery after clicking
        set.setDrawHighlightCircleEnabled(true);
        //Set the color of the periphery of the label circle after clicking
        set.setHighlightCircleFillColor(Color.RED);
        //Set the transparency of the periphery of the label circle after clicking
        set.setHighlightCircleStrokeAlpha(40);
        //Set the radius of the periphery of the label circle after clicking
        set.setHighlightCircleInnerRadius(20f);
        //Set the radius of the inner circle around the label circle after clicking
        set.setHighlightCircleOuterRadius(10f);


        RadarData data = new RadarData(set);
        chart.setData(data);
        chart.invalidate();
    }

}
The corresponding notes are also above, very detailed.
Here we will focus on the user-defined label part.
Override the two classes RadarChart and XAxisRendererRadarChart. In fact, it means changing a method. Don't think it's too difficult.
Let's first see why we need to rewrite the source code.
RadarChart source code does not provide a method of multi-color labels. Click setTextColor() to find out.

Let's look for getTextColor (), that is to see where the color is used.
I found that there are many methods. We only look at what we need. For example, now we want to define the x-axis label, that is, the outermost label, so we choose XAxisRendererRadarChart,
After entering, I found that the value of color was obtained here, and then I looked down

This method is where we draw the label. Then we began to operate.
/**
 * @author Petterp on 2019/5/11
 * Summary:Override XAxisRendererRadarChart
 * Email: 1509492795@qq.com
 */
public class XAxisRendererRandarChart extends XAxisRendererRadarChart {
    private RadarChart mChart;
    public XAxisRendererRandarChart(ViewPortHandler viewPortHandler, XAxis xAxis, RadarChart chart) {
        super(viewPortHandler, xAxis, chart);
        mChart=chart;
    }
    @Override
    public void renderAxisLabels(Canvas c) {

        if (!mXAxis.isEnabled() || !mXAxis.isDrawLabelsEnabled())
            return;

        final float labelRotationAngleDegrees = mXAxis.getLabelRotationAngle();
        final MPPointF drawLabelAnchor = MPPointF.getInstance(0.5f, 0.25f);

        mAxisLabelPaint.setTypeface(mXAxis.getTypeface());
        mAxisLabelPaint.setTextSize(mXAxis.getTextSize());
//        Move this sentence below
//        mAxisLabelPaint.setColor(mXAxis.getTextColor());


        float sliceangle = mChart.getSliceAngle();

        // calculate the factor that is needed for transforming the value to
        // pixels
        float factor = mChart.getFactor();

        MPPointF center = mChart.getCenterOffsets();
        MPPointF pOut = MPPointF.getInstance(0,0);
        for (int i = 0; i < mChart.getData().getMaxEntryCountSet().getEntryCount(); i++) {

            //Here are the changes
            mAxisLabelPaint.setColor(mXAxis.getTextColor());
            String label = mXAxis.getValueFormatter().getAxisLabel(i, mXAxis);

            float angle = (sliceangle * i + mChart.getRotationAngle()) % 360f;

            Utils.getPosition(center, mChart.getYRange() * factor
                    + mXAxis.mLabelRotatedWidth / 2f, angle, pOut);

            drawLabel(c, label, pOut.x, pOut.y - mXAxis.mLabelRotatedHeight / 2.f,
                    drawLabelAnchor, labelRotationAngleDegrees);
        }

        MPPointF.recycleInstance(center);
        MPPointF.recycleInstance(pOut);
        MPPointF.recycleInstance(drawLabelAnchor);
    }
}
But that's not enough. We still need to rewrite a class, RadarCharts. Otherwise, you still use the official class, which means you haven't changed it.
So keep watching.

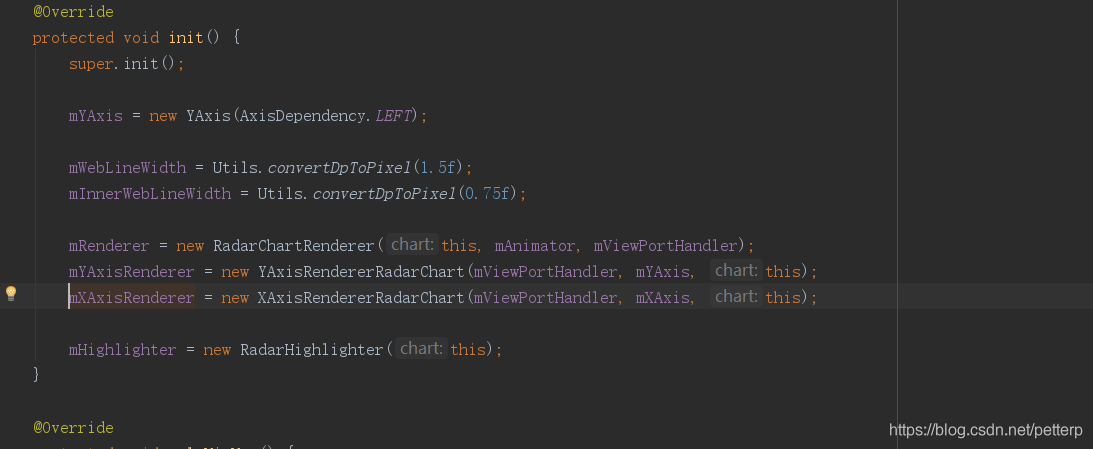
RodarCharts class. Are these two methods just one of the methods we re created just now. Then look down.

An instance of XAxisRendererRadarChart is created here. So what we need to change is very simple, that is to replace the class here with our class.
I won't post the code here. It's a little long. It doesn't matter.
Finally, make changes in the layout file to complete the custom x-axis label. Of course, we only did the simplest operations, isn't it very simple.
<com.petterp.radchart.RadarCharts
    android:id="@+id/chart"
    android:layout_width="match_parent"
    android:layout_height="match_parent" />
Well, the above is the basic use of MPAndroidChart radar chart. If you don't understand anything, you are welcome to ask questions at any time. Let's make progress together!!!
Finally, attach a link to github. The corresponding source code is also included. https://github.com/Petterpx/MPAndroidChart_RadarChartDemo