Today, I saw an alarm on spotlight that the disk IO is too high. Log in to the server to check the specific disk IO:
[root@hbwb-008 ~]# iostat -dxk 1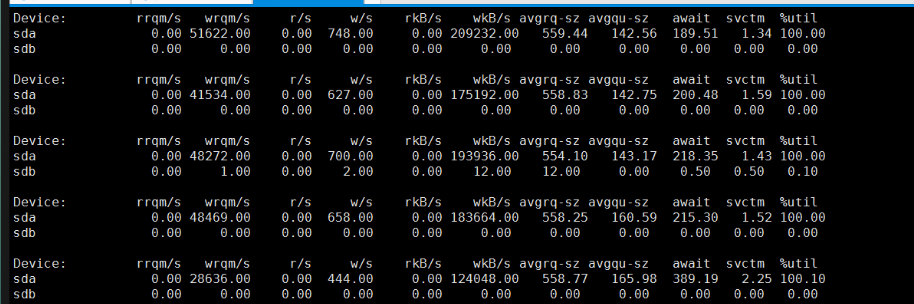
Disk write is close to 20M per second, util% usage is close to 100%. First of all, we suspect that the slow query statement is the cause. Look at the MYSQL slow query situation:
mysql> show processlist;
+-------+-------------+---------------------+------+---------+--------+-----------------------------------------------------------------------------+------------------+
| Id    | User        | Host                | db   | Command | Time   | State                                                                       | Info             |
+-------+-------------+---------------------+------+---------+--------+-----------------------------------------------------------------------------+------------------+
|     1 | system user |                     | NULL | Connect | 674754 | Waiting for master to send event                                            | NULL             |
|     2 | system user |                     | NULL | Connect |      0 | Slave has read all relay log; waiting for the slave I/O thread to update it | NULL             |
|  5504 | root        | 192.168.5.161:38765 | wbdb | Sleep   |      1 |                                                                             | NULL             |
|  5746 | root        | 192.168.5.161:40800 | wbdb | Sleep   |      1 |                                                                             | NULL             |
|  5891 | root        | 192.168.5.161:41970 | wbdb | Sleep   |      1 |                                                                             | NULL             |
|  7398 | root        | 192.168.5.161:46172 | wbdb | Sleep   |      1 |
No obvious slow query statements were found. Continuing to analyze, my server is 64G memory. Looking at it with the system command free, I found that most of them are cached, and not many of them are free. Look at InnoDB's configuration and status to see if you can find a clue:
mysql> show variables like '%innodb_buffer_pool_size%';
+-------------------------------------+----------------+
| Variable_name                       | Value          |
+-------------------------------------+----------------+     |
| innodb_buffer_pool_size             | 48169484288    |
+-------------------------------------+----------------+
1 row in set (0.00 sec)

mysql> show global status like '%innodb_log%';
+---------------------------+----------+
| Variable_name             | Value    |
+---------------------------+----------+
| Innodb_log_waits          | 0        |
| Innodb_log_write_requests | 68744008 |
| Innodb_log_writes         | 72154542 |
+---------------------------+----------+
3 rows in set (0.00 sec)

mysql> show global status like '%innodb_buffer_pool_wait%';
+------------------------------+-------+
| Variable_name                | Value |
+------------------------------+-------+
| Innodb_buffer_pool_wait_free | 0     |
+------------------------------+-------+
1 row in set (0.00 sec)
No log-related waiting time was found. Looking at the report of show engine innodb status, no abnormality was found. top saw that the system load was not high, only the disk IO was high, and the memory allocation of mysql was not abnormal. I tried to recall the parameters of mysql related to disk IO, and remembered that there were two parameters innodb_flush_l. Og_at_trx_commit and sync_binlog, look at the values of these two parameters:
mysql> show variables like '%sync_bin%';
+--------------+-------+
| Variable_name | Value |
+---------------+-------+
| sync_binlog   | 1   |
+---------------+-------+
1 row in set (0.00 sec)

mysql> show variables like '%innodb_flush%';
+--------------------------------+----------+
| Variable_name                  | Value    |
+--------------------------------+----------+
| innodb_flush_log_at_timeout    | 1        |
| innodb_flush_log_at_trx_commit | 2        |
| innodb_flush_method            | O_DIRECT |
| innodb_flush_neighbors         | 1        |
| innodb_flushing_avg_loops      | 30       |
+--------------------------------+----------+
5 rows in set (0.00 sec)
As you know, sync_binlog=1 means that MySQL will make a disk synchronization instruction like fsync once after each transaction submission to force data in binlog_cache to be written to disk. Frequent disk writing leads to high disk IO and adjusts sync_binlog to 500.
mysql> set global sync_binlog=500;
Query OK, 0 rows affected (0.00 sec)

mysql> show variables like 'sync_binlog';
+---------------+-------+
| Variable_name | Value |
+---------------+-------+
| sync_binlog   | 500   |
+---------------+-------+
1 row in set (0.00 sec)
Observe disk IO usage again:
[root@hbwb-008 ~]# iostat -dxk 1
Linux 2.6.32-431.el6.x86_64 (hbwb-008)  03/29/2017  _x86_64_    (32 CPU)

Device:         rrqm/s   wrqm/s     r/s     w/s    rkB/s    wkB/s avgrq-sz avgqu-sz   await  svctm  %util
sda               0.01    38.92    0.42   35.17     6.43   300.15    17.23     0.06    1.63   4.36  15.52
sdb               0.00    51.45    0.33   33.19    26.97   338.58    21.81     0.01    0.27   0.07   0.23

Device:         rrqm/s   wrqm/s     r/s     w/s    rkB/s    wkB/s avgrq-sz avgqu-sz   await  svctm  %util
sda               0.00    28.00    0.00   13.00     0.00   188.00    28.92     0.08    6.15   6.15   8.00
sdb               0.00     0.00    0.00    0.00     0.00     0.00     0.00     0.00    0.00   0.00   0.00

Device:         rrqm/s   wrqm/s     r/s     w/s    rkB/s    wkB/s avgrq-sz avgqu-sz   await  svctm  %util
sda               0.00    19.00    0.00    7.00     0.00   104.00    29.71     0.04    5.00   4.43   3.10
sdb               0.00     0.00    0.00    0.00     0.00     0.00     0.00     0.00    0.00   0.00   0.00

Device:         rrqm/s   wrqm/s     r/s     w/s    rkB/s    wkB/s avgrq-sz avgqu-sz   await  svctm  %util
sda               0.00    25.00    0.00    3.00     0.00   112.00    74.67     0.01    5.00   5.00   1.50
sdb               0.00     1.00    0.00    2.00     0.00    12.00    12.00     0.00    0.00   0.00   0.00
You can see that the disk IO is significantly reduced and the alarm is cancelled.
sync_binlog parameter:
The default value of sync_binlog is 0. Like the mechanism for operating system to refresh other files, MySQL does not synchronize to disk, but relies on operating system to refresh binary log.
When sync_binlog = N (N > 0), MySQL uses the fdatasync() function to synchronize its binary log to disk every time it writes the binary log N times.