catalogue
Concept starting: what is ECharts?
Visual experience: what does ECharts look like?
Hands on operation: the perfect realization of ECharts trilogy!
Step 1: finding is making money
Step 2: structure construction
Step 3: copy and paste what I'm good at
preface
Why do you say this: ECharts is the front-end "necessity" in the era of big data?
There is no doubt that this is the truth. In today's big data era, people's most intuitive feeling is definitely from charts. And what are ECharts? English translation is the picture. But let's have a look at the specific time!

Concept starting: what is ECharts?
- Echarts, a pure Javascript chart library, can run smoothly on PC s and mobile devices, and is compatible with most current browsers (IE8/9/10/11), Chrome, Firefox, Safari, etc.
- The underlying layer relies on lightweight Canva + libraries ZRender provides intuitive, vivid, interactive and highly personalized data visualization charts.
- ECharts 3 and above have added more rich interactive functions and more visual effects, and have made in-depth optimization for the mobile terminal.
So what is ECharts? ECharts is a JavaScript chart library that can realize data visualization.
So what does ECharts do? Make the data more intuitive.
Visual experience: what does ECharts look like?
This is a simple ecarts page I wrote. As a novice, I personally think it is not difficult to use ecarts. More is fine-tuning and copy and paste. With a simple js board, you can make a simple and good-looking page.

Hands on operation: the perfect realization of ECharts trilogy!
Step 1: finding is making money
- Open the official website: Apache ECharts , click the example.

- Find a chart you need (the style is basically the same). The following figure is my selection example.

Step 2: structure construction
- Two files need to be imported, as shown in the following figure:
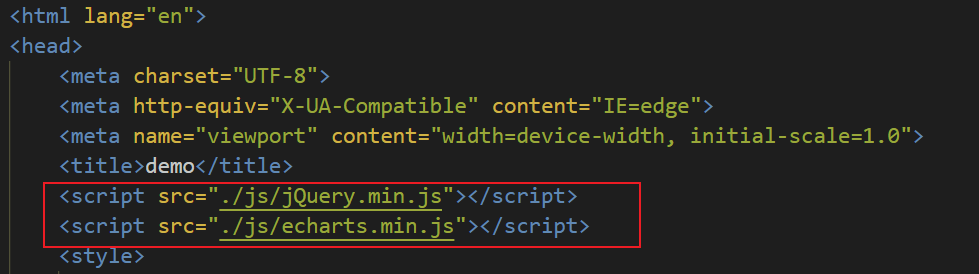
If there are no these two files, baidu online disk link: Baidu network disk, please enter the extraction code Extraction code: mxwp
- Create a box of appropriate size, and customize the actual size according to the situation.
<body>
    <div class="box" style="width: 500px; height: 500px;">
         I am a 500 px Square box
    </div>
</body>
Step 3: copy and paste what I'm good at
-
Instantiate object: get a DOM element. The second step is box;
-
Specify configuration items and data: This is copy and paste. Modify it slightly according to your own needs. Directly, select all + copy;

-
Configuration items and data to our instantiated objects: let the chart display
JavaScript code
        (function () {

            // 1. Instantiate object
            var myChart = echarts.init(document.querySelector(".box"));
            // 2. Specify configuration item and data copy and paste
            var option = {
                color: ['#80FFA5', '#00DDFF', '#37A2FF', '#FF0087', '#FFBF00'],
                title: {
                    text: 'Gradient Stacked Area Chart'
                },
                tooltip: {
                    trigger: 'axis',
                    axisPointer: {
                        type: 'cross',
                        label: {
                            backgroundColor: '#6a7985'
                        }
                    }
                },
                legend: {
                    data: ['Line 1', 'Line 2', 'Line 3', 'Line 4', 'Line 5']
                },
                toolbox: {
                    feature: {
                        saveAsImage: {}
                    }
                },
                grid: {
                    left: '3%',
                    right: '4%',
                    bottom: '3%',
                    containLabel: true
                },
                xAxis: [
                    {
                        type: 'category',
                        boundaryGap: false,
                        data: ['Mon', 'Tue', 'Wed', 'Thu', 'Fri', 'Sat', 'Sun']
                    }
                ],
                yAxis: [
                    {
                        type: 'value'
                    }
                ],
                series: [
                    {
                        name: 'Line 1',
                        type: 'line',
                        stack: 'Total',
                        smooth: true,
                        lineStyle: {
                            width: 0
                        },
                        showSymbol: false,
                        areaStyle: {
                            opacity: 0.8,
                            color: new echarts.graphic.LinearGradient(0, 0, 0, 1, [
                                {
                                    offset: 0,
                                    color: 'rgba(128, 255, 165)'
                                },
                                {
                                    offset: 1,
                                    color: 'rgba(1, 191, 236)'
                                }
                            ])
                        },
                        emphasis: {
                            focus: 'series'
                        },
                        data: [140, 232, 101, 264, 90, 340, 250]
                    },
                    {
                        name: 'Line 2',
                        type: 'line',
                        stack: 'Total',
                        smooth: true,
                        lineStyle: {
                            width: 0
                        },
                        showSymbol: false,
                        areaStyle: {
                            opacity: 0.8,
                            color: new echarts.graphic.LinearGradient(0, 0, 0, 1, [
                                {
                                    offset: 0,
                                    color: 'rgba(0, 221, 255)'
                                },
                                {
                                    offset: 1,
                                    color: 'rgba(77, 119, 255)'
                                }
                            ])
                        },
                        emphasis: {
                            focus: 'series'
                        },
                        data: [120, 282, 111, 234, 220, 340, 310]
                    },
                    {
                        name: 'Line 3',
                        type: 'line',
                        stack: 'Total',
                        smooth: true,
                        lineStyle: {
                            width: 0
                        },
                        showSymbol: false,
                        areaStyle: {
                            opacity: 0.8,
                            color: new echarts.graphic.LinearGradient(0, 0, 0, 1, [
                                {
                                    offset: 0,
                                    color: 'rgba(55, 162, 255)'
                                },
                                {
                                    offset: 1,
                                    color: 'rgba(116, 21, 219)'
                                }
                            ])
                        },
                        emphasis: {
                            focus: 'series'
                        },
                        data: [320, 132, 201, 334, 190, 130, 220]
                    },
                    {
                        name: 'Line 4',
                        type: 'line',
                        stack: 'Total',
                        smooth: true,
                        lineStyle: {
                            width: 0
                        },
                        showSymbol: false,
                        areaStyle: {
                            opacity: 0.8,
                            color: new echarts.graphic.LinearGradient(0, 0, 0, 1, [
                                {
                                    offset: 0,
                                    color: 'rgba(255, 0, 135)'
                                },
                                {
                                    offset: 1,
                                    color: 'rgba(135, 0, 157)'
                                }
                            ])
                        },
                        emphasis: {
                            focus: 'series'
                        },
                        data: [220, 402, 231, 134, 190, 230, 120]
                    },
                    {
                        name: 'Line 5',
                        type: 'line',
                        stack: 'Total',
                        smooth: true,
                        lineStyle: {
                            width: 0
                        },
                        showSymbol: false,
                        label: {
                            show: true,
                            position: 'top'
                        },
                        areaStyle: {
                            opacity: 0.8,
                            color: new echarts.graphic.LinearGradient(0, 0, 0, 1, [
                                {
                                    offset: 0,
                                    color: 'rgba(255, 191, 0)'
                                },
                                {
                                    offset: 1,
                                    color: 'rgba(224, 62, 76)'
                                }
                            ])
                        },
                        emphasis: {
                            focus: 'series'
                        },
                        data: [220, 302, 181, 234, 210, 290, 150]
                    }
                ]
            };
            // 3. Configuration items and data to our instantiated objects
            myChart.setOption(option);


        })()
summary
It's easy to display ECharts on your own page, but you need to explore it yourself to achieve a certain effect. But when you don't know how to set an attribute, you can baidu, which will be more efficient than your own exploration. Learn is earn!