This article gives a brief introduction to kieker tool.
kieker introduction
Kieker provides dynamic analysis function, that is, monitoring and analyzing the runtime behavior of software system, so as to realize application performance monitoring and architecture display. Because it is designed for continuous operation, it only costs low overhead. The tool is jointly maintained by the software engineering group of Kiel University in Germany and the University of Hamburg in Germany. It means "lookout" in German.
Official website: https://kieker-monitoring.net/
github: https://github.com/kieker-monitoring/kieker
Document address: https://kieker-monitoring.net/documentation/ (before version 1.15, pdf user documents were provided, but from version 1.15, the documents were changed to web version.)
Latest version: 1.15 (released on November 8, 2021).
At present, the tool is mainly used in the academic field.
You can search the following two papers for an introduction to kieker,
- Wilhelm Hasselbring and André van Hoorn (2020) "Kieker: A monitoring framework for software engineering research". Software Impacts, 5. https://doi.org/10.1016/j.simpa.2020.100019
- André van Hoorn, Jan Waller, and Wilhelm Hasselbring (2012) "Kieker: A Framework for Application Performance Monitoring and Dynamic Software Analysis". In: 3rd joint ACM/SPEC International Conference on Performance Engineering (ICPE 2012), April 22-25, 2012, Boston, Massachusetts, USA. https://doi.org/10.1145/2188286.2188326
My understanding of kieker is that it can monitor java applications (of course, the official also provides probes in other languages), obtain the method call relationship when the java program is running, and save it as a log.
kieker function
Application performance monitoring (APM) focuses on continuously observing the performance specific runtime behavior of software systems, including assessing service level compliance or detecting and monitoring Diagnose performance problems, etc.
Kieker provides APM support for collecting and analyzing monitoring data, especially for Java EE systems.
Kieker is equipped with detectors for collecting the following APM information:
| arrangement | information |
|---|---|
| Application layer and service layer | Operation response time, user session, trace, etc |
| System layer | CPU utilization, memory occupation, etc |
Although the introduction given on the official website says that it can detect CPU utilization and memory occupation information, I have not tried these functions, because I use this tool to obtain the call of internal methods during dynamic operation of the system.
kieker architecture
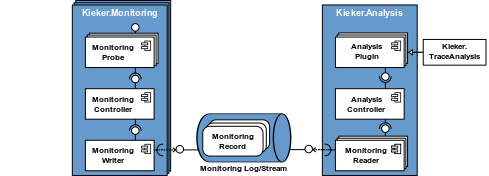
kieker is based on two main components, KiekerMonitoring and KiekerAnalysis.
- The KiekerMonitoring component is responsible for program detection, data collection and logging. Its core is the monitoring controller.
- The KiekerAnalysis component is responsible for reading, analyzing and visualizing monitoring data. Its core is the analysis controller, which manages the life cycle of the pipeline and filter architecture of the analysis plug-in, including monitoring readers and analysis filters.
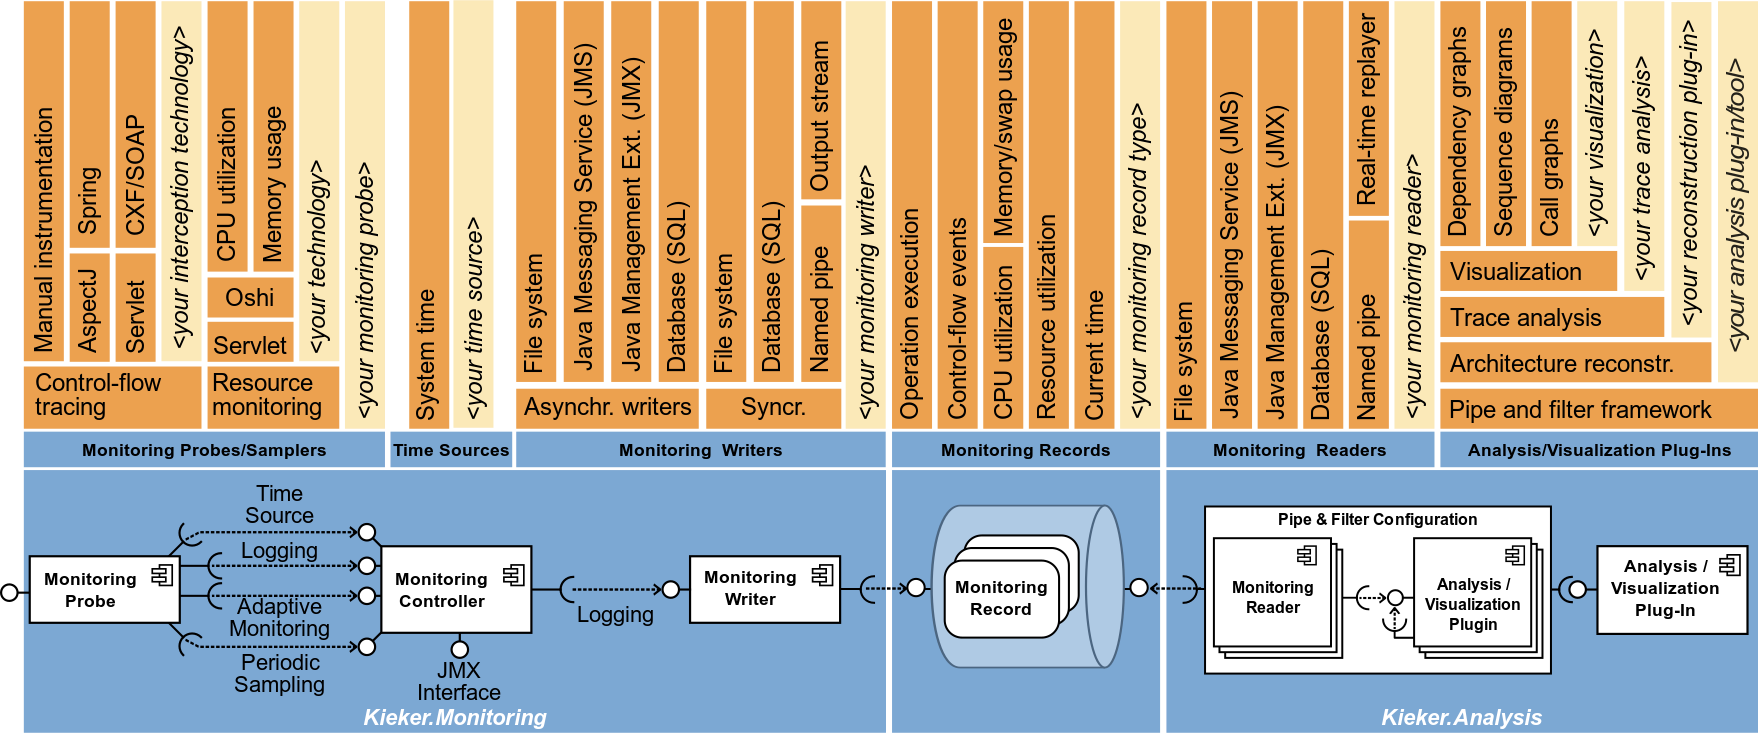
The above figure describes the possible extension points of custom components (light yellow part) and components already included in Kieker distribution (dark yellow part). The details are as follows:
- Monitoring writers and corresponding readers for monitoring file systems and SQL databases, in memory record streams (named pipes), and writers and readers using java management extension (JMX) and Java messaging service (JMS) technology.
- Time sources uses Java's system Nanotime() (default) or system Current / timemillis() method.
- Monitoring record types allow you to store monitoring data about operation execution (including timing, control flow and session information), CPU and resource utilization, memory / exchange utilization, and record types that can be used to store the current time.
- Monitoring probes: a feature of Kieker is that it can monitor the tracking of method execution and the corresponding time information. To monitor this data, Kieker includes monitoring probes using AspectJ, Java EE, Servlet, Spring, and Apache CXF technologies. In addition, Kieker also includes (regular) system level resource monitoring probes using OSHi.
- Analysis/Visualization plugins can be assembled into pipeline and filter architectures according to input and output ports. The KiekerTraceAnalysis tool itself is implemented based on Kieker analysis filter, which allows the reconstruction and visualization of the architecture model of the monitoring system, such as dependency diagram, sequence diagram and call tree.
kieker monitoring results
The following is a program I wrote for testing, using kieker to monitor the log results.
$0;1641821632522961100;1.15;KIEKER;LAPTOP-QRJSTFAO;1;false;0;NANOSECONDS;0
$1;1641821632542161700;public com.zy.demo.BookService.<init>();<no-session-id>;1154751091955466241;1641821632542016100;1641821632542024600;LAPTOP-QRJSTFAO;1;1
$1;1641821632554542300;public com.zy.demo.BookDao.<init>();<no-session-id>;1154751091955466241;1641821632554533300;1641821632554538900;LAPTOP-QRJSTFAO;3;2
$1;1641821633351693800;public com.zy.demo.Book.<init>();<no-session-id>;1154751091955466241;1641821633351682800;1641821633351690400;LAPTOP-QRJSTFAO;5;3
$1;1641821633351722100;public void com.zy.demo.Book.setBookID(int);<no-session-id>;1154751091955466241;1641821633351718200;1641821633351721000;LAPTOP-QRJSTFAO;6;3
$1;1641821633351877800;public void com.zy.demo.Book.setBookCount(int);<no-session-id>;1154751091955466241;1641821633351873400;1641821633351876500;LAPTOP-QRJSTFAO;7;3
$1;1641821633351906000;public void com.zy.demo.Book.setBookName(java.lang.String);<no-session-id>;1154751091955466241;1641821633351902700;1641821633351905100;LAPTOP-QRJSTFAO;8;3
$1;1641821633351928100;public void com.zy.demo.Book.setDetail(java.lang.String);<no-session-id>;1154751091955466241;1641821633351924700;1641821633351927100;LAPTOP-QRJSTFAO;9;3
$1;1641821633353095100;public com.zy.demo.Book com.zy.demo.BookDao.FindById(int);<no-session-id>;1154751091955466241;1641821632554570500;1641821633353092400;LAPTOP-QRJSTFAO;4;2
$1;1641821633353103100;public com.zy.demo.Book com.zy.demo.BookService.getInfoById(int);<no-session-id>;1154751091955466241;1641821632542842900;1641821633353102200;LAPTOP-QRJSTFAO;2;1
$1;1641821633353164500;public java.lang.String com.zy.demo.Book.toString();<no-session-id>;1154751091955466241;1641821633353138100;1641821633353163400;LAPTOP-QRJSTFAO;10;1
$1;1641821633353207600;public static void com.zy.demo.BookController.main(java.lang.String[]);<no-session-id>;1154751091955466241;1641821632527120100;1641821633353206400;LAPTOP-QRJSTFAO;0;0
Each of the above monitoring logs is interpreted as:
[type of monitoring record; log record timestamp (time unit: ns); operation signature (full qualifier); SessionID (web application only); traceid (unique ID of trace); start execution time; end execution time; computer name; execution sequence index; execution stack size]
Among them, TraceID, execution order index and execution stack size determine the call relationship of the method.
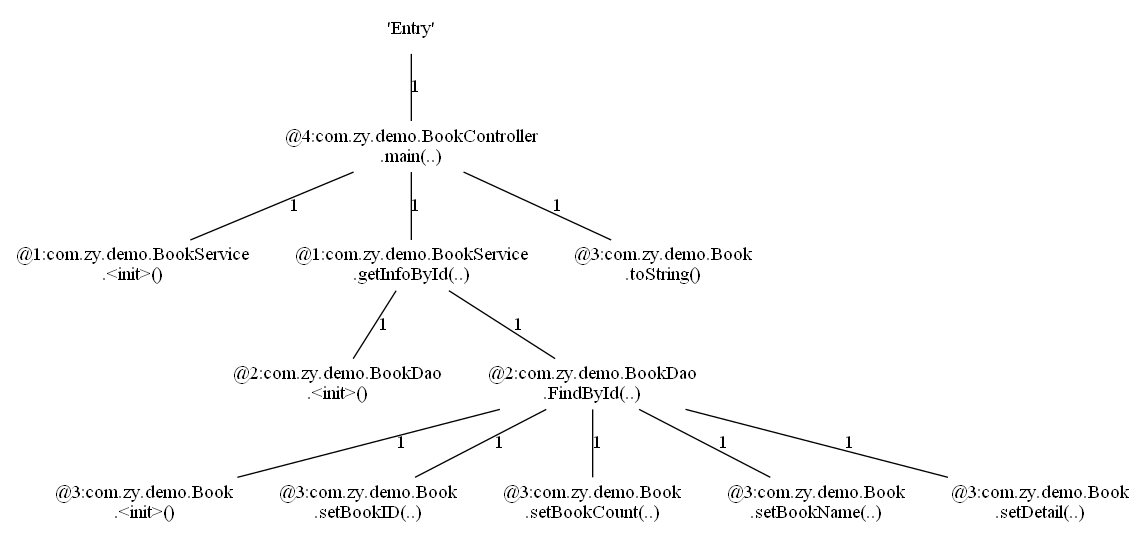
Graphical representation:
Use the trace analysis tool provided by kieker to graphically represent the above log results. Using this tool, you need to install Graphviz software in advance.
Note: I use the trace analysis GUI tool provided in kieker version 1.13, because I can't run kieker 1.13 locally The preliminary analysis of the trace analysis GUI tool provided in version 15 is due to the trace analysis GUI tool in version 1.15 The code in bat is too long.
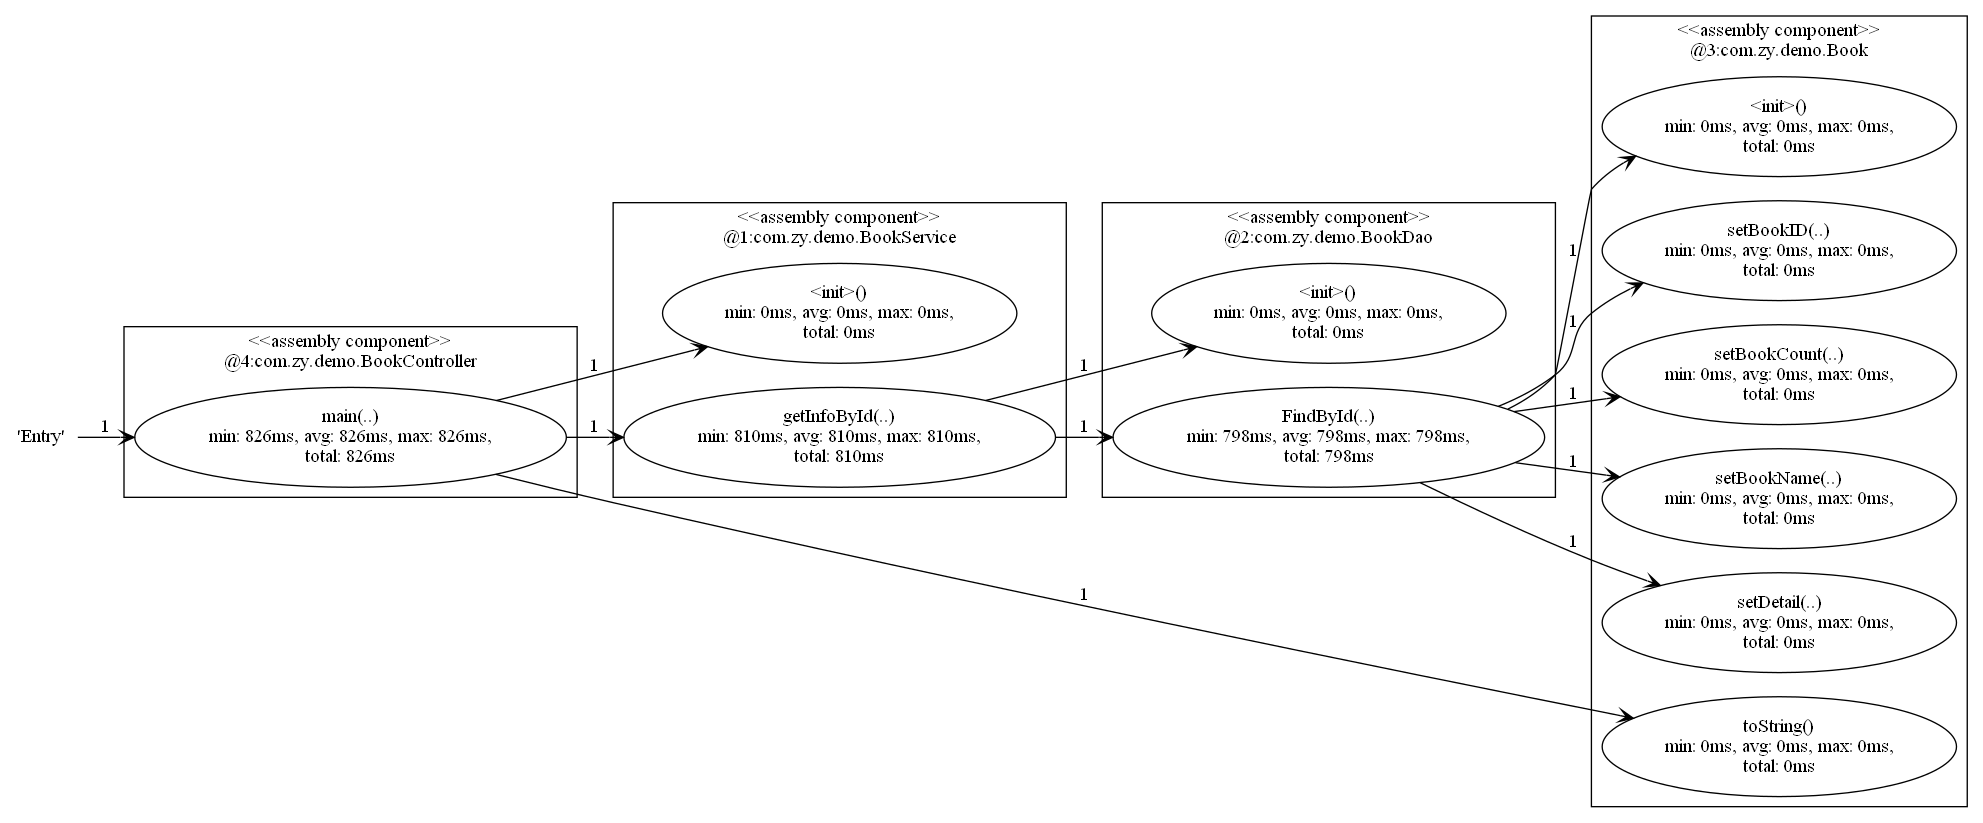
The figure is as follows, and the number next to the connecting line is expressed as the number of calls:
More detailed graphic information is as follows, which can also be obtained using trace analysis: