OOM memory
OOM: out of memory
For the memory related configuration of the JVM, there are corresponding recommendations on many open source JAVA components
eg:http://rocketmq.apache.org/docs/system-config/
1. There are not too many JVMs on the memory allocation line
>  jvm 70% of heap memory%Total machine memory (empirical value)
> same Xms and Xmx value---To improve the stability of the system, you don't have to let os to jvm Allocate memory
> -XX+AlwayPreTouch Distribution in place after start-up ---linux Pre allocation rather than actual allocation, when actually used
2. Memory usage
GC – > most of the work in the JVM is concentrated – > STW stop the word
Optimization direction:
How to reduce STW time
- Interview question: what GC adjustments has the JVM made - parallel to concurrent garbage collector
- In low latency applications, it is necessary to adjust the parameters of the garbage collector, which is generally called in the internal system. Otherwise, the impact of network latency is relatively large and the tuning is not obvious
- According to the actual test situation, when the code level cannot be optimized, the final retention means shall be adopted
How to reduce the number of GC
- Light jvm parameter configuration
- Recoding
-Escape analysis: analyze whether it can be accessed by other threads
-Online distribution mechanism: 1 Most of the objects are allocated to Eden area 2 Large objects directly enter the elderly generation
[XX:+PretenureSizeThreshold]
-Allocation on stack: objects are not allocated to the heap
-Scalar substitution:
Interview: focus on the mechanism of generational recycling - generational recycling
Allocation to the heap follows - TLAB (thread local allocation buffer) to prevent multiple threads from using the same memory location to put objects, so it is slower than on the stack
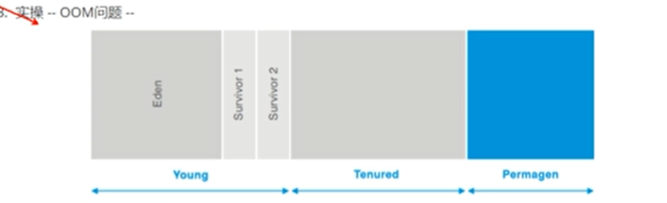
3. Practical operation – OOM problem
1.Most common java.lang.OutOfMemorryError: java heap spave
	-Memory leak: when you don't know, the memory resources are not released or are heavily occupied
2.  java.lang.OutOfMemorryError: GC overhead limit exceeded
- When GC It took 98% of the total running time of the program%More than and less than 2%If there is no heap memory, an exception is thrown
- -XX:-UserGCOverHeadLimit This function can be turned off (not recommended. If there is not enough memory, an exception will be thrown java heap spave)
3.java.lang.OutOfMemoryError: Metaspace
-Of confusing behavior--OOM After the exception is caught, repackage it
-Adjust to a larger method area [permanent generation]/Metadata space]
-Scenario: weblogic,tomcate Do not restart, release a new version and reinstall the package
3. java.lang.OutOfMemorryError:: unable to create new native thread
-The number of threads at the operating system level is limited, and there is not enough memory....
-Different operating systems have different performance

4. java.lang.OutOfMemorryError:  Requested arry size exceeds VM limit
	Array range size limit
6 java.lang.OutOfMemorryError:  Direct buffer memory .-XX:MaxDirectMemorySize
7.operating system lnux --ooM killer Mechanism (protection mechanism) man malloc
      linux Pre allocation rather than actual allocation, reallocation when actually used
      When it's not enough, let's go killer--Find a process and kill it[ linux Make a ranking to kill]
      The production environment may be encountered for no reason jvm Hang up--The operating system will have log keywords kill
      /var/log/messages
5. out of swap  space
    Insufficient physical memory and swap space
4. OOM – online problem solution
- Save the corresponding dump file for configuration parameters
- -Xmx8m -XX:+HeapDumpOnOutOfMemoryError -XX:HeapDumpPath=/temp/202006.hprof
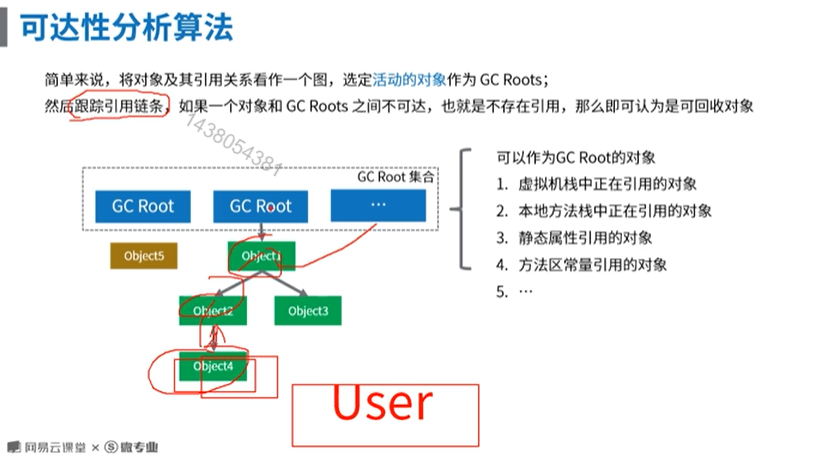
- Use the tool jhat or other tools (eg: mat memory analysises tool) to open the matching file and find that an arraylist object occupies 80% of the memory+
Then right-click to find the corresponding GC root
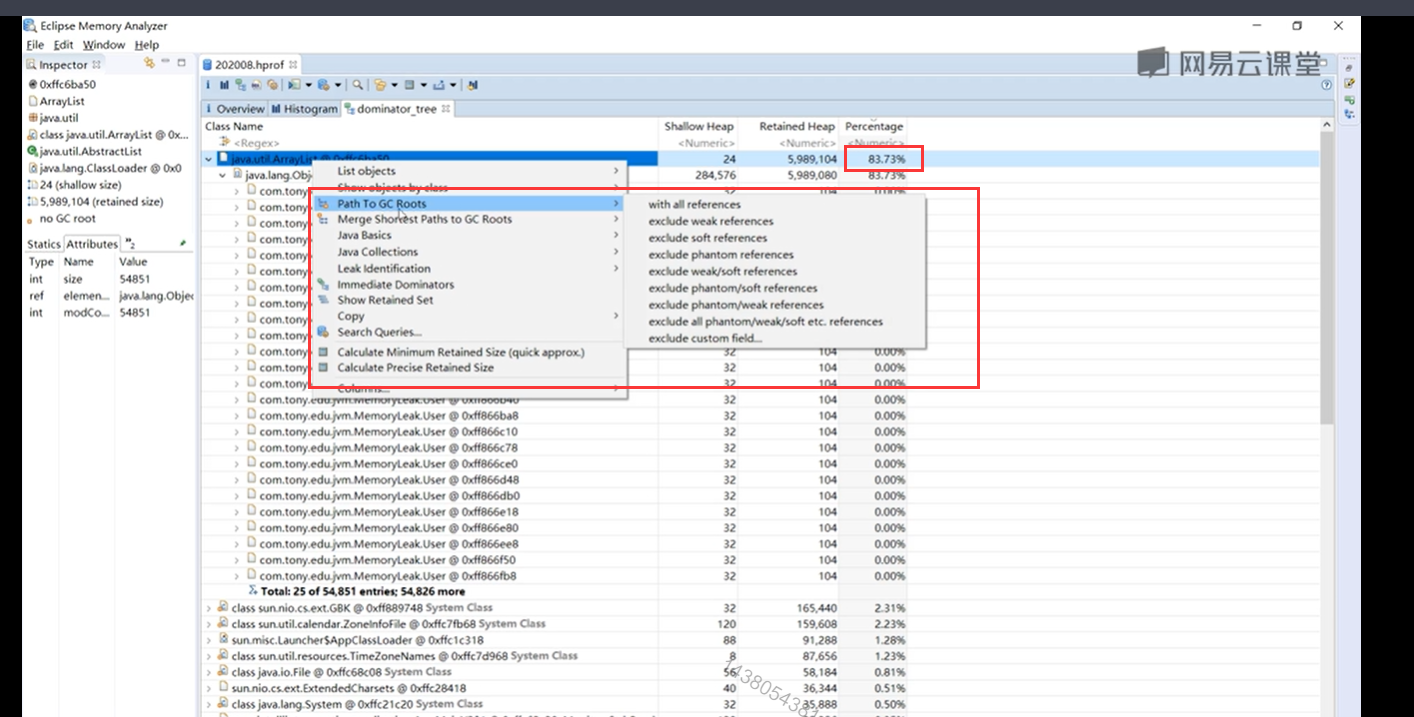
- You can see that GCroot is a thread object,
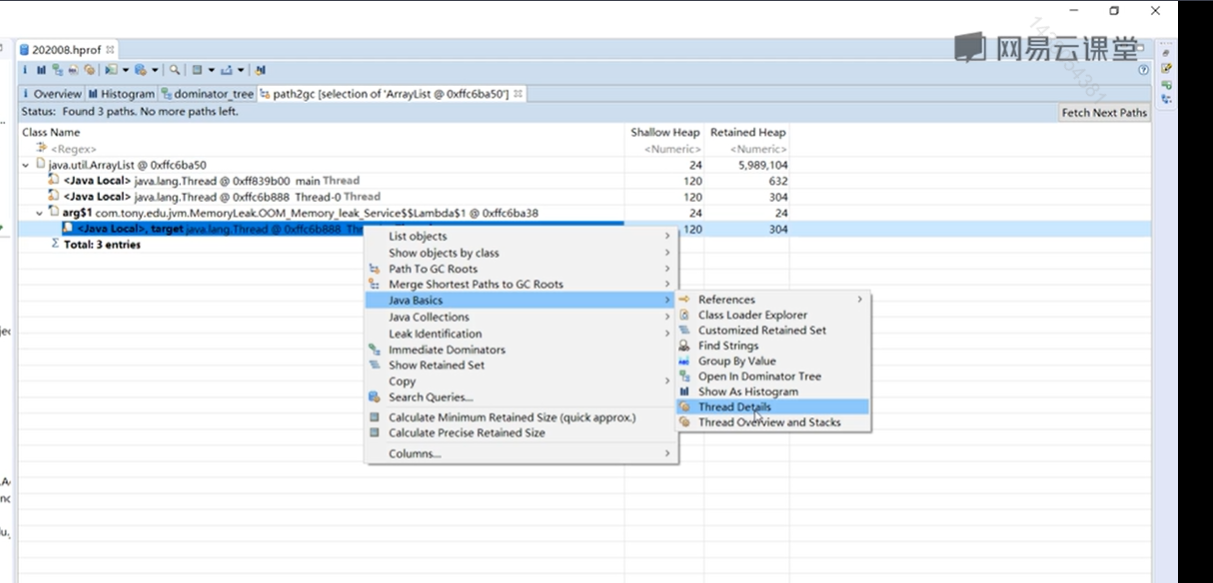
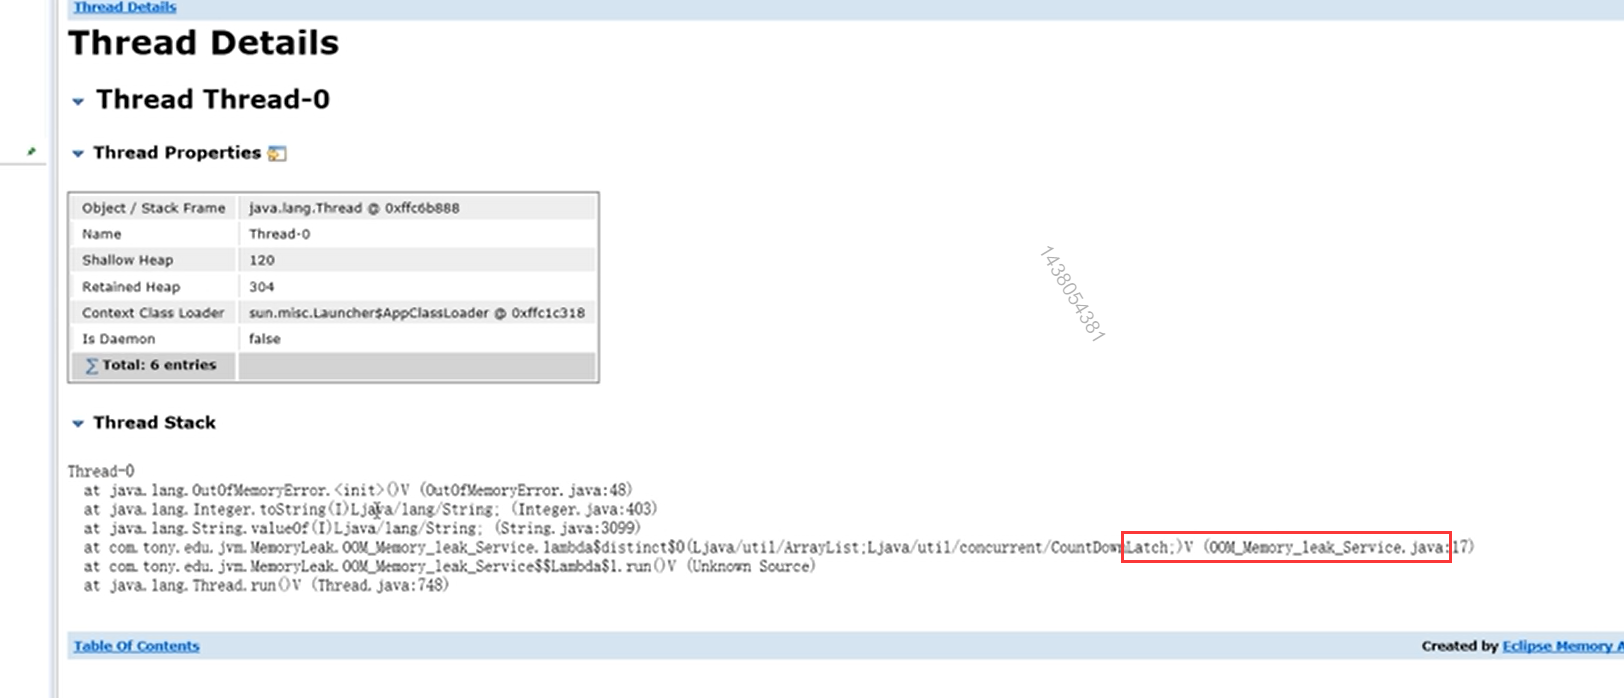
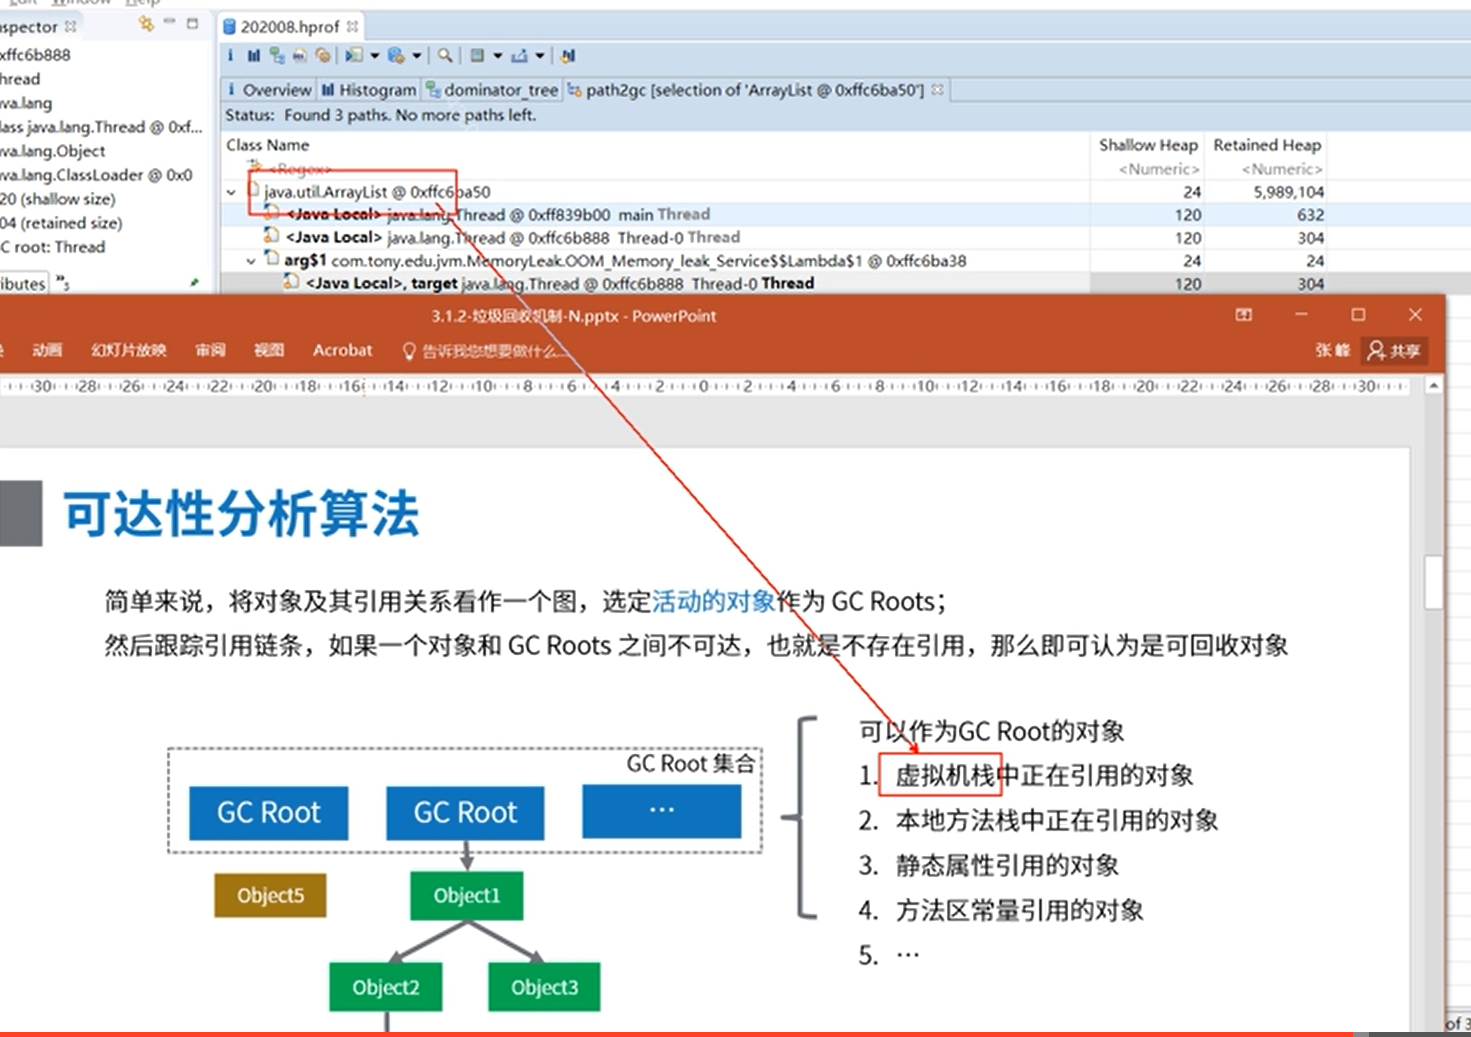 -Right click to view the thread detail to find the corresponding class.
Example code:
package com.tony.edu.jvm.MemoryLeak;

import java.util.ArrayList;
import java.util.concurrent.CountDownLatch;

// -Xmx8m -XX:+HeapDumpOnOutOfMemoryError -XX:HeapDumpPath=/temp/202006.hprof
public class OOM_Memory_leak_Service {

    // The number of system users is less than 10000, and the table data [log file] is 1 million. SQL de duplication occupies database resources, resulting in slow execution of other SQL
    // JAVA paging query is adopted for 100 times, and the information is de duplicated
    public ArrayList distinct() throws InterruptedException {
        ArrayList userList = new ArrayList(); // Estimated 1W pieces of data
        CountDownLatch countDownLatch = new CountDownLatch(1);
        new Thread(() -> {// New threads are created to execute specific code logic
            try {
                for (int j = 0; j < 100; j++) {
                    for (int i = 0; i < 10000; i++) {
                        // For each cycle, a new User object is created, but the ID range is within 1W
                        User user = new User(String.valueOf(i)); // TODO simulates querying an object from the database

                        // If there is no in the cache, it will be stored in the cache set
                        if (!userList.contains(user)) { // Theoretically: store no more than 1W user objects
                            userList.add(user);
                        }
                    }
                }
            } catch (Exception e) {
                e.printStackTrace();
            } finally {
                countDownLatch.countDown();
            }
        }).start();

        countDownLatch.await(); // Wait for the counter to return to 0
        return userList;
    }

    public static void main(String[] args) throws InterruptedException {
        new OOM_Memory_leak_Service().distinct();
    }
}
2. Locate suspicious code segments through memory snapshots
3. Don't doubt the memory leakage here. Analyze whether the memory allocation is reasonable in combination with the business scenario
4. Then analyze the logic error of the code to see if there is a bug (the reason bit contains here is the equals method)
5. Be alert to Full GC
- 1. The monitoring in the production environment should be improved... Memory usage is poor, GC, etc
package com.tony.edu.jvm.gc;

import jxl.Cell;
import jxl.Sheet;
import jxl.Workbook;
import jxl.WorkbookSettings;

import java.io.File;

// Run in server mode and start GC log
// -Xmx512m -server -verbose:gc -XX:+PrintGCDetails
// Many people would suggest avoiding the system fullgc risks brought by GC
// -20: + disableexplicitgc prohibits the program from calling gc methods (try not to do this, just test it before going online)
public class FullGCDemo {
    public static void main(String[] args) throws Exception {
        for (int i = 0; i < 1000; i++) {
            WorkbookSettings workbookSettings = new WorkbookSettings();
            workbookSettings.setGCDisabled(true);
            Workbook book = Workbook.getWorkbook(new File(FullGCDemo.class.getClassLoader().getResource("FullGCDemo2.xls").getFile()), workbookSettings);
            // Get first worksheet object
            Sheet sheet = book.getSheet(0);
            // Get the cells of the first column and the first row
            Cell cell1 = sheet.getCell(0, 0);
            String result = cell1.getContents();
            System.out.println(result);
            book.close(); // The third party depends on the package, and the system may be used internally gc()
            Thread.sleep(2000L);
        }
    }
}


// Test under TODO linux Environment
// Compilation: javac - CP / u01 / JVM study / excelfullgcdemo / jxl-2.6.12 jar:/u01/jvm-study/ExcelFullGCDemo FullGCDemo. java
// Run: Java - xmx512m - server - verbose: GC - XX: + printgcdetails - CP / u01 / JVM study / excelfullgcdemo / jxl-2.6.12 jar:/u01/jvm-study/ExcelFullGCDemo FullGCDemo
-
- System.gc trace
-
- brace tool - dynamic tracking tool provided by openjdk - understood as dynamic AOP
-Job: locate ByteBuffer through brace tracking Allocatedirect is where out of heap memory is called.
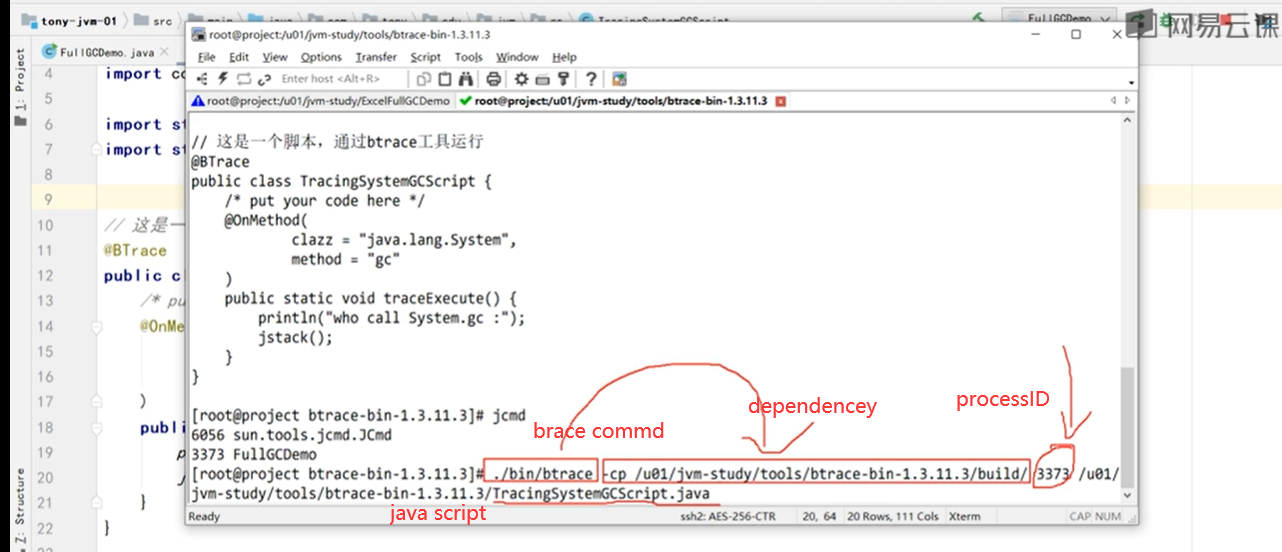
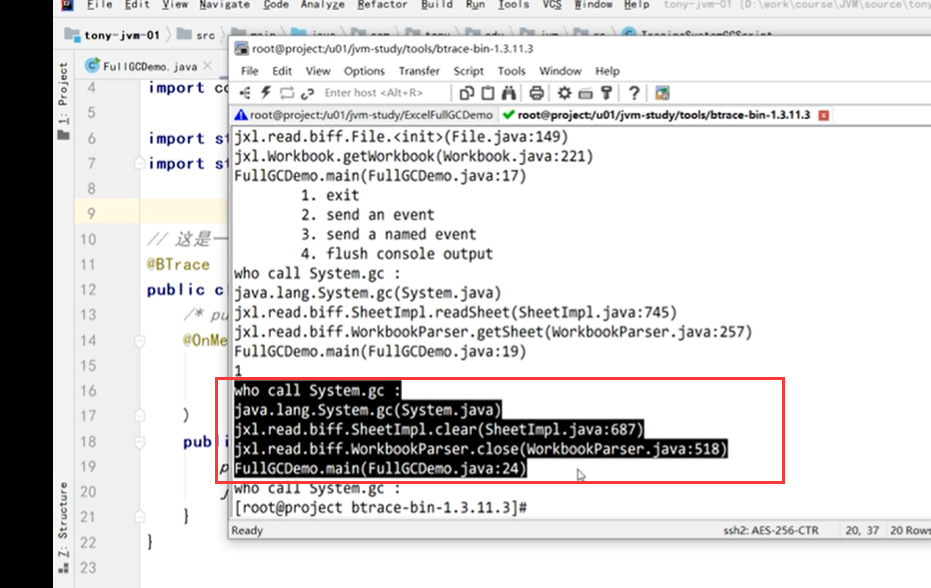
- brace tool - dynamic tracking tool provided by openjdk - understood as dynamic AOP
// This is a script that runs through the btrace tool
@BTrace
public class TracingSystemGCScript {
    /* put your code here */
    @OnMethod(
            clazz = "java.lang.System",
            method = "gc"
    )
    public static void traceExecute() {
        println("who call System.gc :");
        jstack();
    }
}