1. Introduction
When an application is running in a production environment, it is necessary to monitor its health. By understanding the health of the application in real time, you can get a warning before the problem occurs, and you can solve the problem before the customer notices the problem.
In this article, we will create a Spring Boot application to monitor the system with the help of Spring Actuator, Micrometer, Prometheus and Grafana. Among them, Spring Actuator and Micrometer are part of Spring Boot App.

Briefly describe the purpose of the different components:
- Spring Actuator: it provides many Web interfaces in the application to understand the internal situation of the application runtime. For more information, see Spring Boot Actuator in Spring Boot 2.0.
- Micrometer: it provides a general API for performance data collection on the Java platform. It provides a variety of measurement types (Timers, Guauges, Counters, etc.) and supports access to different monitoring systems, such as Influxdb, Graphite, Prometheus, etc. Spring Boot Actuator supports this.
- Prometheus: a time series database used to collect indicators.
- Grafana: dashboard for displaying indicators.
Next, we will introduce each component separately. The code used in this article is archived on GitHub.
2. Create sample application
The first thing to do is to create an application that can be monitored. Through Spring Initializr and adding Spring Boot Actuator, Prometheus and Spring Web dependencies, we created a Spring MVC application as shown below.
@RestController
public class MetricsController {

@GetMapping("/endPoint1")
public String endPoint1() {
return "Metrics for endPoint1";
}

@GetMapping("/endPoint2")
public String endPoint2() {
return "Metrics for endPoint2";
    }
}
Start the application:
$ mvn spring-boot:run
Verify whether the interface is normal:
$ curl http://localhost:8080/endPoint1Metrics for endPoint1$ curl http://localhost:8080/endPoint2Metrics for endPoint2
Verify the Spring Actuator interface. In order to make the response information easy to read, we format the information through python -mjson.tool.
$ curl http://localhost:8080/actuator | python -mjson.tool
...
{
"_links":{
"self":{
"href":"http://localhost:8080/actuator",
"templated":false
      },
"health":{
"href":"http://localhost:8080/actuator/health",
"templated":false
      },
"health-path":{
"href":"http://localhost:8080/actuator/health/{*path}",
"templated":true
      },
"info":{
"href":"http://localhost:8080/actuator/info",
"templated":false
      }
   }
}
By default, the above information is displayed. In addition, Spring Actuator can provide more information, but you need to enable it. To enable Prometheus, you need to add the following information to the application.properties file.
management.endpoints.web.exposure.include=health,info,prometheus
Restart the application and access http://localhost:8080/actuator/prometheus Pull data from Prometheus and return a large number of available indicator information. We only show a small part of the output here because it is a long list.
$ curl http://localhost:8080/actuator/prometheus
# HELP jvm_gc_pause_seconds Time spent in GC pause
# TYPE jvm_gc_pause_seconds summary
jvm_gc_pause_seconds_count{action="end of minor GC",cause="G1 Evacuation Pause",} 2.0
jvm_gc_pause_seconds_sum{action="end of minor GC",cause="G1 Evacuation Pause",} 0.009
...
As mentioned earlier, micrometer is also required. Micrometer provides a simple dashboard for the most popular monitoring systems, allowing the instrumentation of JVM applications, regardless of which vendor provides the indicators. Its function is similar to that of SLF4J, except that it focuses not on Logging, but on application metrics. In short, it is the SLF4J in the application monitoring community.
Spring Boot Actuator provides automatic configuration for micrometer. Spring Boot2 introduces micrometer into the Spring Boot Actuator to reconstruct the 1.x metrics. In addition, there are more monitoring systems supporting docking (Atlas, Datadog, Ganglia, Graphite, Influx, JMX, NewRelic, Prometheus, SignalFx, StatsD, Wavefront).
The updated application.properties file is as follows:
management.endpoints.web.exposure.include=health,info,metrics,prometheus
Restart the application and http://localhost:8080/actuator/metrics Retrieve data from.
$ curl http://localhost:8080/actuator/metrics | python -mjson.tool
...
{
"names": [
"http.server.requests",
"jvm.buffer.count",
"jvm.buffer.memory.used",
...
Specific information can be retrieved directly through the indicator name. For example, if you query the http.server.requests indicator, you can retrieve it as follows:
$ curl http://localhost:8080/actuator/metrics/http.server.requests | python -mjson.tool
...
{
"name": "http.server.requests",
"description": null,
"baseUnit": "seconds",
"measurements": [
        {
"statistic": "COUNT",
"value": 3.0
        },
        {
"statistic": "TOTAL_TIME",
"value": 0.08918682
        },
...
3. Add Prometheus
Prometheus is an open source monitoring system of Cloud Native Computing Foundation. Since our application has a / Actor / Prometheus endpoint for Prometheus to grab data, you can now configure Prometheus to monitor your Spring Boot application.
Prometheus has several installation methods. In this article, we will run Prometheus in the Docker container.
You need to create a prometheus.yml file to add to the Docker container.
global:
scrape_interval:15s

scrape_configs:
- job_name: 'myspringmetricsplanet'
metrics_path: '/actuator/prometheus'
static_configs:
- targets: ['HOST:8080']
- scrape_interval: an indicator of how often Prometheus polls the application
- job_name: polling task name
- metrics_path: the path to the URL of the indicator
- targets: HOST name and port number. When used, replace HOST with the IP address of the HOST
If you have difficulty finding an IP address on Linux, you can use the following command:
$ ip -f inet -o addr show docker0 | awk '{print $4}' | cut -d '/' -f 1
Start the Docker container and map the local prometheus.yml file to the file in the Docker container.
$ docker run \
    -p 9090:9090 \
    -v /path/to/prometheus.yml:/etc/prometheus/prometheus.yml \
    prom/prometheus
After successfully starting the Docker container, first verify whether Prometheus can pass http://localhost:9090/targets Collect data.
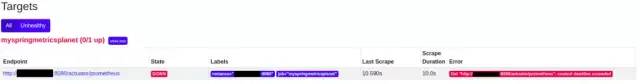
As shown in the figure above, we encountered a context deadline exceeded error, which made Prometheus unable to access the Spring Boot application running on the host. How to solve it?
This error can be resolved by adding the Docker container to your host network, which will enable Prometheus to access the Spring Boot application.
$ docker run \
    --name prometheus \
    --network host \
    -v /path/to/prometheus.yml:/etc/prometheus/prometheus.yml \
    -d \
    prom/prometheus
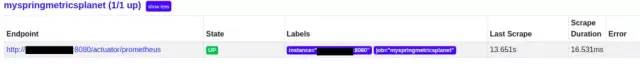
Verify again and the status indication is UP.
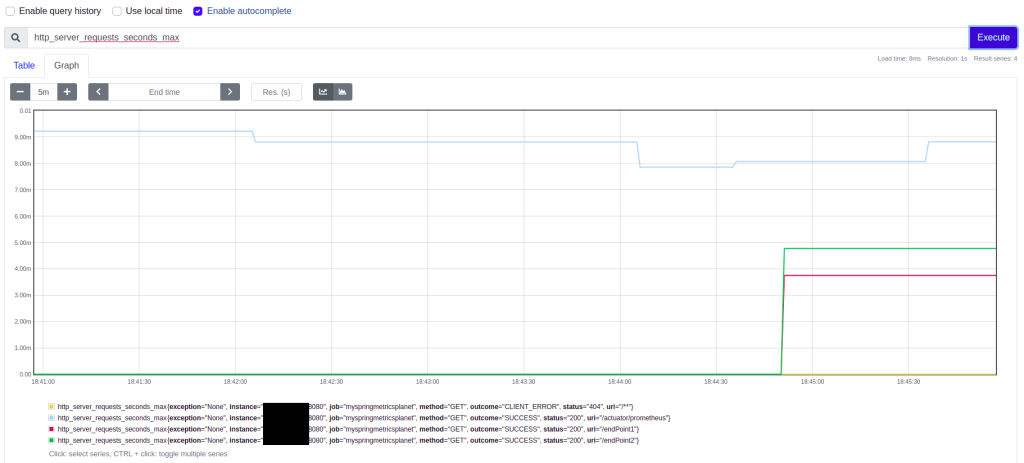
Prometheus metrics can now be displayed. Through access http://localhost:9090/graph , enter HTTP in the search box_ server_ requests_ seconds_ Max and click the execute button to give you the maximum execution time during the request period.
4. Add Grafana
The last component added is grafana. Although Prometheus can display indicators, grafana can help you display indicators in a more elegant dashboard. Grafana also supports several installation methods. In this article, we will also run it in the Docker container.
$ docker run --name grafana -d -p 3000:3000 grafana/grafana
click http://localhost:3000/ , you can access Grafana.
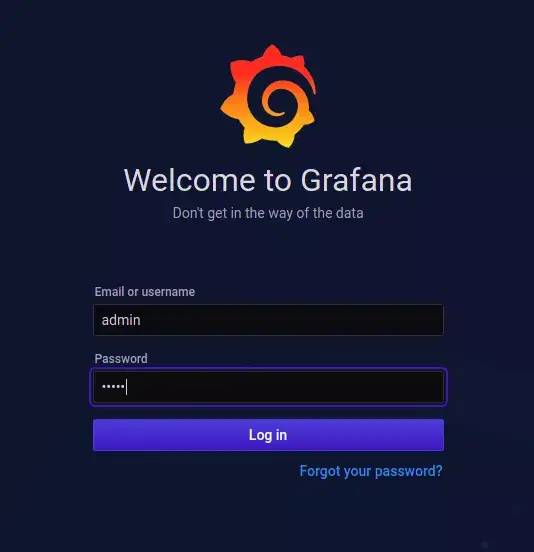
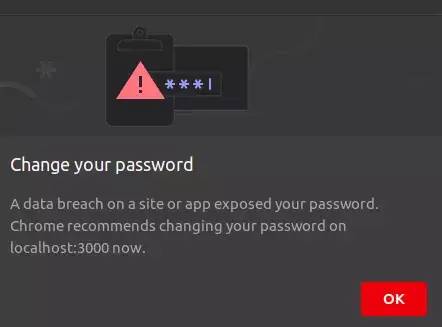
The default user name / password is admin/admin. After you click the login button, you need to change the default password.
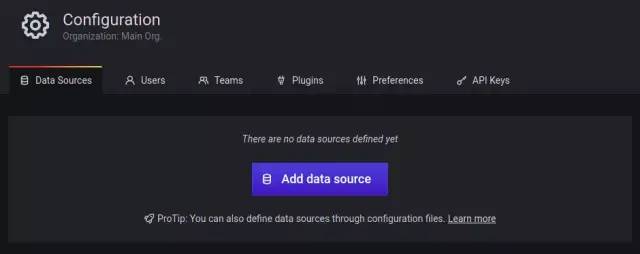
The next step is to add a data source. Click the configuration icon in the left sidebar and select data sources.

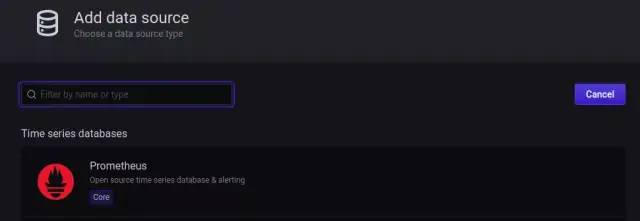
Click the Add data source button.
Prometheus at the top of the list, select Prometheus.
Fill in the URL that can access Prometheus, set HTTP Access as Browser, and then click the Save & Test button at the bottom of the page.
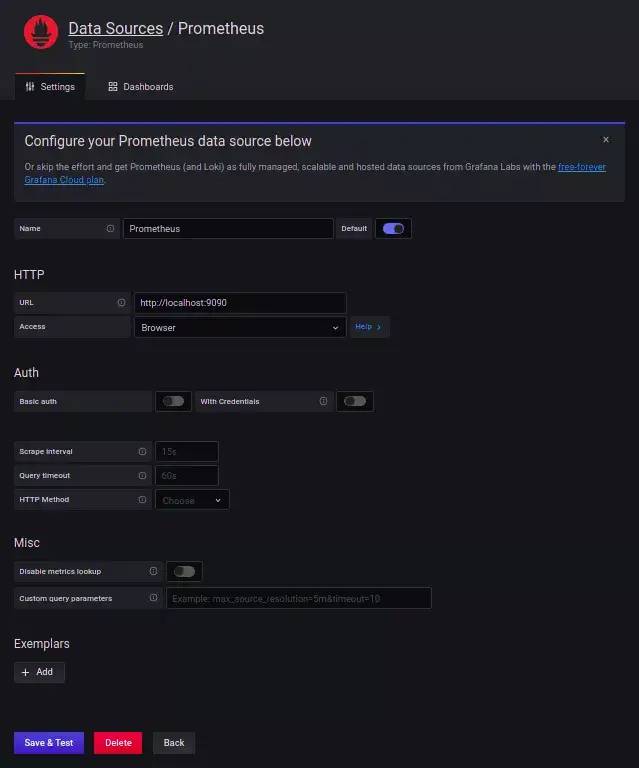
When everything is normal, a green notification banner will be displayed to indicate that the data source is working.

Now it's time to create a dashboard. You can customize one, but you can also use an open source dashboard. A common dashboard for displaying Spring Boot metrics is the JVM dashboard.
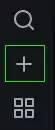
In the left sidebar, click the + sign and select import.
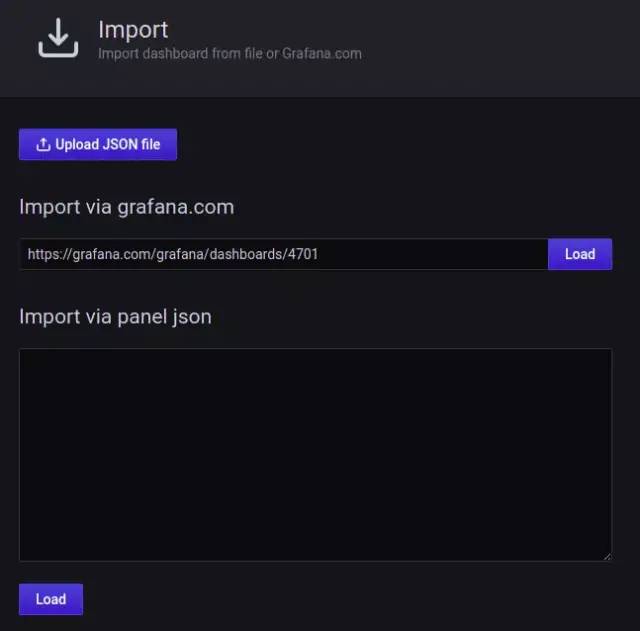
Enter the URL of the JVM dashboard https://grafana.com/grafana/dashboards/4701 , and then click the load button.
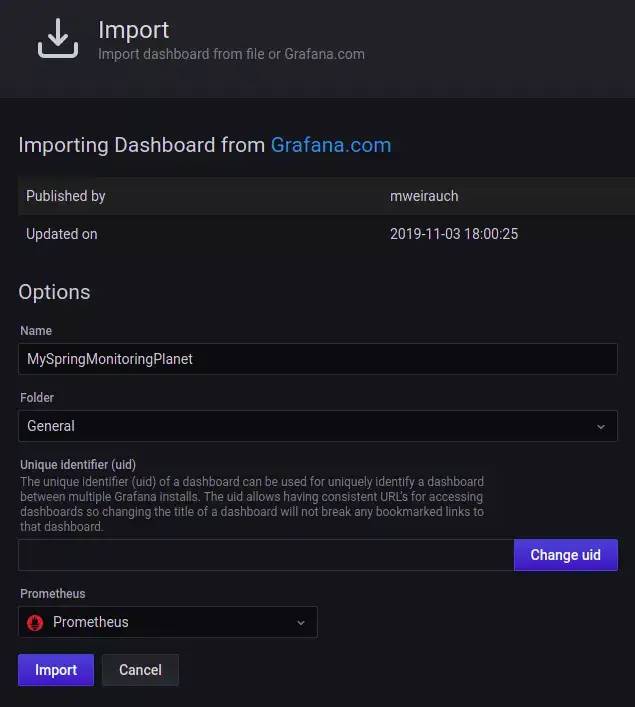
Enter a meaningful name for the dashboard (for example, MySpringMonitoringPlanet), select Prometheus as the data source, and then click the Import button.
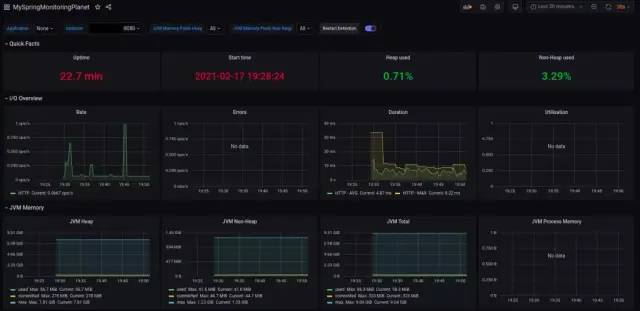
So far, you can use a cool Grafana dashboard.
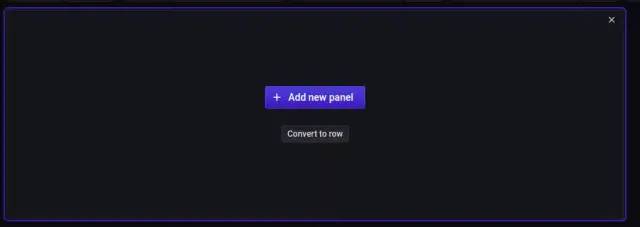
You can also add custom panels to dashboards. At the top of the dashboard, click the Add panel icon.
Click Add new panel.
In the Metrics field, enter http_server_requests_seconds_max, in the Panel title field in the right column, you can enter the name of the panel.
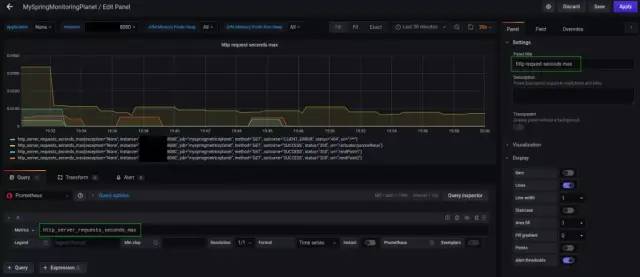
Finally, click the Apply button in the upper right corner and your panel will be added to the dashboard. Don't forget to save the dashboard.
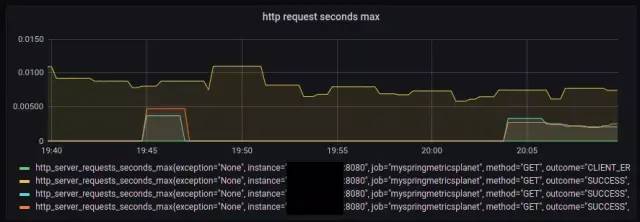
Set some load for the application and look at http on the dashboard_ server_ requests_ seconds_ What happened to max.
$ watch -n 5 curl http://localhost:8080/endPoint1$ watch -n 10 curl http://localhost:8080/endPoint2
5. Conclusion
In this article, we learned how to add some basic monitoring for Spring Boot applications. This is very easy, just by combining Spring Actuator, Micrometer, Prometheus and Grafana.
Of course, this is just a starting point, but from here, you can extend and configure more and more specific indicators for Spring Boot applications.