1. Simple use of canvas Tags
<body>
    <!-- canvas It is a label used to show the effect of drawing. It and img Similarly, they are all in-line block elements -->
    <!-- The same page can have more than one canvas Label -->
    <!-- Canvas default 300*150,To set the width and height of the canvas, you need help canvas Attributes of elements -->
    <canvas id="cvs" width="600" height="600"></canvas>
    <script>
    var cvs = document.getElementById('cvs');

    /*
     * The canvas above is only used to show the effect of drawing.
     * So where does this picture come from?
     * You need to open canvas (through the getContext method) and then draw a graph on it.
     * Ultimately you can see it through the canvas tag.
     * */
    var ctx = cvs.getContext('2d');

    /*
     * canvas Several steps of drawing:
     * 1,Move the pen to the specified position first
     * 2,Start drawing lines
     * 3,stroke path
     * */

    // 1. Move the pen to the specified position first.
    // Ctx. moveTo
    ctx.moveTo(10, 10);

    // 2. Start drawing lines
    // Ctx.lineTo (coordinates of x-axis movement and y-axis movement)
    ctx.lineTo(110, 10);
    ctx.lineTo(110, 110);
    ctx.lineTo(10, 110);
    // The following sentence is equivalent to ctx.closePath();
    ctx.lineTo(10, 10);

    // Color settings must be placed before drawing
    ctx.strokeStyle = 'blue';
    // Width settings must be placed before drawing
    ctx.lineWidth = 2;

    // 3. Edge-tracing Path
    ctx.stroke();
    </script>
</body>

//Display effect: for a blue rectangle
2.
// The path before redrawing is prevented, so the path before redrawing is cleared first.
this.ctx.beginPath();
<!DOCTYPE html>
<html lang="en">
<head>
    <meta charset="UTF-8">
    <title>Title</title>
</head>
<body>
    <canvas id="cvs"></canvas>
    <script>
        var cvs = document.getElementById('cvs');
        var ctx = cvs.getContext('2d');

        // Constructor
        function MyRect( ctx, startX, startY, width, height, lineWidth, strokeStyle ) {
            this.ctx = ctx;
            this.startX = startX;
            this.startY = startY;
            this.width = width;
            this.height = height;
            this.lineWidth = lineWidth;
            this.strokeStyle = strokeStyle;
        }

        // Add a drawing method to the prototype
        JuXing.prototype.draw = function() {
            **// The path before redrawing is prevented, so the path before redrawing is cleared first.
            this.ctx.beginPath();**

            this.ctx.moveTo( this.startX, this.startY );
            this.ctx.lineTo( this.startX + this.width, this.startY );
            this.ctx.lineTo( this.startX + this.width, this.startY + this.height );
            this.ctx.lineTo( this.startX, this.startY + this.height );
            this.ctx.closePath();

            this.ctx.lineWidth = this.lineWidth;
            this.ctx.strokeStyle = this.strokeStyle;

            this.ctx.stroke();
        }

        var myRect = new MyRect( ctx, 10, 10, 60, 60, 4, 'deeppink' );
        myRect.draw();

        var myRect2 = new MyRect( ctx, 100, 10, 100, 100, 6, 'skyblue' );
        myRect2.draw();
    </script>
</body>
</html>
3. Non-zero surround principle
This principle is actually very simple. Send a link. Let's take a look at it. The Principle of Non-zero Surrounding Rule in Canvas
Let's look at the last example of this link. When drawing concentric circles, we use context.arc.
Syntax:
context.arc(x,y,r,sAngle,eAngle,counterclockwise);
Parameter description
The x coordinates of the center of the X circle.
y coordinates of the center of the y circle.
The radius of r circle.
The starting angle of sAngle is measured in radians. The three o'clock position of the circle of the arc is 0 degrees.
eAngle end angle, in radians.
Counterclockwise is optional. It is stipulated whether the drawing should be counterclockwise or clockwise.
False = clockwise, true = counterclockwise.
In this example, the outer circle is true counterclockwise and the inner circle is false clockwise. First, draw the corresponding arrow on the border of the circle.
Then, according to the principle of non-zero surround: 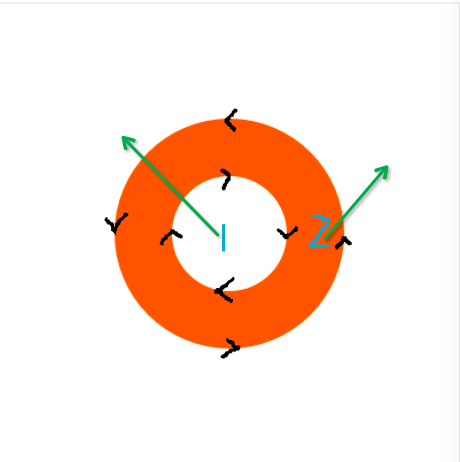
The line drawn from area 1, the two curves intersecting with it, one clockwise and one counterclockwise, turns out to be 0, so area 1 will not be fill ed.
Looking at the 2 regions, there is only one curve intersecting with it, counterclockwise line, the result is - 1, so the 2 regions will be filled, that's easy. If the painting is held, how do you step by step lineTo, lineTo determines the direction of the painting.
Try drawing a hollow rectangle.

<body>
    <canvas id="cvs"></canvas>
    <script>
    var cvs = document.getElementById('cvs');
    var ctx = cvs.getContext('2d');

    // Encapsulate a function that draws a rectangle
    function MyRect(startX, startY, width, height, lineWidth, strokeStyle) {

        ctx.moveTo(startX, startY);
        ctx.lineTo(startX + width, startY);
        ctx.lineTo(startX + width, startY + height);
        ctx.lineTo(startX, startY + height);
        ctx.closePath();

        ctx.lineWidth = lineWidth;
        ctx.strokeStyle = strokeStyle;

        ctx.stroke();
    }

    // Draw a large rectangle clockwise
    MyRect(10, 10, 100, 100, 6, 'skyblue');


    //This sentence does not need ctx.beginPath();

    // Draw a small rectangle counterclockwise
    ctx.moveTo(35, 35);
    ctx.lineTo(35, 55);
    ctx.lineTo(55, 55);
    ctx.lineTo(55, 35);
    ctx.closePath();

    ctx.lineWidth = 4;
    ctx.strokeStyle = 'blue';
    // Making use of the principle of non-zero surroundings
    ctx.fillStyle = 'yellow';
    // Fill together
    ctx.fill();
    </script>
</body>
4. The invocation order of fill () and stroke() methods
 stay sublime You can see the difference when you run in the middle.
    <script>
        var cvs = document.getElementById('cvs');
        var ctx = cvs.getContext('2d');

        // Encapsulate a function that draws a rectangle
        function juXing( startX, startY, width, height, lineWidth, strokeStyle, fillStyle ) {
            ctx.moveTo( startX, startY );
            ctx.lineTo( startX + width, startY );
            ctx.lineTo( startX + width, startY + height );
            ctx.lineTo( startX, startY + height );
            ctx.closePath();
            ctx.lineWidth = lineWidth;
            ctx.strokeStyle = strokeStyle;
            ctx.fillStyle = fillStyle;

            ctx.fill();
            ctx.stroke();
        }

        /*
        * When the edge is drawn, it takes up a part of the original figure (half the width of the line).
        * Therefore, in daily development, in order to make the line width meet the requirements,
        * It's better to fill first and then draw the edge to prevent half of the line width from falling off when filling.
        * */
    </script>
5. Wire Cap Style
<body>
    <canvas id="cvs" width="500" height="500"></canvas>
    <script>
        var cvs = document.getElementById('cvs');
        var ctx = cvs.getContext('2d');

        /*
        * Set cap style:
        * ctx.lineCap = 'butt' ,'round','square'
        * butt It is the default value.
        * round The thread head is round.
        * square Increase the line width by half at each end of the line.
        * */

        ctx.lineWidth = 10;

        // Default thread
        ctx.moveTo( 10, 10 );
        ctx.lineTo( 310, 10 );
        ctx.stroke();

        // Growth line head, half of the line width at each end
        ctx.beginPath();
        ctx.lineCap = 'square';
        ctx.moveTo( 10, 30 );
        ctx.lineTo( 310, 30 );
        ctx.stroke();

        // A circular head with a radius of half the width of the line at each end.
        ctx.beginPath();
        ctx.lineCap = 'round';
        ctx.moveTo( 10, 50 );
        ctx.lineTo( 310, 50 );
        ctx.stroke();
    </script>
</body>
6. Line intersection style
<body>
    <canvas id="cvs" width="500" height="500"></canvas>
    <script>
        var cvs = document.getElementById('cvs');
        var ctx = cvs.getContext('2d');

        /*
        * Set cap style:
        * ctx.lineJoin = 'miter' ,'round','bevel'
        * miter It is the default value. The two sides extend outward and intersect at sharp corners.
        * round It's round head.
        * bevel The two sides are connected into an inclined plane.
        * */

        ctx.lineWidth = 10;

        // Default intersection point is sharp corner
        ctx.lineJoin = 'miter';
        ctx.moveTo( 10, 10 );
        ctx.lineTo( 60, 110 );
        ctx.lineTo( 110, 10 );
        ctx.stroke();

        // The intersection point is a round head.
        ctx.beginPath();
        ctx.lineJoin = 'round';
        ctx.moveTo( 10, 50 );
        ctx.lineTo( 60, 150 );
        ctx.lineTo( 110, 50 );
        ctx.stroke();

        // The intersection point is an oblique plane
        ctx.beginPath();
        ctx.lineJoin = 'bevel';
        ctx.moveTo( 10, 90 );
        ctx.lineTo( 60, 190 );
        ctx.lineTo( 110, 90 );
        ctx.stroke();
    </script>
</body>
7. Move the canvas by clearing the canvas
<body>
    <canvas id="cvs" width="500" height="500">
    </canvas>
    <script>
    var cvs = document.getElementById('cvs');
    var ctx = cvs.getContext('2d');

    function Rect(ctx, originX, originY, width, height, linewidth, strokestyle) {
        this.ctx = ctx;
        this.originX = originX;
        this.originY = originY;
        this.width = width;
        this.height = height;
        this.linewidth = linewidth;
        this.strokestyle = strokestyle;
    }

    Rect.prototype.draw = function() {
        this.ctx.beginPath();
        this.ctx.moveTo(this.originX, this.originY);
        this.ctx.lineTo(this.originX + this.width, this.originY);
        this.ctx.lineTo(this.originX + this.width, this.originY + this.height);
        this.ctx.lineTo(this.originX, this.originY + this.height);
        this.ctx.closePath();

        this.ctx.lineWidth = this.linewidth;
        this.ctx.strokeStyle = this.strokestyle;
        this.ctx.stroke();
    }

    var rect = new Rect(ctx, 10, 10, 60, 60, 4, 'deeppink');
    rect.draw();

    setInterval(function() {
        // Clear out the contents of the canvas
        ctx.clearRect(0, 0, cvs.width, cvs.height);
        rect.originX += 2;
        rect.draw();
    }, 0.5);
    </script>
</body>
8. Draw dotted lines ctx.setLineDash() and ctx.lineDashOffset()
Knowledge points:
   <script>
        /*
        * Array map method, provided by es5
        * Grammar: Array. map (function (val, index, arr) {return 1;})
        * Return value: An array of callback reurn values
        * */

        var arr = [ 1, 2, 3, 4, 5];

        var newArr = arr.map( function( val, index ) {
            return val * 10;
        });
        console.log( newArr );
    </script>


----------


    <canvas id="cvs"></canvas>
    <script>
        var cvs = document.getElementById('cvs');
        var ctx = cvs.getContext('2d');
        /*
        * Set the size of the blank and solid parts when drawing lines.
        * ctx.setLineDash( [ 5, 3 ] )
        * */
        ctx.lineDashOffset = 3;
        ctx.setLineDash( [ 4, 3, 2 ] );

        ctx.moveTo( 10, 10 );
        ctx.lineTo( 310, 10 );
        ctx.stroke();
        /*
         * Gets the line drawing rule.
         * ctx.getLineDash()
         * */
        console.log(ctx.getLineDash());

        /*
        * Set the offset for dashed line drawing
        * ctx.lineDashOffset = 3;
        * */
    </script>
9. Draw a coordinate axis, draw arrows, draw points, and connect them.
<body>
    <canvas id="cvs" width="500" height="500"></canvas>
    <script>
        var cvs = document.getElementById('cvs');
        var ctx = cvs.getContext('2d');

        ctx.lineWidth = 2;

        // The distance between the coordinate axis and the upper right and lower left edges of the canvas
        var padding = {
            top: 20,
            right: 20,
            bottom: 20,
            left: 20
        }

        // Width and height of arrows in coordinate axes
        var arrow = {
            width: 12,
            height: 20
        }

        // Finding the coordinates of the vertices on the axis of coordinates
        var vertexTop = {
            x: padding.left,
            y: padding.top
        }

        // Finding the coordinates of the origin of the coordinate axis
        var origin = {
            x: padding.left,
            y: cvs.height - padding.bottom
        }

        // Finding the coordinates of the right vertex of the coordinate axis
        var vertexRight = {
            x: cvs.width - padding.right,
            y: cvs.height - padding.bottom
        }


        // Draw two lines in the coordinate axis
        ctx.moveTo( vertexTop.x, vertexTop.y );
        ctx.lineTo( origin.x, origin.y );
        ctx.lineTo( vertexRight.x, vertexRight.y );
        ctx.stroke();

        // Draw a vertex arrow
        ctx.beginPath();
        ctx.moveTo( vertexTop.x, vertexTop.y );
        ctx.lineTo( vertexTop.x - arrow.width / 2, vertexTop.y + arrow.height );
        ctx.lineTo( vertexTop.x, vertexTop.y + arrow.height / 2 );
        ctx.lineTo( vertexTop.x + arrow.width / 2, vertexTop.y + arrow.height );
        ctx.closePath();
        ctx.fill();

        // Draw the right vertex arrow
        ctx.beginPath();
        ctx.moveTo( vertexRight.x, vertexRight.y );
        ctx.lineTo( vertexRight.x - arrow.height, vertexRight.y - arrow.width / 2 );
        ctx.lineTo( vertexRight.x - arrow.height / 2, vertexRight.y );
        ctx.lineTo( vertexRight.x - arrow.height, vertexRight.y + arrow.width / 2 );
        ctx.closePath();
        ctx.fill();

        /*
        * Drawing points at specified positions in coordinate axes, coordinate algorithm:
        * X-axis of point: x-coordinate of origin + horizontal distance from point to origin
        * Y-axis of a point: y-coordinate of the origin-vertical distance from the point to the origin
        * */

        // Demand, show the daily sales volume of paternal sauce and fragrant cakes at the entrance by means of a broken line chart
        // [ 10, 20, 50, 80, 120, 300, 100, 50, 2 ];

        var data = [ 10, 20, 50, 80, 120, 300, 100, 50, 2 ];

        // Draw points
        data.forEach( function( val, index ) {
            console.log(val,index);
            ctx.fillRect( origin.x + index * 20 - 2, origin.y - val - 2, 4, 4 );
        });

        // Draw a broken line
        ctx.beginPath();
        data.forEach( function( val, index ) {
            ctx.lineTo( origin.x + index * 20, origin.y - val );
        });
        ctx.stroke();
    </script>
</body>