1. sql Title Brushing
There are two main purposes to do this topic, preparing for the interview and understanding the business logic and thinking style of the data analyst in practice. Most of the data analysts are biased toward the business side, with the indicators increasing or decreasing, how to analyze, from which angles to analyze, communicate with the business operation classmates in time after finding the cause, and put forward suggestions for adjustment.
Never refresh your questions for the sake of refreshing them. You must think and analyze your business in practice. In addition, the basic grammar does not need to be over-practiced, such as adding or deleting, because few business analysts have so much data authority to directly adjust the data in the database. Queries are the most common. If you have a good understanding of the basic grammar, you can just check it when you are not clear.
2. Interview Questions of Lala sql for Internet Large Factory
The topic is mainly about the query of order cancellation dimension. In addition to the query statement, you can also think about why you want to check this indicator? The reason for the change of the indicator is what measures may be.
1. Introduction to Goodla sql data table
hll_t1 is an order form that contains the order number, user id, driver id, city, order status, order time
| order_id | usr_id | driver_id | cty | status | order_dt |
|---|---|---|---|---|---|
| 1 | 1 | d16 | Beijing | cancel_by_driver | 2020/1/23 |
| 2 | 6 | d12 | Shanghai | completed | 2020/1/24 |
| 3 | 3 | d15 | Shenzhen | cancel_by_usr | 2020/1/25 |
| 4 | 5 | d14 | Guangzhou | cancel_by_driver | 2020/1/26 |
hll_t2 is a platform user table that contains user ids, whether blackened by the platform, identity roles (passengers, drivers)
| usr_id | banned | role |
|---|---|---|
| 1 | 0 | usr |
| d11 | 1 | driver |
| d12 | 0 | driver |
| 5 | 1 | usr |
You can go directly to the sql website for online exercises, you can brush the questions online, or it is better.
Currently, there are real questions interviewed by sql data analysts from B-station, NetEase, Xiaohongshu, Fast-hand, Jingdong, Tiao, WeChat, Today's headlines, Alipay, Lilis, Millet and other Internet big factories. With the answers, you can see the scores of sql sentences, and the questions are still increasing.
sql Internet Factory Interview True Questionhttp://www.sqlintern.com/sansa

2. Exercise sql statements for goods pull orders
(1) What is the ratio of banned traffic to banned traffic (banned=1)?
(Keep two decimal places) (1 point)
a.30.30%, 27.27%
b.23.34%, 28.34%
c.39.34%, 23.87%
---------------------------------
Clear questions:
Regardless of which party, the prohibited indicators are divided into prohibited and not prohibited, the prohibition ratio is: the number of prohibited users on one side / the total number of prohibited users on one side (prohibited + not prohibited), that is, the total number of such users, sum(banned = 1) / count(1)
Solving ideas:
-- Use Grouping group by role
-- Count eligible conditions within a group sum(banned)
-- Calculate the total number of records in a group count(1)
-- sql Keep decimal round(x, d), x Is the number to be processed, d Is a reserved number of digits
-- sql StringBuilder concat(str1, str2),Placing numbers directly can also be stitched, resulting in a string type
Reference Answer
select

	role
,	sum(banned) as banned_num
,	count(1) as all_num
,	concat(round(sum(banned) / count(1), 4) * 100, '%') as banned_rate

from
hll_t2
group by role
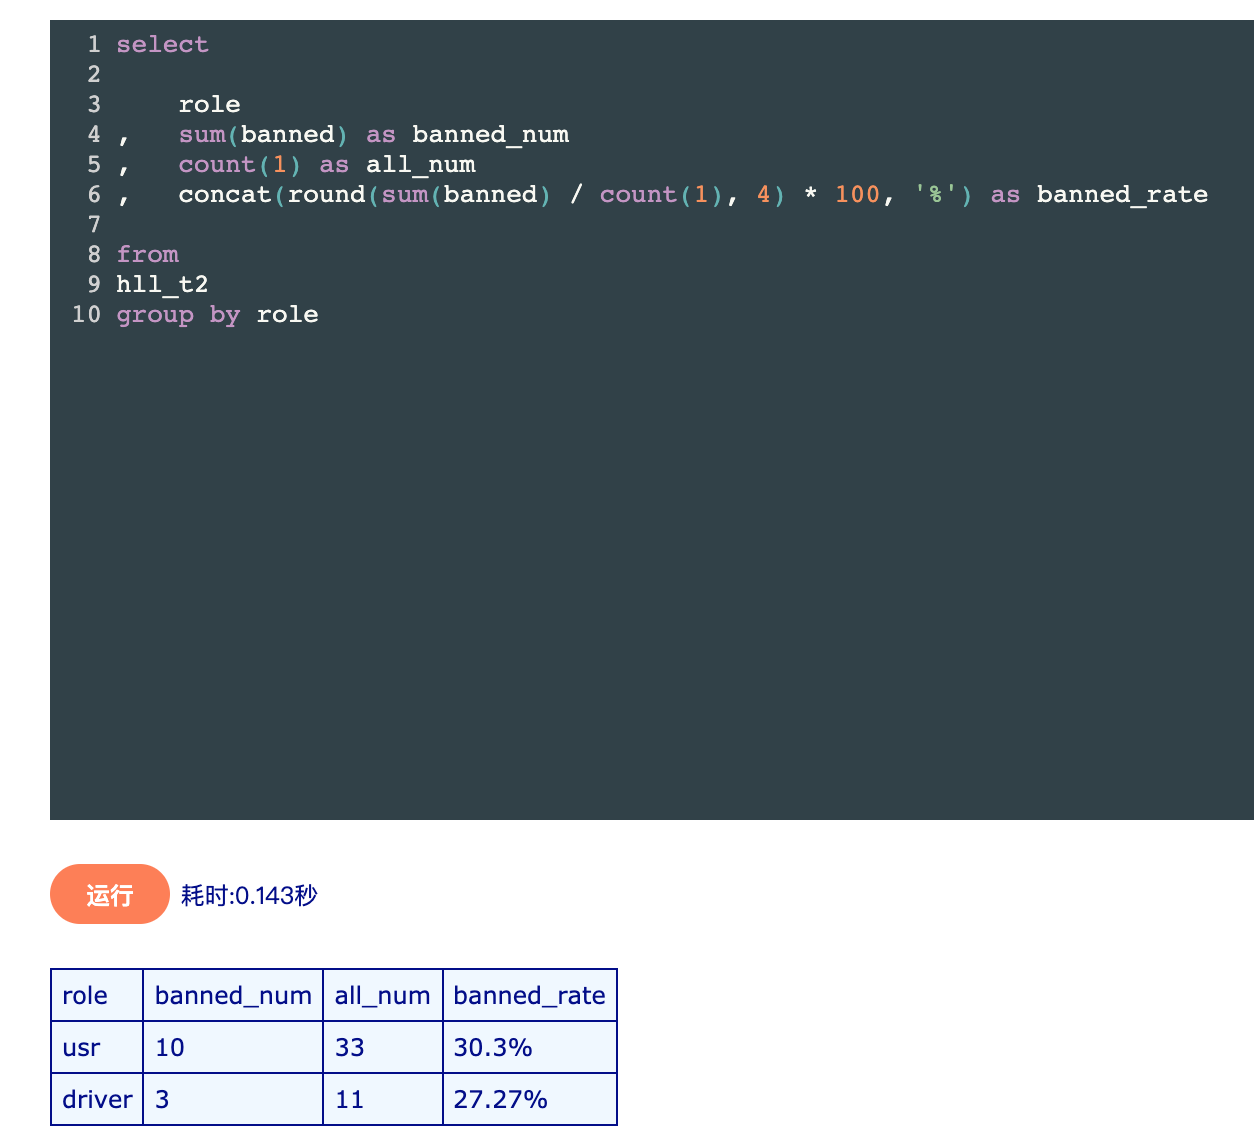
Answer
a, 30.30% and 27.27%
Think Time
The blackened users and drivers on the platform are 30.30% and 27.27%, respectively. It seems that the quality of users on the driver side is slightly higher.
What might be the reason? How many of the drivers who do cargo pull-outs make a living from this and have no other economic income. If they are blacked, they lose their jobs. So the drivers may obey the rules of the platform more subjectively, while the drivers may not. There are many alternative ways to transport goods.
Maybe most of the users are not high frequency users, most of them use it once in a while. For example, I only use goods pulling when I move, so can I further analyze the activity of the users and drivers.
There may be many reasons for being blacked. We can also check the last and last blackened user's order for analysis. No more expansion.
(2) The order completion rate on January 25, 2020?
a.70%
b.30%
c.65%
---------------------------------
Clear questions:
The order completion rate is the number of orders completed/the total number of orders, and the order time is the specific date.
Solving ideas:
-- Screening order time where order_dt = 2020/1/25
-- Dates can also be grouped group by order_dt
-- Quantity of orders completed sum(status = 'completed')
-- Quantity of orders completed sum(if(status = 'completed', 1, 0))
-- count(status = 'completed')Not possible, explained below
-- count(Total Order Quantity)
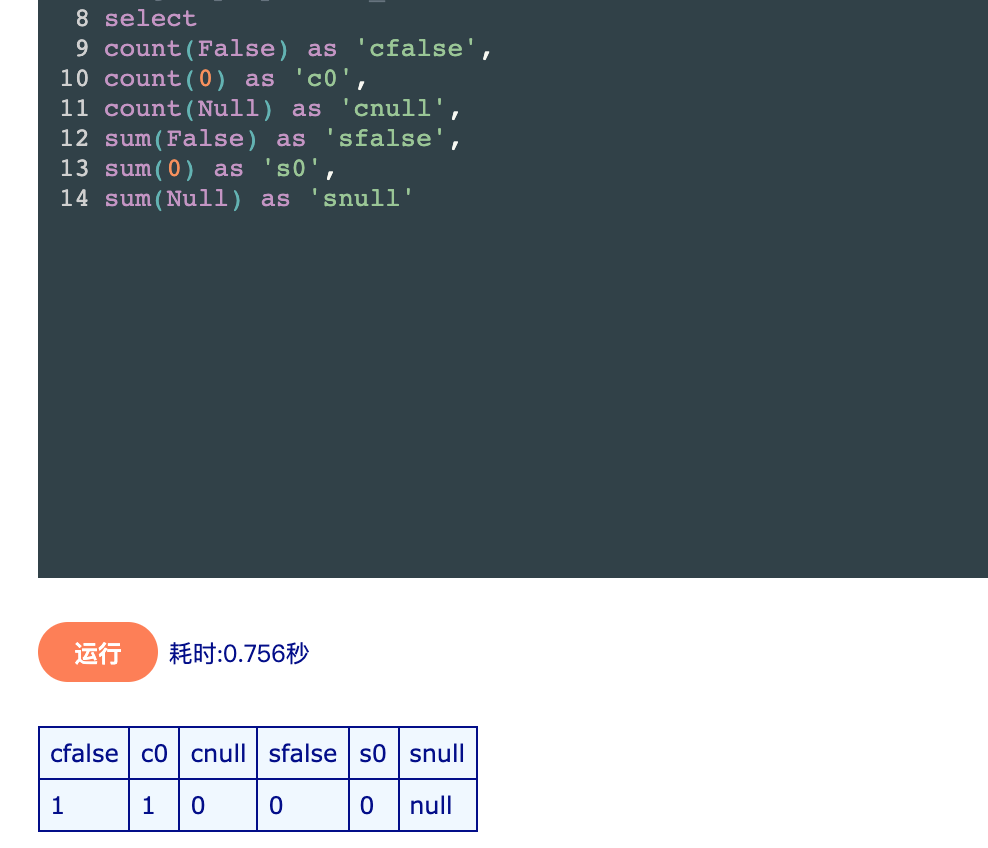
Count counts all conditions for non-null, count(Fasle), count(0), count(1) results are 1, only count(Null) results are 0, that is, counts are only valid as long as they are not counted for Null, so sum(status ='completed') is used.
Reference Answer:
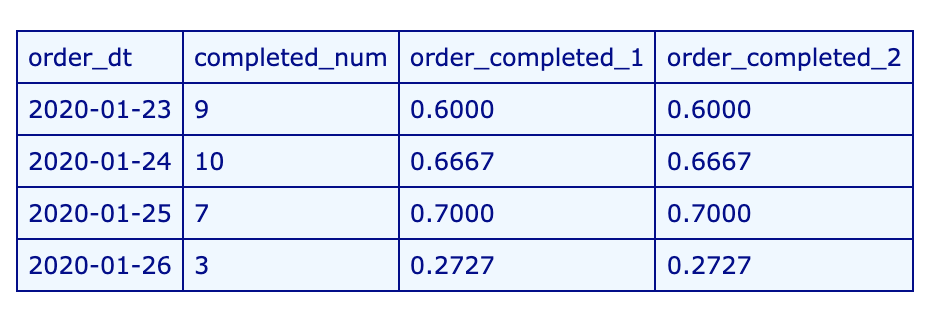
select
	order_dt
,	sum(status = 'completed') as 'completed_num'
-- Method 1: Direct use sum()
, 	(sum(status = 'completed') / count(1)) as 'order_completed_1'
-- Method 2:Use sum(if(a, b, c))Combination
,	(sum(if(status = 'completed', 1, 0)) / count(1)) as 'order_completed_2'

from hll_t1
group by order_dt
-- Or not having,Subtable the result set where order_dt = '2020/1/25'A filter of
having order_dt = '2020/1/25'
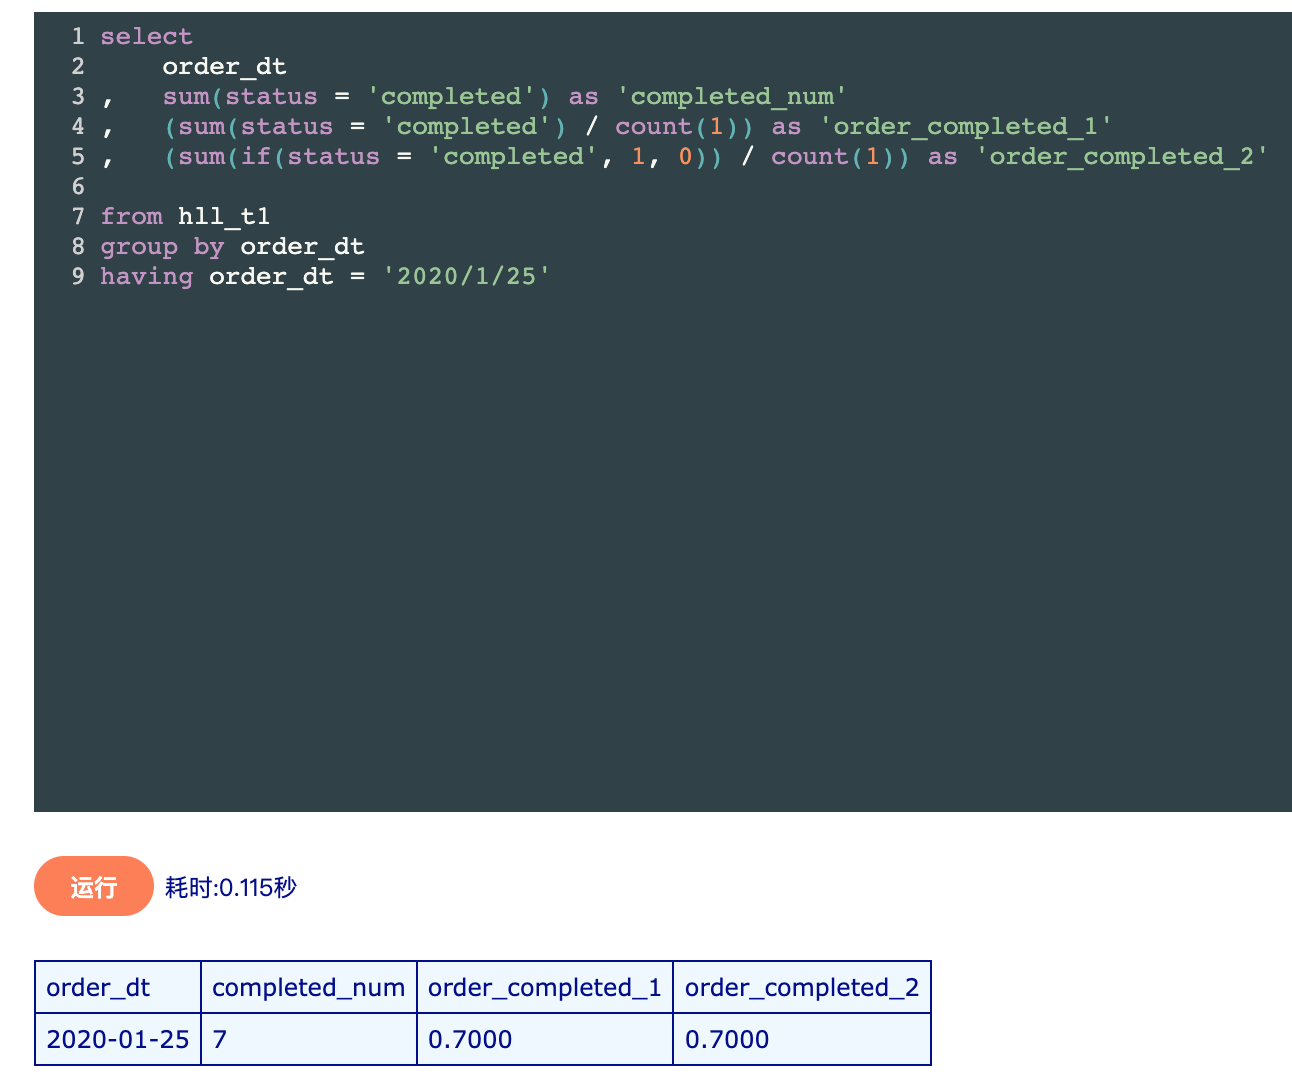
The results in the figure above use a having filter, while the figure below uses only group by grouped results, not a having filter.
Answer:
a,70%
Think time:
The order completion rate is a very important indicator, which basically reflects whether the basic delivery quality of product services is up to the standards, and whether they meet the needs and standards of users.
If you order by desc the large result set, you can find that the order completion rate of 2020/1/25 is 70%, the lowest is 27%, which is a big difference. Then you need to make a detailed analysis of the order of 2020/01/26. Is it a weekend? What is the weather reason? Who is canceling and so on?
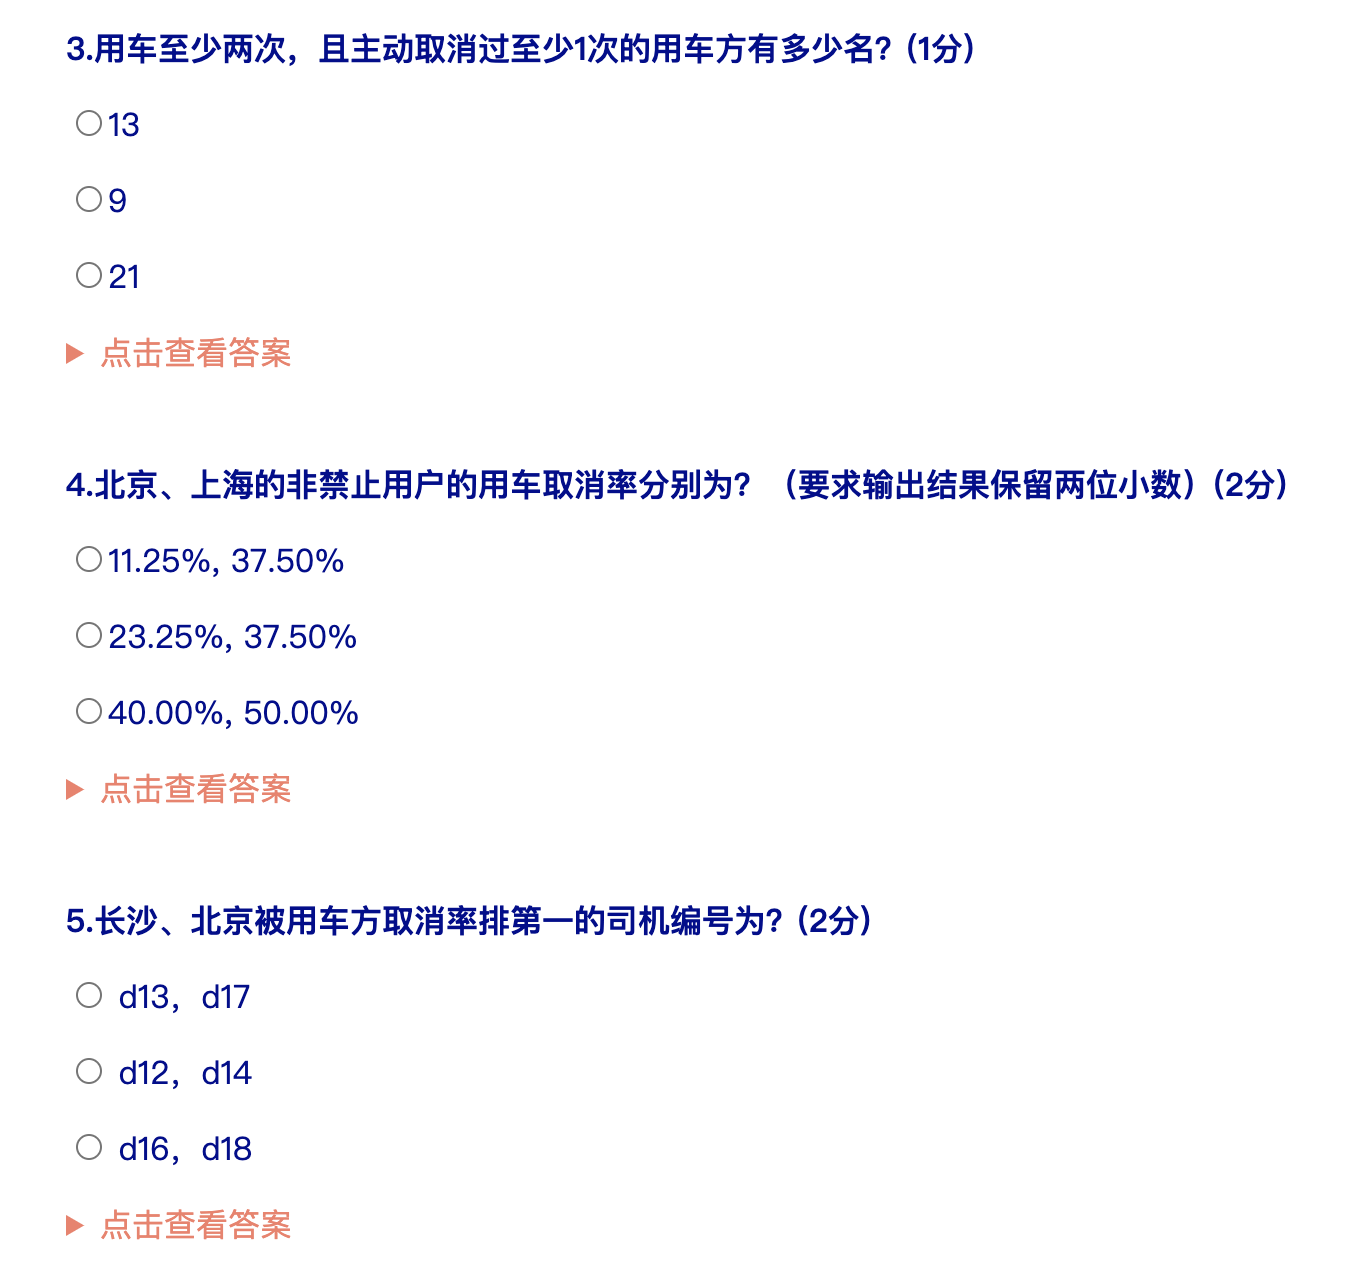
(3) How many users have used the car at least twice and voluntarily cancelled it at least once?
a.13
b.9
c.21
Clear questions:
An order is a car owner, because there is no order without a car owner. To use a car at least twice means to use the car owner's order number >=2. To cancel at least once actively, the number of status cancel_by_usr >=1.
Solving ideas:
-- Screening out vehicles usr_id As a restriction
-- Order Quantity count(order_id) >= 2
-- Count the number of active cancellations sum(status = 'cancel_by_usr') >= 1
Reference Answer:
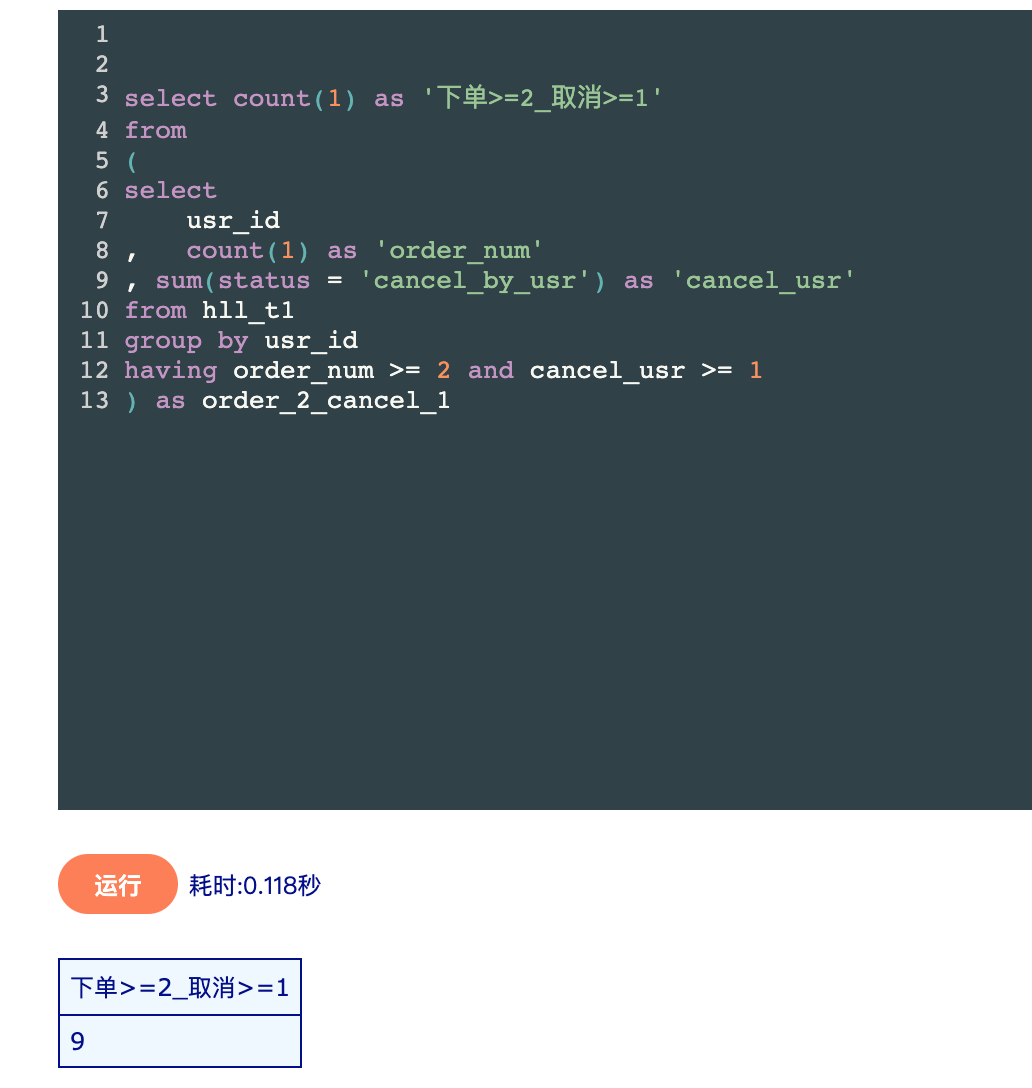
select count(1) as 'Place an order>=2_cancel>=1'
from
(-- Construct Subtable: Large Result Set
select
	usr_id
,	count(1) as 'order_num' -- Calculate Order Quantity
, sum(status = 'cancel_by_usr') as 'cancel_usr' -- Count Cancellations
from hll_t1
group by usr_id -- Group by User
having order_num >= 2 and cancel_usr >= 1 -- Conditional filtering
) as order_2_cancel_1
Answer:
a,9
Think time:
The order completion rate and cancellations can reflect the health of a particular aspect of the business, such as whether cancellations are similar for users with different quantities of orders, as shown in the table below.
| Order volume interval | Number of Cancellations |
|---|---|
| 10-20 | 0-1 |
| 21-40 | 3-5 |
| 41-70 | 8-15 |
(4) What are the cancellation rates for non-prohibited users in Beijing and Shanghai?
Require output results to retain two decimal places
a.11.25%, 37.50%
b.23.25%, 37.50%
c.40.00%, 50.00%
Clear questions:
Vehicle cancellation rate is the cancelled order quantity/total order quantity.
Solving ideas:
Shanghai and Beijing are screening criteria and need to be grouped
Non-prohibited users (usr and driver) are filter criteria, and cancellation criteria are not in the same table
Subtable or table join required
Vehicle Cancellation Rate = Number of orders cancelled within the group / Total number of vehicles in the group
Reference Answer:
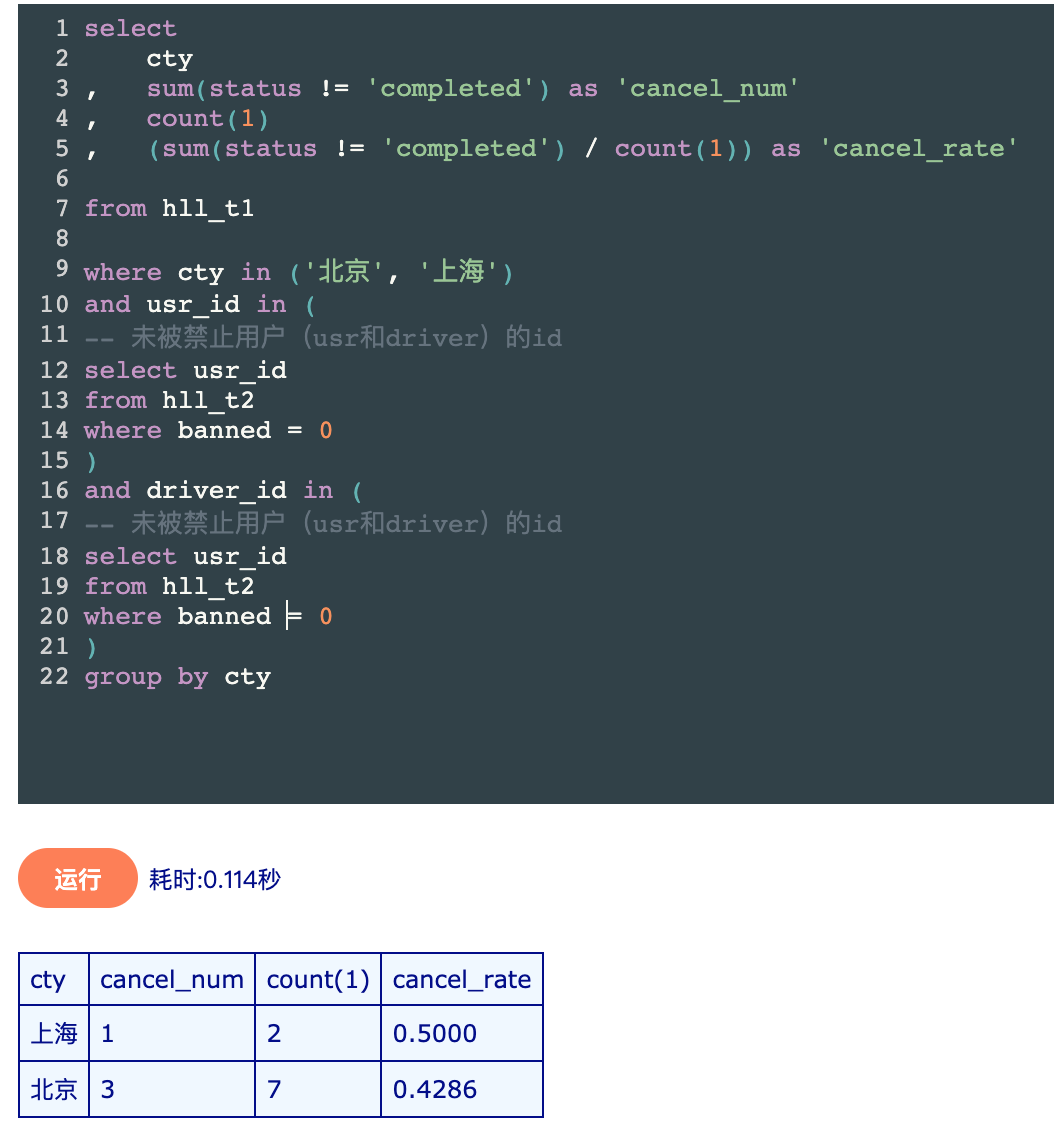
select
	cty
,	sum(status != 'completed') as 'cancel_num'
,	count(1)
,	(sum(status != 'completed') / count(1)) as 'cancel_rate'

from hll_t1

where cty in ('Beijing', 'Shanghai')
and usr_id in (
-- Users not banned ( usr and driver)Of id
select usr_id
from hll_t2
where banned = 0
)
and driver_id in (
-- Users not banned ( usr and driver)Of id
select usr_id
from hll_t2
where banned = 0
)
group by cty
Answer:
d, 40%, 50%
Think time:
Let me see
(5) What is the driver number of Changsha and Beijing being the first to be cancelled by the car owners?
a.d13,d17
b. d12,d14
c. d16,d18
Clear questions:
Every driver has many orders, some of which have been cancelled, and the highest cancellation rate has been found.
Solving ideas:
Changsha and Beijing are grouping conditions
Cancellation by the vehicle is the judgment
Group by city and driver
Reference Answer:
-- Window Function Usage
select * from
(
select
	cty
,	driver_id
,	cancel_num
,	cancel_rate
,	dense_rank() over(partition by cty order by cancel_rate desc) as 'rank'

from

(-- Result Set Subtable of Cancellation Rate
select
	cty
,	driver_id
,	sum(status = 'cancel_by_usr') as 'cancel_num'
,	(sum(status = 'cancel_by_usr') / count(1)) as 'cancel_rate'

from hll_t1

where cty in ('Changsha', 'Beijing')
group by cty, driver_id
) as cancel_rate_t
) as cancel_rate_rank
where cancel_rate_rank.rank = 1
Answer:
d, d16 and d18
Think time:
Let me see