Basic application of Opencv
Article directory
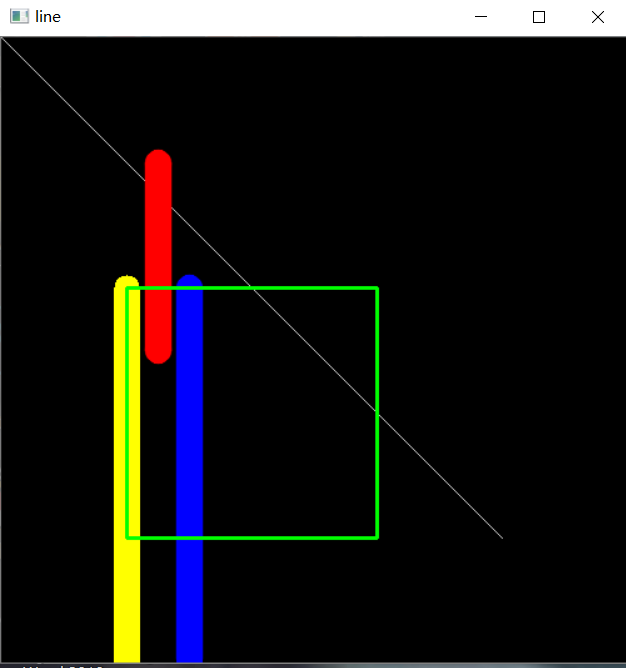
1. Line drawing
- Method
cv2.line(img, pt1, pt2, color, thickness, lineType, shift ) - Parameters:
1. img: image;
2. pt1: the first point of the line segment.
3. pt2: the second point of the line segment;
4. Color: color line color.
5. Thickness: thickness of thickness line.
6. lineType: the lineType of the line. See lineType.
7. Shift: shift of decimal places in point coordinates - With the upper left corner as the coordinate origin, the coordinate is (x, y)
import cv2
import numpy as np

#Define the width and height information of the picture
newimage = (500, 500, 3)
image = np.zeros(newimage, np.uint8)
# Draw line segments
#Parameters: 1. dst; 2. Start position; 3. End position; 4. Color
cv2.line(image, (0, 0), (400,400), (200, 200, 200))
#Golden vertical line, thick
#Parameters: 1. dst; 2. Start position; 3. End position; 4. Color; 5. Thickness of thickness line
cv2.line(image, (100,500), (100, 200), (0, 255, 255), 20)
#Blue vertical line with smooth tip
#Parameters: 1. dst; 2. Start position; 3. End position; 4. Color; 5. Thickness of thickness line; 6. Line type of line
cv2.line(image, (150,500), (150, 200), (255, 0, 0), 20, cv2.LINE_AA)
#Parameters: 1. dst; 2. Start position; 3. End position; 4. Color; 5. Thickness of thickness line; 6. Line type of line
cv2.line(image, (250,500), (250, 200), (0, 0, 255), 20, cv2.LINE_AA, 1)
# Draw rectangles with straight lines
cv2.line(image, (100,200), (300, 200), (0, 255, 0), 2)
cv2.line(image, (300,200), (300, 400), (0, 255, 0), 2)
cv2.line(image, (300,400), (100, 400), (0, 255, 0), 2)
cv2.line(image, (100,400), (100, 200), (0, 255, 0), 2)
cv2.imshow('line', image)
cv2.waitKey(0)
cv2.destroyAllWindows()
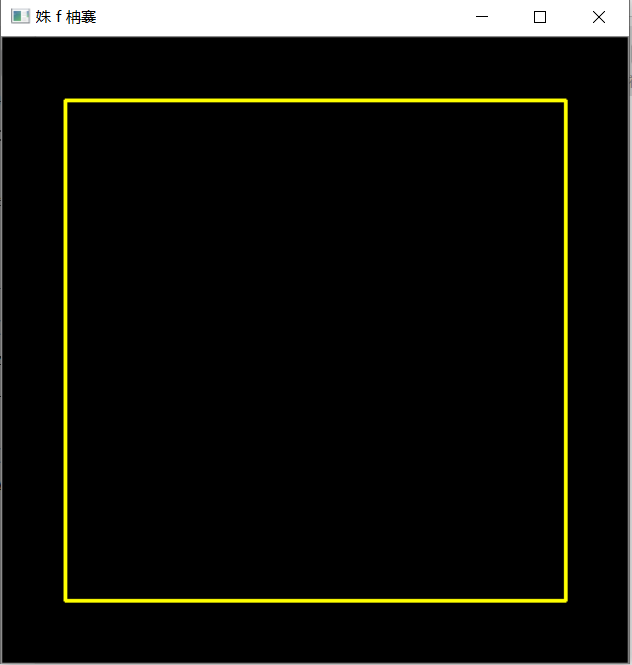
2. Rectangle drawing
- Method
cv2.rectangle(img, pt1, pt2, color, thickness, lineType, shift) - Parameters:
1. img: image;
2. pt1: the vertex of the rectangle.
3. pt2: the vertex of the relative rectangle;
4. Color: rectangular color or brightness (grayscale image).
5. Thickness: the thickness of a rectangular line. Negative, fill.
6. lineType: lineType.
7. Shift: parameter shift of decimal places in point coordinates.
#Define the width and height information of the picture
newimage = (500, 500, 3)
image = np.zeros(newimage, np.uint8)
cv2.rectangle(image, (50,50),(450,450), (0, 255, 255), 2)
cv2.imshow('Square', image)
cv2.waitKey(0)
cv2.destroyAllWindows()
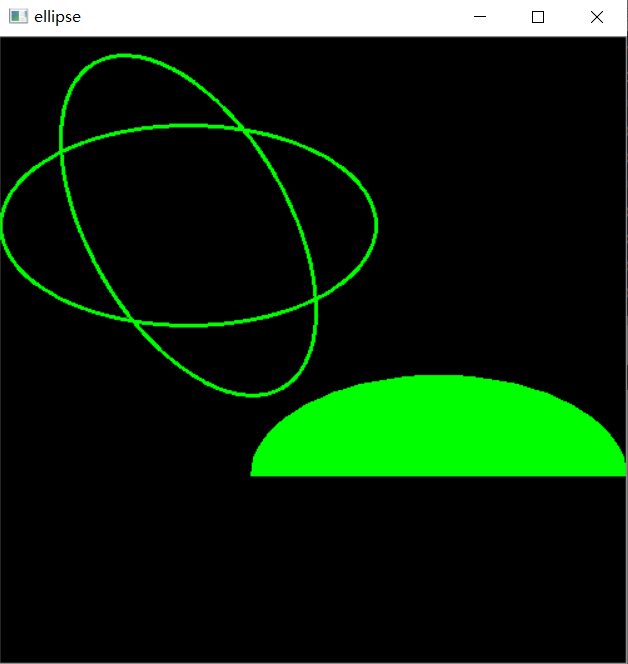
3. Ellipse and sector drawing
- Method
cv2.ellipse(img, center, axes, angle, startAngle, endAngle, color, thickness, lineType, shift) - Parameters:
1. img: image;
2. Center: the center of the ellipse.
3. axes: half of the spindle size.
4. Angle: rotation angle (degrees).
5. startAngle: start angle.
6. endAngle: end angle.
4. Color: color or brightness (grayscale image).
5. Thickness: contour thickness. Negative, fill.
6. lineType: lineType.
7. Shift: parameter shift of decimal places in point coordinates.
newimage = (500, 500, 3)
image = np.zeros(newimage, np.uint8)
# Ellipse
cv2.ellipse(image, (150,150), (150,80), 0, 0, 360, (0, 255, 0), 2)
cv2.ellipse(image, (150,150), (150,80), 60, 0, 360, (0, 255, 0), 2)
# Arc
cv2.ellipse(image, (350,350), (150,80), 180, 0, 180, (0, 255, 0), -1)
cv2.imshow('ellipse', image)
cv2.waitKey(0)
cv2.destroyAllWindows()
4. Draw a circle
- Method
circle(img, center, radius, color, thickness, lineType, shift) - Parameters:
1. img: image;
2. Center: the center of the circle.
3. Radius: circle radius.
4. Color: circle color or brightness (grayscale image).
5. Thickness: contour thickness. Negative, fill.
6. lineType: lineType.
7. Shift: parameter shift of decimal places in point coordinates.
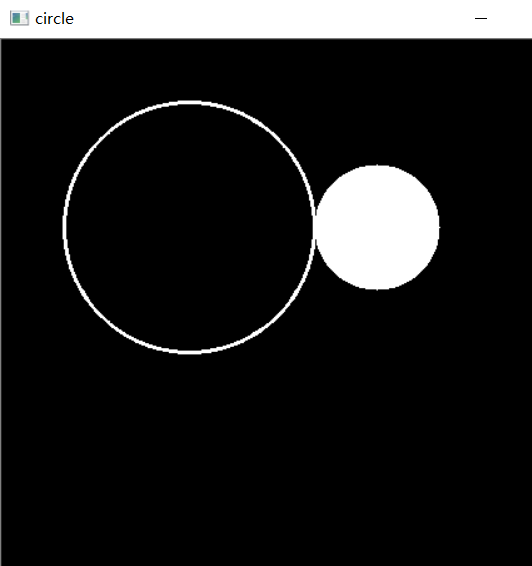
newimage = (500, 500, 3)
image = np.zeros(newimage, np.uint8)
cv2.circle(image, (150,150), 100, (255, 255, 255), 2)
cv2.circle(image, (300,150), 50, (255, 255, 255), -1)
cv2.imshow('circle', image)
cv2.waitKey(0)
cv2.destroyAllWindows()
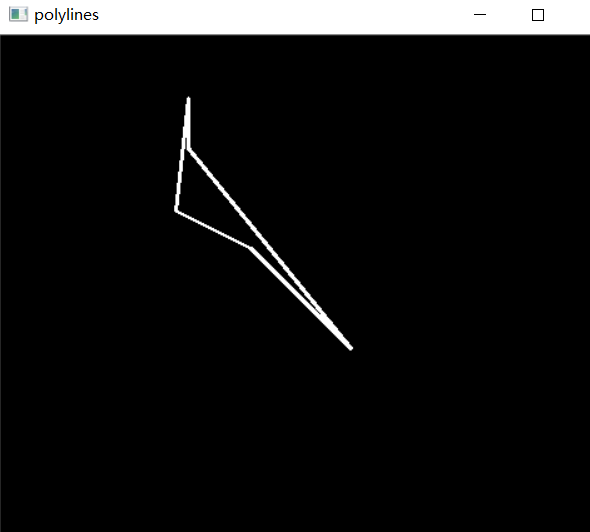
5. Drawing of arbitrary shapes
- Method
cv2.polylines(img, pts, isClosed, color, thickness, lineType, shift) - parameter
1. img: image;
2. pts: an array of polygonal curves.
3. isClosed: indicates whether the drawn polyline is closed.
4. Color: circle color or brightness (grayscale image).
5, Thickness: the thickness of the profile.
6. lineType: lineType.
7. Shift: parameter shift of decimal places in point coordinates.
newimage = (500, 500, 3)
image = np.zeros(newimage, np.uint8)
#Specify points in the drawing
points = np.array([[150, 50], [140, 140], [200, 170], [280, 250],[150, 90], [150,50]], np.int32)
points = points.reshape((-1, 1, 2))
cv2.polylines(image, [points], True, (255, 255, 255), 2)
cv2.imshow('polylines', image)
cv2.waitKey(0)
cv2.destroyAllWindows()