
When we read every pixel value of a picture, we need a useful and fast python library to implement the numpy operation array library. Numpy is usually used to traverse every pixel of a graph. Change the image by modifying the pixels.
We will also introduce some of the numpy operations we use in opencv.
def access_pixels(image):
    print(image.shape)
    height = image.shape[0]
    width = image.shape[1]
    channels = image.shape[2]
    print("width: %s, height: %s, channels:%s"%(width,height,channels))
access_pixels(img)
From the output point of view, it is a three-dimensional matrix, one-dimensional 512 is the width of the image, and the second dimension 512 is the height of the image. Finally, each is a three-dimensional pixel value, representing the BRG of the graph. Note that opencv reads the picture in BRG format instead of RGB format and we need to convert it.
(512, 512, 3)
width: 512, height: 512, channels:3
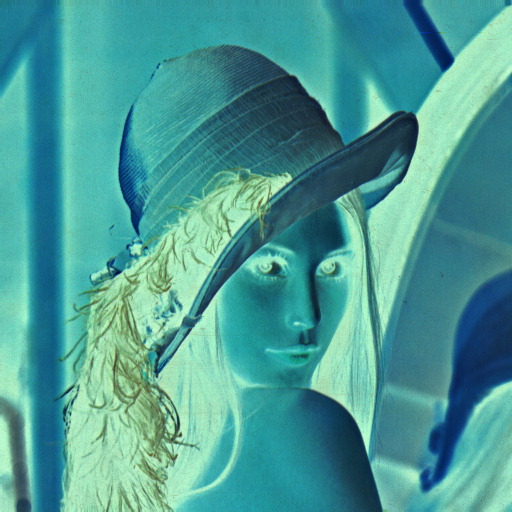
In ps, we retrieve the image by traversing every pixel and subtracting every pixel value from 255. To achieve the effect of anti-color.
def access_pixels(image):
    # print(image.shape)
    height = image.shape[0]
    width = image.shape[1]
    channels = image.shape[2]
    # print("width: %s, height: %s, channels:%s"%(width,height,channels))
    for row in range(height):
        for col in range(width):
            for c in range(channels):
                pv = image[row,col,c]
                image[row,col,c] = 255 -pv
    cv2.imshow('processed',image)
def create_image():
    img = np.zeros([400,400,3],np.uint8)
    cv2.imshow('img',img)
img[:,:,1] = np.ones([400,400])* 255
A green picture appears with a width of 400 and a height of 400, respectively.
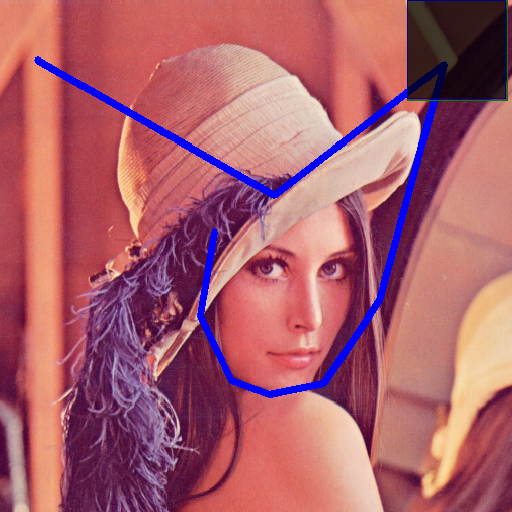
import cv2
import numpy as np

# events = [i for i in dir(cv2) if 'EVENT' in i]
# print(events)

def click_event(event, x, y, flags, param):
    if event == cv2.EVENT_LBUTTONDOWN:
        cv2.circle(img,(x,y), 3, (0,255,0),-1)
        points.append((x,y))
        if len(points) >= 2:
            cv2.line(img,points[-1],points[-2], (255,0,0),5)
        cv2.imshow('image',img)


# img = np.zeros((512,512,3),np.uint8)
img = cv2.imread('lena.jpg')
cv2.imshow('image',img)
points = []
cv2.setMouseCallback('image',click_event)
cv2.waitKey(0)
cv2.destroyAllWindows()
Combining the left mouse button events learned between them, and today's learning to use numpy to get pixels to achieve the effect of drawing lines in an image.
import cv2
import numpy as np

# events = [i for i in dir(cv2) if 'EVENT' in i]
# print(events)

def click_event(event, x, y, flags, param):
    if event == cv2.EVENT_LBUTTONDOWN:

        blue = img[x,y,0]
        green = img[x,y,1]
        red = img[x,y,2]

        cv2.circle(img,(x,y),3,(0,0,255),-1)
        mColorImage = np.zeros((512,512,3),np.uint8)
        mColorImage[:] = [blue,green,red]

        cv2.imshow('color',mColorImage)


# img = np.zeros((512,512,3),np.uint8)
img = cv2.imread('lena.jpg')
cv2.imshow('image',img)
points = []
cv2.setMouseCallback('image',click_event)
cv2.waitKey(0)
cv2.destroyAllWindows()