Catalog
3.1 Line Drawing
3.2 Draw Rectangles
3.3 Draw a circle
3.4 Draw an ellipse
3.5 Draw Polygons
3.6 Add text to the image
python-opencv can realize powerful drawing function. Here, only basic drawing operation is introduced.
Introduction of parameters:
img: the image you want to draw.
Color: the color of the shape. In the case of RGB, you need to pass in a tuple, such as (255, 0, 0) for blue. For grayscale images, only grayscale values need to be passed in.
Thickness: the thickness of the line. If a closed graph is set to - 1, the graph will be filled in. The default value is 1.
linetype: Line type, 8 connections, anti-aliasing, etc. The default is 8 connections. cv2.LINE_AA
For anti-aliasing, it will look very smooth.
3.1 Line Drawing
First of all, to create an environment for drawing lines, we need to generate an empty black background image.
1.img=np.zeros((512,512,3), np.uint8)
This is the black bottom, our canvas. I call the window img = np.zeros() with two parameters. One is the size of the image matrix created, the other is the data type 512, 512 is the pixel (the first 512 pixel is high, the second is 512 pixel wide), and the third is that the three BGR colors uint8 represent all colors in 0-255.
Function: cv2.line(img,(0,0),(511,511),(255,0,0),5)
This function has five parameters, img is the image name, starting coordinates, end coordinates, (255, 0, 0) is blue, 5 is the width of the line will draw a blue line segment from the upper left to the lower right corner. Drawing line has two elements: starting point and ending point.
3.2 Draw Rectangles
Function: cv2.rectangle(img,(384,0),(510,128),(0,255,0),3)
This function has five parameters, image name, upper left vertex coordinate, lower right vertex coordinate, (0,255,0) is green, line width is 3 upper right corner draw a green rectangle. Draw two elements of a rectangle: the coordinates of the upper left vertex and the lower right vertex.
3.3 Draw a circle
Functions: cv2.circle(img,(447,63), 63, (0,0,255), -1)
This function has five parameters, image name, center coordinates, radius 63, (0, 0, 255) red, line width - 1, when line width - 1, it represents the color filling of closed graphics. Draw a circle in the drawing rectangle with a radius of 128. Draw a circle with two elements: specify the coordinates of the center point of the circle and the radius size.
3.4 Draw an ellipse
Function: cv2.ellipse(img,(256,256),(100,50),0,0,180,255,-1)
This function has eight parameters: image name, center coordinates, length of long axis, length of short axis, rotation angle, part of the image appearing (angle of beginning and end of long axis clockwise direction) 0,180 is the lower half ellipse, color array here 255 is blue, line width. Elliptic elements: 1. the coordinates of the central point; 2. the length of the long axis and the short axis; 3. the angle of the ellipse rotating counterclockwise; 4. the angle of the beginning and the end of the long axis clockwise.
3.5 Draw Polygons
pts = np.array([[10,5],[20,30],[70,20],[50,10]], np.int32)
pts = pts.reshape((-1,1,2))
img = cv2.polylines(img,[pts],True,(0,255,255),3)
This function has five parameters: image name, vertex list (this polygon has four vertices in array), True denotes closure, (0,255,255) is yellow, and 3 is line width.
Note: If the third parameter is False, the polygon we get is not closed (the end is not connected).
Note: cv2.polylines() can be used to draw many lines. Just put the lines you want to draw in a list and pass the list to the function. Each line is drawn independently. This will be faster than drawing one by one with cv2.line().
3.6 Add text to the image
font=cv2.FONT_HERSHEY_SIMPLEX
cv2.putText(img,'OpenCV',(10,500), font, 4,(255,255,255),2)
This function has eight parameters, image name, string, coordinates, font, font size, (255, 255, 255) white, line width 2.
Warning: The drawing function returns None, so img = cv2. line (img, (0, 0), (511, 511), (255, 0, 0), 5 cannot be used.
The code is as follows:
import numpy as np
import cv2
# Create a black background
img = np.zeros((512,512,3), np.uint8)
# Draw a diagonal blue line with a width of 5.
img = cv2.line(img,(0,0),(511,511),(255,0,0),5)
img = cv2.rectangle(img,(384,0),(510,128),(0,255,0),3)
img = cv2.circle(img,(447,63), 63, (0,0,255), -1)
#img = cv2.ellipse(img,(256,256),(100,50),0,0,180,255,-1)
img = cv2.ellipse(img,(256,256),(100,50),0,30,210,255,-1)
pts = np.array([[10,5],[20,30],[70,20],[50,10]], np.int32)
pts = pts.reshape((-1,1,2))
img = cv2.polylines(img,[pts],True,(0,255,255),1,cv2.LINE_AA)
font = cv2.FONT_HERSHEY_SIMPLEX
cv2.putText(img,'Hello,OpenCV',(10,500), font, 1,(255,255,255),2,cv2.LINE_AA)
cv2.imshow('image',img)
cv2.waitKey(0)
cv2.destroyAllWindows()
The results are as follows: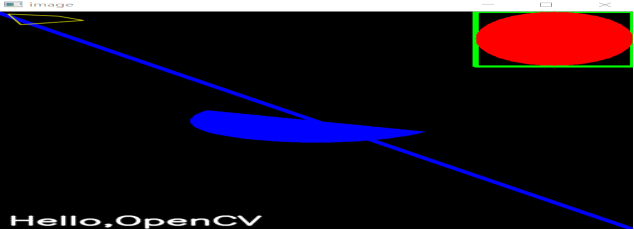
At the same time, another version of the black oil program, code as follows:
import numpy as np
import cv2

# Define a canvas 600 wide and 400 high, initialized to white
canvas = np.zeros((400, 600, 3), dtype=np.uint8) + 255

# Draw a vertical and central black line.
cv2.line(canvas, (300, 0), (300, 399), (0, 0, 0), 2)

# Draw a horizontal dividing line with 150 on the right half of the picture
cv2.line(canvas, (300, 149), (599, 149), (0, 0, 0), 2)

# Draw a red circle in the lower right corner of the left half.
cv2.circle(canvas, (200, 300), 75, (0, 0, 255), 5)

# Draw a blue rectangle in the lower left corner of the left half
cv2.rectangle(canvas, (20, 240), (100, 360), (255, 0, 0), thickness=3)

# Define two triangles and perform internal green filling
triangles = np.array([
    [(200, 240), (145, 333), (255, 333)],
    [(60, 180), (20, 237), (100, 237)]])
cv2.fillPoly(canvas, triangles, (0, 255, 0))

# Draw a yellow Pentagon
# The first step is to find five vertices by rotating the angle.
phi = 4 * np.pi / 5
rotations = [[[np.cos(i * phi), -np.sin(i * phi)], [i * np.sin(phi), np.cos(i * phi)]] for i in range(1, 5)]
pentagram = np.array([[[[0, -1]] + [np.dot(m, (0, -1)) for m in rotations]]], dtype=np.float)

# Define scaling multiples and translation vectors to draw the Pentagon above the left half of the picture
pentagram = np.round(pentagram * 80 + np.array([160, 120])).astype(np.int)

# Five vertices are connected as vertices of a polygon to get a pentagonal star
cv2.polylines(canvas, pentagram, True, (0, 255, 255), 9)

# Continuous hue changes in HSV space are drawn from left to right at intervals of pixels above the right half of the screen.
for x in range(302, 600):
    color_pixel = np.array([[[round(180*float(x-302)/298), 255, 255]]], dtype=np.uint8)
    line_color = [int(c) for c in cv2.cvtColor(color_pixel, cv2.COLOR_HSV2BGR)[0][0]]
    cv2.line(canvas, (x, 0), (x, 147), line_color)

# If the line width of a circle is greater than half a kilogram, it is equivalent to drawing a circle point and generating coordinates randomly in the frame of the lower right corner of the picture.
np.random.seed(42)
n_pts = 30
pts_x = np.random.randint(310, 590, n_pts)
pts_y = np.random.randint(160, 390, n_pts)
pts = zip(pts_x, pts_y)

# Draw each point with random colors
for pt in pts:
    pt_color = [int(c) for c in np.random.randint(0, 255, 3)]
    cv2.circle(canvas, pt, 3, pt_color, 5)

# Print text at the top of the left half
cv2.putText(canvas,
            'Python-OpenCV Drawing Example',
            (5, 15),
            cv2.FONT_HERSHEY_SIMPLEX,
            0.5,
            (0, 0, 0),
            1)

cv2.imshow('Example of basic drawing functions', canvas)
cv2.waitKey()