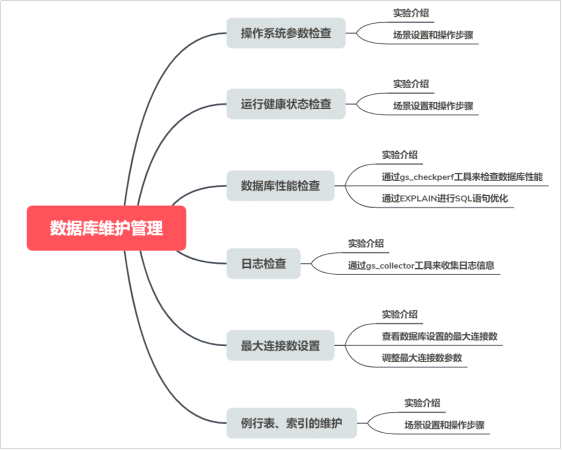
brief introduction
This experiment is applicable to openGauss database. Through this experiment, we can successfully complete the daily basic maintenance and management of the database. The main contents include operating system parameter inspection, openGauss health status inspection, database performance inspection, log inspection and cleaning, time consistency inspection, application connection number inspection, routine maintenance table, etc.
Preconditions
- Since this experiment mainly carries out database maintenance and management on the openEuler operating system, you need to master the basic operation and system commands of Linux system. For details, see Appendix I.
- Database maintenance and management, especially the maintenance of routine tables and indexes, need to master the basic operation and SQL syntax of openGauss database. openGauss database supports SQL2003 standard syntax. See for the basic operation of database Appendix II.
Description of experimental environment
Networking Description: the experimental environment is Huawei cloud ECS server + openGauss database.
Equipment introduction: in order to meet the experimental needs of database principle and practice course, it is recommended that each set of experimental environment adopt the following configuration:
| Equipment name | Equipment model | Software version |
|---|---|---|
| database | openGauss | openGauss 1.1.0 |
| operating system | openEuler | openEuler 20.3LTS |
Experiment overview:
1. Operating system parameter check
1.1 introduction to experiment
1.1.1 about this experiment
gs_checkos tool is used to help check the operating system, control parameters, disk configuration and other contents, and configure the system control parameters, I/O configuration, network configuration, THP service and other information.
This experiment is mainly through GS_ Check OS tool to check whether the operating system parameter setting is reasonable. Set the scene first, and then adjust the parameters according to the inspection results.
1.1.2 experimental purpose
Master GS_ Basic use of checkos tool;
1.2 scene setting and operation steps
Step 1 log in the operating system equipped with openGauss database service with root user. The login information is as follows:
Welcome to 4.19.90-2003.4.0.0036.oe1.aarch64
System information as of time: 	Mon Jul 20 16:41:11 CST 2020
System load: 	0.00
Processes: 	113
Memory used: 	7.0%
Swap used: 	0.0%
Usage On: 	15%
IP address: 	192.168.0.96
Users online: 	2
[root@ecs-e1b3 ~]#
Step 2 execute GS under root_ Checkos checks the system parameters first.
 [root@ecs-e1b3 ~]# gs_checkos -i A
Checking items:
    A1. [ OS version status ]                                   : Normal
    A2. [ Kernel version status ]                               : Normal
    A3. [ Unicode status ]                                      : Normal
    A4. [ Time zone status ]                                    : Normal
    A5. [ Swap memory status ]                                  : Normal
    A6. [ System control parameters status ]                    : Warning
    A7. [ File system configuration status ]                    : Normal
    A8. [ Disk configuration status ]                           : Normal
    A9. [ Pre-read block size status ]                          : Normal
    A10.[ IO scheduler status ]                                 : Normal
BondMode Null
    A11.[ Network card configuration status ]                   : Warning
    A12.[ Time consistency status ]                             : Warning
    A13.[ Firewall service status ]                             : Normal
    A14.[ THP service status ]                                  : Normal
Total numbers:14. Abnormal numbers:0. Warning numbers:3.
Notes:
Normal is a normal item, Abnormal is an item that must be processed, and Warning can not be processed.
Total numbers:14. Abnormal numbers:0. Warning numbers:3.
Indicates: 14 items are checked in total, of which Abnormal must be processed item is 0 and Warning alarm item is 3.
Step 3 adjust the system parameter value.
In the parameter configuration file (/ etc/sysctl.conf), set the parameter VM min_ free_ The value of Kbytes (indicating the amount of memory reserved for kernel memory allocation) is adjusted to 3488. Enter "i" to enter the INSERT mode and modify it.
[root@ecs-e1b3 ~]# vi /etc/sysctl.conf
net.ipv4.conf.default.accept_redirects=0
net.ipv4.conf.all.secure_redirects=0
net.ipv4.conf.default.secure_redirects=0
net.ipv4.icmp_echo_ignore_broadcasts=1
net.ipv4.icmp_ignore_bogus_error_responses=1
...............
net.ipv4.tcp_rmem = 8192 250000 16777216
net.ipv4.tcp_wmem = 8192 250000 16777216
vm.min_free_kbytes = 3488
net.core.netdev_max_backlog = 65535
net.ipv4.tcp_max_syn_backlog = 65535
net.core.somaxconn = 65535
After the parameter value is modified, press "ESC" to exit the editing mode, then enter: wq and press enter to save. Then execute the sysctl -p command to make the parameters just modified effective, as follows:
[root@ecs-e1b3 ~]# sysctl -p
kernel.sysrq = 0
net.ipv4.ip_forward = 0
net.ipv4.conf.all.send_redirects = 0
net.ipv4.conf.default.send_redirects = 0
net.ipv4.conf.all.accept_source_route = 0
net.ipv4.conf.default.accept_source_route = 0
net.ipv4.conf.all.accept_redirects = 0
net.ipv4.conf.default.accept_redirects = 0
..............
net.core.rmem_default = 21299200
net.sctp.sctp_mem = 94500000 915000000 927000000
net.sctp.sctp_rmem = 8192 250000 16777216
net.sctp.sctp_wmem = 8192 250000 16777216
kernel.sem = 250 6400000 1000 25600
net.ipv4.tcp_rmem = 8192 250000 16777216
net.ipv4.tcp_wmem = 8192 250000 16777216
vm.min_free_kbytes = 3488
net.core.netdev_max_backlog = 65535
net.ipv4.tcp_max_syn_backlog = 65535
net.core.somaxconn = 65535
kernel.shmall = 1152921504606846720
kernel.shmmax = 18446744073709551615
Step 4 and then perform gs_checkos checks the system parameters.
[root@ecs-e1b3 ~]# gs_checkos -i A
Checking items:
    A1. [ OS version status ]                                   : Normal
    A2. [ Kernel version status ]                               : Normal
    A3. [ Unicode status ]                                      : Normal
    A4. [ Time zone status ]                                    : Normal
    A5. [ Swap memory status ]                                  : Normal
    A6. [ System control parameters status ]                    : Abnormal
    A7. [ File system configuration status ]                    : Normal
    A8. [ Disk configuration status ]                           : Normal
    A9. [ Pre-read block size status ]                          : Normal
    A10.[ IO scheduler status ]                                 : Normal
BondMode Null
    A11.[ Network card configuration status ]                   : Warning
    A12.[ Time consistency status ]                             : Warning
    A13.[ Firewall service status ]                             : Normal
    A14.[ THP service status ]                                  : Normal
Total numbers:14. Abnormal numbers:1. Warning numbers:2.
Do checking operation finished. Result: Abnormal.
A6 The status of [system control parameters status] is Abnormal and must be processed;
Total numbers:14. Abnormal numbers:1. Warning numbers:2.
Indicates: a total of 14 items are checked, of which Abnormal must be processed item is 1 and Warning alarm item is 2.
Step 5 by executing gs_checkos -i A --detail view more details.
[root@ecs-e1b3 ~]# gs_checkos -i A --detail
Checking items:
    A1. [ OS version status ]                                   : Normal
        [ecs-e1b3]
        openEuler_20.03_64bit
     A2. [ Kernel version status ]                               : Normal
        The names about all kernel versions are same. The value is "4.19.90-2003.4.0.0036.oe1.aarch64".
    A3. [ Unicode status ]                                      : Normal
        The values of all unicode are same. The value is "LANG=en_US.UTF-8".
    A4. [ Time zone status ]                                    : Normal
        The informations about all timezones are same. The value is "+0800".
    A5. [ Swap memory status ]                                  : Normal
        The value about swap memory is correct.
    A6. [ System control parameters status ]                    : Abnormal
        [ecs-e1b3]
        Abnormal reason: variable 'vm.min_free_kbytes' RealValue '3488' ExpectedValue '348844'.
        Warning reason: variable 'net.ipv4.tcp_retries1' RealValue '3' ExpectedValue '5'.
        Warning reason: variable 'net.ipv4.tcp_syn_retries' RealValue '6' ExpectedValue '5'.
        Warning reason: variable 'net.sctp.path_max_retrans' RealValue '5' ExpectedValue '10'.
        Warning reason: variable 'net.sctp.max_init_retransmits' RealValue '8' ExpectedValue '10'.
        Check_SysCtl_Parameter failed.
    A7. [ File system configuration status ]                    : Normal
        Both soft nofile and hard nofile are correct.
    A8. [ Disk configuration status ]                           : Normal
        The value about XFS mount parameters is correct.
    A9. [ Pre-read block size status ]                          : Normal
        The value about Logical block size is correct.
    A10.[ IO scheduler status ]                                 : Normal
        The value of IO scheduler is correct.
BondMode Null
    A11.[ Network card configuration status ]                   : Warning
        [ecs-e1b3]
BondMode Null
        Warning reason: Failed to obtain the network card speed value. Maybe the network card "eth0" is not working.
    A12.[ Time consistency status ]                             : Warning
        [ecs-e1b3]
        The NTPD not detected on machine and local time is "2020-07-20 17:16:41".
    A13.[ Firewall service status ]                             : Normal
        The firewall service is stopped.
    A14.[ THP service status ]                                  : Normal
        The THP service is stopped.
Total numbers:14. Abnormal numbers:1. Warning numbers:2.
Do checking operation finished. Result: Abnormal.
In the detailed information, it can be clearly seen that there are problems in the setting of those parameters, and the reference values for the modification of the problem parameters are given as follows:
A6. [ System control parameters status ] : Abnormal
[ecs-e1b3]
Abnormal reason: variable 'vm.min_free_kbytes' RealValue '3488' ExpectedValue '348844'.
Warning reason: variable 'net.ipv4.tcp_retries1' RealValue '3' ExpectedValue '5'.
Warning reason: variable 'net.ipv4.tcp_syn_retries' RealValue '6' ExpectedValue '5'.
Warning reason: variable 'net.sctp.path_max_retrans' RealValue '5' ExpectedValue '10'.
Warning reason: variable 'net.sctp.max_init_retransmits' RealValue '8' ExpectedValue '10'.
Check_SysCtl_Parameter failed.
Step 6 modify the system parameters according to the modification instructions in the details.
vm. min_ free_ The value of Kbytes is adjusted from 3488 to 348844
net. ipv4. tcp_ The value of retries1 is adjusted from 3 to 5
net. ipv4. tcp_ syn_ The value of retries is adjusted from 6 to 5
net. sctp. path_ max_ The value of retrans is adjusted from 5 to 10
net. sctp. max_ init_ The value of retransmits is adjusted from 8 to 10
The specific settings are as follows:
vm.min_free_kbytes = 348844
net.ipv4.tcp_retries1 = 5
net.ipv4.tcp_syn_retries = 5
net.sctp.path_max_retrans = 10
net.sctp.max_init_retransmits = 10
Modify in the system parameter file (enter "i" to enter the INSERT mode and modify.):
[root@ecs-e1b3 ~]# vi /etc/sysctl.conf
# sysctl settings are defined through files in
# /usr/lib/sysctl.d/, /run/sysctl.d/, and /etc/sysctl.d/.
#
# Vendors settings live in /usr/lib/sysctl.d/.
# To override a whole file, create a new file with the same in
# /etc/sysctl.d/ and put new settings there. To override
# only specific settings, add a file with a lexically later
# name in /etc/sysctl.d/ and put new settings there.
#
# For more information, see sysctl.conf(5) and sysctl.d(5).
kernel.sysrq=0
net.ipv4.ip_forward=0
net.ipv4.conf.all.send_redirects=0
net.ipv4.conf.default.send_redirects=0
net.ipv4.conf.all.accept_source_route=0
net.ipv4.conf.default.accept_source_route=0
net.ipv4.conf.all.accept_redirects=0
# /etc/sysctl.d/ and put new settings there. To override
# only specific settings, add a file with a lexically later
# name in /etc/sysctl.d/ and put new settings there.
#
# For more information, see sysctl.conf(5) and sysctl.d(5).
kernel.sysrq=0
net.ipv4.ip_forward=0
net.ipv4.conf.all.send_redirects=0
net.ipv4.conf.default.send_redirects=0
net.ipv4.conf.all.accept_source_route=0
net.ipv4.conf.default.accept_source_route=0
..............
net.sctp.sctp_rmem = 8192 250000 16777216
net.sctp.sctp_wmem = 8192 250000 16777216
kernel.sem = 250 6400000 1000 25600
net.ipv4.tcp_rmem = 8192 250000 16777216
net.ipv4.tcp_wmem = 8192 250000 16777216
vm.min_free_kbytes = 348844
net.core.netdev_max_backlog = 65535
net.ipv4.tcp_max_syn_backlog = 65535
net.core.somaxconn = 65535
kernel.shmall = 1152921504606846720
kernel.shmmax = 18446744073709551615
net.ipv4.tcp_retries1 = 5
net.ipv4.tcp_syn_retries = 5
net.sctp.path_max_retrans = 10
net.sctp.max_init_retransmits = 10
After the parameter value is modified, press "ESC" to exit the editing mode, then enter: wq and press enter to save. Then execute the sysctl -p command to make the parameters just modified effective, as follows:
[root@ecs-e1b3 ~]# sysctl -p
kernel.sysrq = 0
net.ipv4.ip_forward = 0
net.ipv4.conf.all.send_redirects = 0
net.ipv4.conf.default.send_redirects = 0
net.ipv4.conf.all.accept_source_route = 0
net.ipv4.conf.default.accept_source_route = 0
net.ipv4.conf.all.accept_redirects = 0
net.ipv4.conf.default.accept_redirects = 0
net.ipv4.conf.all.secure_redirects = 0
net.ipv4.conf.default.secure_redirects = 0
net.ipv4.icmp_echo_ignore_broadcasts = 1
net.ipv4.icmp_ignore_bogus_error_responses = 1
net.ipv4.conf.all.rp_filter = 1
net.ipv4.conf.default.rp_filter = 1
net.ipv4.tcp_syncookies = 1
kernel.dmesg_restrict = 1
net.ipv6.conf.all.accept_redirects = 0
net.ipv6.conf.default.accept_redirects = 0
vm.swappiness = 0
net.ipv4.tcp_max_tw_buckets = 10000
net.ipv4.tcp_tw_reuse = 1
................
net.ipv4.tcp_rmem = 8192 250000 16777216
net.ipv4.tcp_wmem = 8192 250000 16777216
vm.min_free_kbytes = 348844
net.core.netdev_max_backlog = 65535
net.ipv4.tcp_max_syn_backlog = 65535
net.core.somaxconn = 65535
kernel.shmall = 1152921504606846720
kernel.shmmax = 18446744073709551615
net.ipv4.tcp_retries1 = 5
net.ipv4.tcp_syn_retries = 5
net.sctp.path_max_retrans = 10
net.sctp.max_init_retransmits = 10
Step 7 again by executing gs_checkos -i A checks whether the system parameter check can pass.
[root@ecs-e1b3 ~]# gs_checkos -i A
Checking items:
    A1. [ OS version status ]                                   : Normal
    A2. [ Kernel version status ]                               : Normal
    A3. [ Unicode status ]                                      : Normal
    A4. [ Time zone status ]                                    : Normal
    A5. [ Swap memory status ]                                  : Normal
    A6. [ System control parameters status ]                    : Normal
    A7. [ File system configuration status ]                    : Normal
    A8. [ Disk configuration status ]                           : Normal
    A9. [ Pre-read block size status ]                          : Normal
    A10.[ IO scheduler status ]                                 : Normal
BondMode Null
    A11.[ Network card configuration status ]                   : Warning
    A12.[ Time consistency status ]                             : Warning
    A13.[ Firewall service status ]                             : Normal
    A14.[ THP service status ]                                  : Normal
Total numbers:14. Abnormal numbers:0. Warning numbers:2.
It can be seen from the inspection results that the system parameter inspection has passed. Including A6 The status of [system control parameters status] changes from Abnormal to Normal.
The operating system parameter check experiment is over.
2.openGauss operation health status check
2.1 experimental introduction
2.1.1 about this experiment
gs_check can help users fully check the openGauss operating environment, operating system environment, network environment and database execution environment during the operation of openGauss. It also helps to comprehensively check all kinds of environments before major openGauss operations, so as to effectively ensure the successful operation.
This experiment is mainly through gs_check tool to check the running status of openGauss database. First set the scene, and then adjust the database according to the inspection results.
The syntax is as follows:
- Single inspection:
gs_check -i ITEM [...] [-U USER] [-L] [-l LOGFILE] [-o OUTPUTDIR] [--skip-root-items][--set][--routing]
- Scene check:
gs_check -e SCENE_NAME [-U USER] [-L] [-l LOGFILE] [-o OUTPUTDIR] [--hosts] [--skip-root-items] [--time-out=SECS][--set][--routing][--skip-items]
Scene check item. The default scenarios are inspect, upgrade and binary_upgrade (local pre upgrade inspection), health (health inspection inspection inspection), install (installation), etc. users can write their own scenarios according to their needs.
- Displays help information.
gs_check -? | --help
2.1.2 experimental purpose
Master GS_ Basic use of check tool;
2.2 scene setting and operation steps
Step 1 log in the operating system equipped with openGauss database service with root user, and then switch to the omm user environment with su - omm command. The login information is as follows.
Welcome to 4.19.90-2003.4.0.0036.oe1.aarch64
System information as of time: 	Tue Jul 21 09:21:11 CST 2020
System load: 	0.01
Processes: 	109
Memory used: 	6.7%
Swap used: 	0.0%
Usage On: 	15%
IP address: 	192.168.0.96
Users online: 	1
[root@ecs-e1b3 ~]# su - omm
Last login: Fri Jul 10 19:05:39 CST 2020 on pts/0
Welcome to 4.19.90-2003.4.0.0036.oe1.aarch64
System information as of time: 	Tue Jul 21 09:21:25 CST 2020
System load: 	0.01
Processes: 	111
Memory used: 	7.0%
Swap used: 	0.0%
Usage On: 	15%
IP address: 	192.168.0.96
Users online: 	1
[omm@ecs-e1b3 ~]$
Step 2 confirm whether the openGauss database service is started.
[omm@ecs-e1b3 ~]$ gs_om -t status;
----------------------------------------------------------------------
cluster_state   : Normal
redistributing  : No
----------------------------------------------------------------------
cluster_ State: Normal indicates that it has been started and can be used normally. If the status is non Normal, it means unavailable
In order to set the experimental scenario, if the database service has been started, please perform step 3 to close the service first.
Step 3 close the openGauss database service.
[omm@ecs-e1b3 ~]$ gs_om -t stop;
Stopping cluster.
=========================================
Successfully stopped cluster.
=========================================
End stop cluster.
Step 4 check the openGauss instance connection.
[omm@ecs-e1b3 ~]$ gs_check -i CheckDBConnection
Parsing the check items config file successfully
Distribute the context file to remote hosts successfully
Start to health check for the cluster. Total Items:1 Nodes:1

Checking...               [=========================] 1/1
Start to analysis the check result
CheckDBConnection...........................NG
The item run on 1 nodes.  ng: 1
The ng[ecs-e1b3] value:
The database can not be connected.

Analysis the check result successfully
Failed.	All check items run completed. Total:1     NG:1
For more information please refer to /opt/huawei/wisequery/script/gspylib/inspection/output/CheckReport_2020072139449163171.tar.gz
explain:
CheckDBConnection... NG indicates that the connection check item is useless;
The database can not be connected. Indicates that the instance cannot be connected;
Failed. All check items run completed. Total:1 NG:1 means 1 item is inspected and the inspection result is not passed.
Step 5 start the openGauss database service.
[omm@ecs-e1b3 ~]$ gs_om -t start;
Starting cluster.
=========================================
=========================================
Successfully started.
[omm@ecs-e1b3 ~]$
Step 6 confirm that the openGauss database service has been started.
[omm@ecs-e1b3 ~]$ gs_om -t status;
----------------------------------------------------------------------
cluster_state   : Normal
redistributing  : No
----------------------------------------------------------------------
[omm@ecs-e1b3 ~]$
Step 7 check the openGauss instance connection again.
[omm@ecs-e1b3 ~]$ gs_check -i CheckDBConnection
Parsing the check items config file successfully
Distribute the context file to remote hosts successfully
Start to health check for the cluster. Total Items:1 Nodes:1

Checking...               [=========================] 1/1
Start to analysis the check result
CheckDBConnection...........................OK
The item run on 1 nodes.  success: 1

Analysis the check result successfully
Success.	All check items run completed. Total:1   Success:1
For more information please refer to /opt/huawei/wisequery/script/gspylib/inspection/output/CheckReport_2020072140672174672.tar.gz
explain:
CheckDBConnection... OK indicates that the connection check item is normal;
Success. All check items run completed. Total:1 Success:1 indicates that a total of 1 item is checked and the inspection result is successful.
openGauss database running health check experiment ended.
3. Database performance inspection
3.1 experimental introduction
3.1.1 about this experiment
openGauss not only provides_ Checkperf tool to help users understand the load of openGauss.
This experiment is mainly through GS_ Check perf tool to check the performance of openGauss database and optimize SQL statements through EXPLAIN.
3.1.2 experimental purpose
Master GS_ Basic use of checkperf tool;
3.2 passing GS_ Check perf tool to check database performance
explain:
gs_checkperf can check the following levels:
- openGauss level (host CPU usage, Gauss CPU usage, I/O usage, etc.)
- Node level (CPU usage, memory usage, I/O usage)
- Session / process level (CPU usage, memory usage, I/O usage)
- SSD performance (write, read performance)
Check the SSD performance with the root user, and check the openGauss performance with the openGauss installation user
This experiment is to check the performance of openGauss.
Step 1 log in the operating system equipped with openGauss database service with root user, and then switch to the omm user environment with su - omm command. The login information is as follows.
Welcome to 4.19.90-2003.4.0.0036.oe1.aarch64
System information as of time: 	Tue Jul 21 09:21:11 CST 2020
System load: 	0.01
Processes: 	109
Memory used: 	6.7%
Swap used: 	0.0%
Usage On: 	15%
IP address: 	192.168.0.96
Users online: 	1
[root@ecs-e1b3 ~]# su - omm
Last login: Fri Jul 10 19:05:39 CST 2020 on pts/0
Welcome to 4.19.90-2003.4.0.0036.oe1.aarch64
System information as of time: 	Tue Jul 21 09:21:25 CST 2020
System load: 	0.01
Processes: 	111
Memory used: 	7.0%
Swap used: 	0.0%
Usage On: 	15%
IP address: 	192.168.0.96
Users online: 	1
[omm@ecs-e1b3 ~]$
Step 2 start the database service first, and then use GS_ Check perf, and then use the gsql client to connect to the postgres database as an administrator user, assuming that the port number is 26000.
Start the database service first.
[omm@ecs-e1b3 ~]$ gs_om -t start;
Starting cluster.
=========================================
=========================================
Successfully started.
use gs_checkperf Check.
[omm@ecs-e1b3 ~]$ gs_checkperf
Cluster statistics information:
    Host CPU busy time ratio                     :    .72        %
    MPPDB CPU time % in busy time                :    .33        %
    Shared Buffer Hit ratio                      :    97.33      %
    In-memory sort ratio                         :    0
    Physical Reads                               :    466
    Physical Writes                              :    175
    DB size                                      :    47         MB
    Total Physical writes                        :    175
    Active SQL count                             :    3
Session count                                :    4
Confirm whether openGauss database service is normal.
[omm@ecs-e1b3 ~]$ gs_om -t status;
----------------------------------------------------------------------
cluster_state   : Unavailable
redistributing  : No
----------------------------------------------------------------------
cluster_ State: normal indicates that it has been started and can be used normally. If the status is Unavailable, it means Unavailable
In order to continue the experiment, please start the database service first.
Start the database service (this step can be omitted if the database service is normal).
[omm@ecs-e1b3 ~]$ gs_om -t start;
Starting cluster.
=========================================
=========================================
Successfully started.
Then connect to the postgres database.
[omm@ecs-e1b3 ~]$ gsql -d postgres -p 26000 -r
gsql ((openGauss 1.1.0 build 38a9312a) compiled at 2020-05-27 14:57:08 commit 472 last mr 549 )
Non-SSL connection (SSL connection is recommended when requiring high-security)
Type "help" for help.

postgres=#
Step 3: collect the statistical information of the table in PMK mode.
postgres=# analyze pmk.pmk_configuration;
ANALYZE
postgres=# analyze pmk.pmk_meta_data;
ANALYZE
postgres=# analyze pmk.pmk_snapshot;
ANALYZE
postgres=# analyze pmk.pmk_snapshot_datanode_stat;
ANALYZE
postgres=#
explain:
gs_ The monitoring information of checkperf tool depends on the data of the table in pmk mode. If the table in pmk mode does not perform the analyze operation, it may cause gs_checkperf tool execution failed.
Step 4 perform a brief performance check.
Use \ q to exit the postgres database first, and then execute GS in the operating system user omm environment_ Checkperf check tool, as follows:
postgres=#
postgres=# \q
[omm@ecs-e1b3 ~]$ gs_checkperf
Cluster statistics information:
    Host CPU busy time ratio           :    1.66      % -----host CPU Occupancy rate
    MPPDB CPU time % in busy time     :    2.51      % ----Gauss CPU Occupancy rate
    Shared Buffer Hit ratio             :    99.14    % ----Shared memory hit rate
    In-memory sort ratio                 :    0            ---In memory sort ratio
    Physical Reads                        :    504           ---Physical reading times
    Physical Writes                       :    162           ---Physical write times
    DB size                                 :    57         MB ---DB size
    Total Physical writes               :    162         ---Total physical writes
    Active SQL count                     :    4             ---current SQL Number of executions
    Session count                         :    5             ---Session quantity
Step 5 perform a detailed performance check.
[omm@ecs-e1b3 ~]$ gs_checkperf --detail
Cluster statistics information:
Host CPU usage rate:
    Host total CPU time                          :    45719980.000 Jiffies
    Host CPU busy time                           :    761060.000 Jiffies
    Host CPU iowait time                         :    6640.000   Jiffies
    Host CPU busy time ratio                     :    1.66       %
    Host CPU iowait time ratio                   :    .01        %
MPPDB CPU usage rate:
    MPPDB CPU time % in busy time                :    5.12       %
    MPPDB CPU time % in total time               :    .09        %
Shared buffer hit rate:
    Shared Buffer Reads                          :    1057
    Shared Buffer Hits                           :    139798
    Shared Buffer Hit ratio                      :    99.25      %
In memory sort rate:
    In-memory sort count                         :    0
    In-disk sort count                           :    0
    In-memory sort ratio                         :    0
I/O usage:
    Number of files                              :    106
    Physical Reads                               :    584
    Physical Writes                              :    362
    Read Time                                    :    5794       ms
    Write Time                                   :    4046       ms
Disk usage:
    DB size                                      :    57         MB
    Total Physical writes                        :    362
    Average Physical write                       :    89471.08
    Maximum Physical write                       :    362
Activity statistics:
    Active SQL count                             :    4
    Session count                                :    5
Node statistics information:
dn_6001:
    MPPDB CPU Time                               :    38960      Jiffies
    Host CPU Busy Time                           :    761060     Jiffies
    Host CPU Total Time                          :    45719980   Jiffies
    MPPDB CPU Time % in Busy Time                :    5.12       %
    MPPDB CPU Time % in Total Time               :    .09        %
    Physical memory                              :    7144341504 Bytes
    DB Memory usage                              :    14922285056 Bytes
    Shared buffer size                           :    1073741824 Bytes
    Shared buffer hit ratio                      :    99.25      %
    Sorts in memory                              :    0
    Sorts in disk                                :    0
    In-memory sort ratio                         :    0
    Number of files                              :    106
    Physical Reads                               :    584
    Physical Writes                              :    362
    Read Time                                    :    5794
    Write Time                                   :    4046
Session statistics information(Top 10):
Session CPU statistics:
1 dn_6001-postgres-omm:
    Session CPU time                             :    2
    Database CPU time                            :    39020
    Session CPU time %                           :    .01        %
...............
Session Memory statistics:
1 dn_6001-postgres-omm:
    Buffer Reads                                 :    1309
    Shared Buffer Hit ratio                      :    93.03
    In Memory sorts                              :    0
    In Disk sorts                                :    0
    In Memory sorts ratio                        :    0
    Total Memory Size                            :    7433136
    Used Memory Size                             :    6443268
....................
Session IO statistics:
1 dn_6001-postgres-omm:
    Physical Reads                               :    98
    Read Time                                    :    1069
2 dn_6001-postgres-omm:
    Physical Reads                               :    13
    Read Time                                    :    173
..................
[omm@ecs-e1b3 ~]$
gs_ The checkperf check experiment is over.
3.3 SQL statement optimization through EXPLAIN
explain:
- Use explain to display the execution plan of SQL statement;
- The execution plan will show the scanning methods of the tables referenced by the SQL statement, such as simple sequential scanning, index scanning, etc. If multiple tables are referenced, the execution plan will also display the JOIN algorithm used;
- The most critical part of the execution plan is the estimated execution cost of the statement, which is how long the plan generator estimates the execution time of the statement;
- If the ANALYZE option is specified, the statement simulates execution and forms an optimal execution plan (not real execution), and then displays statistics according to the actual operation results, including the total time overhead in each plan node (in milliseconds) and the number of actually returned total rows. This is very useful for judging whether the estimate of the plan generator is close to reality.
Step 1 log in the operating system equipped with openGauss database service with root user, and then switch to the omm user environment with su - omm command. The login information is as follows.
Welcome to 4.19.90-2003.4.0.0036.oe1.aarch64
System information as of time: 	Tue Jul 21 09:21:11 CST 2020
System load: 	0.01
Processes: 	109
Memory used: 	6.7%
Swap used: 	0.0%
Usage On: 	15%
IP address: 	192.168.0.96
Users online: 	1
[root@ecs-e1b3 ~]# su - omm
Last login: Fri Jul 10 19:05:39 CST 2020 on pts/0
Welcome to 4.19.90-2003.4.0.0036.oe1.aarch64
System information as of time: 	Tue Jul 21 09:21:25 CST 2020
System load: 	0.01
Processes: 	111
Memory used: 	7.0%
Swap used: 	0.0%
Usage On: 	15%
IP address: 	192.168.0.96
Users online: 	1
[omm@ecs-e1b3 ~]$
Step 2 start the database service first, and then use the gsql client to connect to the postgres database as an administrator user, assuming that the port number is 26000.
Start the database service.
[omm@ecs-e1b3 ~]$ gs_om -t start;
Starting cluster.
=========================================
=========================================
Successfully started.
Then connect to the postgres database.
[omm@ecs-e1b3 ~]$ gsql -d postgres -p 26000 -r
gsql ((openGauss 1.1.0 build 38a9312a) compiled at 2020-05-27 14:56:08 commit 472 last mr 549 )
Non-SSL connection (SSL connection is recommended when requiring high-security)
Type "help" for help.

postgres=#
Step 3 create the student table.
postgres=# CREATE TABLE student
(       std_id INT NOT NULL,
         std_name VARCHAR(20) NOT NULL,
         std_sex VARCHAR(6),
         std_birth DATE,
         std_in DATE NOT NULL,
         std_address VARCHAR(100)
);

CREATE TABLE
Step 4 insert table data.
INSERT INTO student(std_id,std_name,std_sex,std_birth,std_in,std_address) VALUES (1,'Zhang Yi','male','1993-01-01','2011-09-01','Yuhuatai District, Nanjing City, Jiangsu Province');
INSERT INTO student(std_id,std_name,std_sex,std_birth,std_in,std_address) VALUES (2,'Zhang Er','male','1993-01-02','2011-09-01','Yuhuatai District, Nanjing City, Jiangsu Province');
INSERT INTO student(std_id,std_name,std_sex,std_birth,std_in,std_address) VALUES (3,'Zhang San','male','1993-01-03','2011-09-01','Yuhuatai District, Nanjing City, Jiangsu Province');
INSERT INTO student(std_id,std_name,std_sex,std_birth,std_in,std_address) VALUES (4,'Zhang Si','male','1993-01-04','2011-09-01','Yuhuatai District, Nanjing City, Jiangsu Province');
INSERT INTO student(std_id,std_name,std_sex,std_birth,std_in,std_address) VALUES (5,'Zhang Wu','male','1993-01-05','2011-09-01','Yuhuatai District, Nanjing City, Jiangsu Province');
INSERT INTO student(std_id,std_name,std_sex,std_birth,std_in,std_address) VALUES (6,'Zhang Liu','male','1993-01-06','2011-09-01','Yuhuatai District, Nanjing City, Jiangsu Province');
INSERT INTO student(std_id,std_name,std_sex,std_birth,std_in,std_address) VALUES (7,'Zhang Qi','male','1993-01-07','2011-09-01','Yuhuatai District, Nanjing City, Jiangsu Province');
INSERT INTO student(std_id,std_name,std_sex,std_birth,std_in,std_address) VALUES (8,'Zhang Ba','male','1993-01-08','2011-09-01','Yuhuatai District, Nanjing City, Jiangsu Province');
INSERT INTO student(std_id,std_name,std_sex,std_birth,std_in,std_address) VALUES (9,'Zhang Jiu','male','1993-01-09','2011-09-01','Yuhuatai District, Nanjing City, Jiangsu Province');
INSERT INTO student(std_id,std_name,std_sex,std_birth,std_in,std_address) VALUES (10,'Li Yi','male','1993-01-10','2011-09-01','Yuhuatai District, Nanjing City, Jiangsu Province');
INSERT INTO student(std_id,std_name,std_sex,std_birth,std_in,std_address) VALUES (11,'Li Er','male','1993-01-11','2011-09-01','Yuhuatai District, Nanjing City, Jiangsu Province');
INSERT INTO student(std_id,std_name,std_sex,std_birth,std_in,std_address) VALUES (12,'Li San','male','1993-01-12','2011-09-01','Yuhuatai District, Nanjing City, Jiangsu Province');
INSERT INTO student(std_id,std_name,std_sex,std_birth,std_in,std_address) VALUES (13,'Li Si','male','1993-01-13','2011-09-01','Yuhuatai District, Nanjing City, Jiangsu Province');
INSERT INTO student(std_id,std_name,std_sex,std_birth,std_in,std_address) VALUES (14,'Li Wu','male','1993-01-14','2011-09-01','Yuhuatai District, Nanjing City, Jiangsu Province');
INSERT INTO student(std_id,std_name,std_sex,std_birth,std_in,std_address) VALUES (15,'Li Liu','male','1993-01-15','2011-09-01','Yuhuatai District, Nanjing City, Jiangsu Province');
INSERT INTO student(std_id,std_name,std_sex,std_birth,std_in,std_address) VALUES (16,'Li Qi','male','1993-01-16','2011-09-01','Yuhuatai District, Nanjing City, Jiangsu Province');
INSERT INTO student(std_id,std_name,std_sex,std_birth,std_in,std_address) VALUES (17,'Li ba','male','1993-01-17','2011-09-01','Yuhuatai District, Nanjing City, Jiangsu Province');
INSERT INTO student(std_id,std_name,std_sex,std_birth,std_in,std_address) VALUES (18,'Li Jiu','male','1993-01-18','2011-09-01','Yuhuatai District, Nanjing City, Jiangsu Province');
INSERT INTO student(std_id,std_name,std_sex,std_birth,std_in,std_address) VALUES (19,'Wang Yi','male','1993-01-19','2011-09-01','Yuhuatai District, Nanjing City, Jiangsu Province');
INSERT INTO student(std_id,std_name,std_sex,std_birth,std_in,std_address) VALUES (20,'WangTwo ','male','1993-01-20','2011-09-01','Yuhuatai District, Nanjing City, Jiangsu Province');
INSERT INTO student(std_id,std_name,std_sex,std_birth,std_in,std_address) VALUES (21,'Wang San','male','1993-01-21','2011-09-01','Yuhuatai District, Nanjing City, Jiangsu Province');
INSERT INTO student(std_id,std_name,std_sex,std_birth,std_in,std_address) VALUES (22,'Wang Si','male','1993-01-22','2011-09-01','Yuhuatai District, Nanjing City, Jiangsu Province');
INSERT INTO student(std_id,std_name,std_sex,std_birth,std_in,std_address) VALUES (23,'Wang Wu','male','1993-01-23','2011-09-01','Yuhuatai District, Nanjing City, Jiangsu Province');
INSERT INTO student(std_id,std_name,std_sex,std_birth,std_in,std_address) VALUES (24,'Wang Liu','male','1993-01-24','2011-09-01','Yuhuatai District, Nanjing City, Jiangsu Province');
INSERT INTO student(std_id,std_name,std_sex,std_birth,std_in,std_address) VALUES (25,'Wang Qi','male','1993-01-25','2011-09-01','Yuhuatai District, Nanjing City, Jiangsu Province');
INSERT INTO student(std_id,std_name,std_sex,std_birth,std_in,std_address) VALUES (26,'bastard','male','1993-01-26','2011-09-01','Yuhuatai District, Nanjing City, Jiangsu Province');
INSERT INTO student(std_id,std_name,std_sex,std_birth,std_in,std_address) VALUES (27,'Wang Jiu','male','1993-01-27','2011-09-01','Yuhuatai District, Nanjing City, Jiangsu Province');
INSERT INTO student(std_id,std_name,std_sex,std_birth,std_in,std_address) VALUES (28,'Qian Yi','male','1993-01-28','2011-09-01','Yuhuatai District, Nanjing City, Jiangsu Province');
INSERT INTO student(std_id,std_name,std_sex,std_birth,std_in,std_address) VALUES (29,'Qian Er','male','1993-01-29','2011-09-01','Yuhuatai District, Nanjing City, Jiangsu Province');
INSERT INTO student(std_id,std_name,std_sex,std_birth,std_in,std_address) VALUES (30,'Qian San','male','1993-01-30','2011-09-01','Yuhuatai District, Nanjing City, Jiangsu Province');
INSERT INTO student(std_id,std_name,std_sex,std_birth,std_in,std_address) VALUES (31,'Qian Si','male','1993-02-01','2011-09-01','Yuhuatai District, Nanjing City, Jiangsu Province');
INSERT INTO student(std_id,std_name,std_sex,std_birth,std_in,std_address) VALUES (32,'Qian Wu','male','1993-02-02','2011-09-01','Yuhuatai District, Nanjing City, Jiangsu Province');
INSERT INTO student(std_id,std_name,std_sex,std_birth,std_in,std_address) VALUES (33,'Qian Liu','male','1993-02-03','2011-09-01','Yuhuatai District, Nanjing City, Jiangsu Province');
INSERT INTO student(std_id,std_name,std_sex,std_birth,std_in,std_address) VALUES (34,'Qian Qi','male','1993-02-04','2011-09-01','Yuhuatai District, Nanjing City, Jiangsu Province');
INSERT INTO student(std_id,std_name,std_sex,std_birth,std_in,std_address) VALUES (35,'Qian Ba','male','1993-02-05','2011-09-01','Yuhuatai District, Nanjing City, Jiangsu Province');
INSERT INTO student(std_id,std_name,std_sex,std_birth,std_in,std_address) VALUES (36,'Qian Jiu','male','1993-02-06','2011-09-01','Yuhuatai District, Nanjing City, Jiangsu Province');
INSERT INTO student(std_id,std_name,std_sex,std_birth,std_in,std_address) VALUES (37,'Wu Yi','male','1993-02-07','2011-09-01','Yuhuatai District, Nanjing City, Jiangsu Province');
INSERT INTO student(std_id,std_name,std_sex,std_birth,std_in,std_address) VALUES (38,'Wu er','male','1993-02-08','2011-09-01','Yuhuatai District, Nanjing City, Jiangsu Province');
INSERT INTO student(std_id,std_name,std_sex,std_birth,std_in,std_address) VALUES (39,'Wu San','male','1993-02-09','2011-09-01','Yuhuatai District, Nanjing City, Jiangsu Province');
INSERT INTO student(std_id,std_name,std_sex,std_birth,std_in,std_address) VALUES (40,'Wu Si','male','1993-02-10','2011-09-01','Yuhuatai District, Nanjing City, Jiangsu Province');
INSERT INTO student(std_id,std_name,std_sex,std_birth,std_in,std_address) VALUES (41,'Wu Wu','male','1993-02-11','2011-09-01','Yuhuatai District, Nanjing City, Jiangsu Province');
INSERT INTO student(std_id,std_name,std_sex,std_birth,std_in,std_address) VALUES (42,'Wu Liu','male','1993-02-12','2011-09-01','Yuhuatai District, Nanjing City, Jiangsu Province');
INSERT INTO student(std_id,std_name,std_sex,std_birth,std_in,std_address) VALUES (43,'Wu Qi','male','1993-02-13','2011-09-01','Yuhuatai District, Nanjing City, Jiangsu Province');
INSERT INTO student(std_id,std_name,std_sex,std_birth,std_in,std_address) VALUES (44,'Wu Ba','male','1993-02-14','2011-09-01','Yuhuatai District, Nanjing City, Jiangsu Province');
INSERT INTO student(std_id,std_name,std_sex,std_birth,std_in,std_address) VALUES (45,'Wu Jiu','male','1993-02-15','2011-09-01','Yuhuatai District, Nanjing City, Jiangsu Province');
INSERT INTO student(std_id,std_name,std_sex,std_birth,std_in,std_address) VALUES (46,'Liu Yi','male','1993-02-16','2011-09-01','Yuhuatai District, Nanjing City, Jiangsu Province');
INSERT INTO student(std_id,std_name,std_sex,std_birth,std_in,std_address) VALUES (47,'Liu er','male','1993-02-17','2011-09-01','Yuhuatai District, Nanjing City, Jiangsu Province');
INSERT INTO student(std_id,std_name,std_sex,std_birth,std_in,std_address) VALUES (48,'Liu San','male','1993-02-18','2011-09-01','Yuhuatai District, Nanjing City, Jiangsu Province');
INSERT INTO student(std_id,std_name,std_sex,std_birth,std_in,std_address) VALUES (49,'Liu Si','male','1993-02-19','2011-09-01','Yuhuatai District, Nanjing City, Jiangsu Province');
INSERT INTO student(std_id,std_name,std_sex,std_birth,std_in,std_address) VALUES (50,'Liu Wu','male','1993-02-20','2011-09-01','Yuhuatai District, Nanjing City, Jiangsu Province');
Step 5 data query and statistics..
postgres=# select count(*) from student;
 count
-------
    50
(1 row)

postgres=# select * from student order by std_id;
 std_id | std_name | std_sex |      std_birth      |       std_in        |     std_address
--------+----------+---------+---------------------+---------------------+----------------------
      1 | Zhang Yi     | male      | 1993-01-01 00:00:00 | 2011-09-01 00:00:00 | Yuhuatai District, Nanjing City, Jiangsu Province
      2 | Zhang Er     | male      | 1993-01-02 00:00:00 | 2011-09-01 00:00:00 | Yuhuatai District, Nanjing City, Jiangsu Province
      3 | Zhang San     | male      | 1993-01-03 00:00:00 | 2011-09-01 00:00:00 | Yuhuatai District, Nanjing City, Jiangsu Province
      4 | Zhang Si     | male      | 1993-01-04 00:00:00 | 2011-09-01 00:00:00 | Yuhuatai District, Nanjing City, Jiangsu Province
.................
Step 6 view table information.
postgres=# \d student
                  Table "public.student"
   Column    |              Type              | Modifiers
-------------+--------------------------------+-----------
 std_id      | integer                        | not null
 std_name    | character varying(20)          | not null
 std_sex     | character varying(6)           |
 std_birth   | timestamp(0) without time zone |
 std_in      | timestamp(0) without time zone | not null
 std_address | character varying(100)         |
Step 7 collect the statistics of the table.
postgres=# ANALYZE VERBOSE student;
INFO:  analyzing "public.student"(dn_6001 pid=48036)
INFO:  ANALYZE INFO : "student": scanned 1 of 1 pages, containing 50 live rows and 0 dead rows; 50 rows in sample, 50 estimated total rows(dn_6001 pid=48036)
ANALYZE
Use the ANALYZE VERBOSE statement to update the statistical information and output the relevant information of the table at the same time.
Step 8: view the execution plan of the statement.
postgres=# explain select * from student where std_id=30;
                       QUERY PLAN
--------------------------------------------------------
 Seq Scan on student  (cost=0.00..1.62 rows=1 width=62)
   Filter: (std_id = 30)
(2 rows)
Seq Scan on student indicates that full table scanning is used.
Step 9 add a primary key to the table.
postgres=# alter table student add primary key (std_id);
NOTICE:  ALTER TABLE / ADD PRIMARY KEY will create implicit index "student_pkey" for table "student"
ALTER TABLE
Step 10 review the table information again.
Determine whether the primary key is created.
postgres=# \d student
                  Table "public.student"
   Column    |              Type              | Modifiers
-------------+--------------------------------+-----------
 std_id      | integer                        | not null
 std_name    | character varying(20)          | not null
 std_sex     | character varying(6)           |
 std_birth   | timestamp(0) without time zone |
 std_in      | timestamp(0) without time zone | not null
 std_address | character varying(100)         |
Indexes:
    "student_pkey" PRIMARY KEY, btree (std_id) TABLESPACE pg_default
student_pkey is the name of the primary key.
Step 11 optimize the statement scanning mode through hint.
By adding hint to make the query statement index scan.
postgres=# explain select /*+indexscan(student student_pkey)*/ * from student where std_id=30;
                                 QUERY PLAN
----------------------------------------------------------------------
 [Bypass]
 Index Scan using student_pkey on student  (cost=0.00..8.27 rows=1 width=62)
   Index Cond: (std_id = 30)
(3 rows)

postgres=#
Index Scan using student_pkey on student indicates that the statement indexes student through the primary key on the student table_ Pkey did an index scan.
Step 12 exit the database
postgres=# \q
EXPLAIN completes the SQL optimization experiment.
In the next issue, we will continue to introduce log checking, setting the maximum number of connections, and routine maintenance of tables and indexes.