[TOC]
1. Steps to generate AWE reports
For SQL tuning, local SQL, we can use direct tuning such as execution plan, for the whole system?Oracle provides several performance analysis reports, such as AWR, ASH, ADDM and so on.
This blog focuses on AWR
AWR, fully known as Automatic Workload Repository, is a performance collection and analysis tool introduced after the 10g version of Oracle, providing report data for the entire system over a period of time.AWR reports allow you to analyze the performance of your database system over a specified period of time.
1.1 Tool Selection
You can use sqlplus or plsql developer client software for Oracle databases
sqlplus uses
You can log in using the sqlplus tool
Enter database
sqlplus / as sysdba
View Users
show parameter db_name
Use login before you can use it
plsql developer uses
plsql developer can also be used, after login, select File->New->Command Window
1.2 Automatically create snapshots
Execute after starting manometry
exec DBMS_WORKLOAD_REPOSITORY.CREATE_SNAPSHOT ();
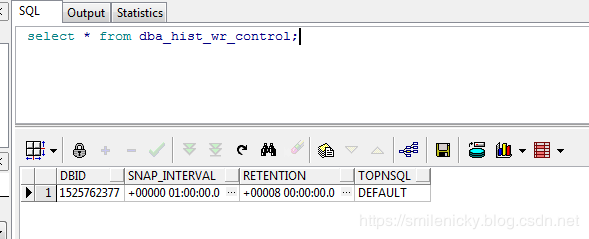
You can view the current configuration through dba_hist_wr_control, which takes a data snapshot every hour for 8 days.
select * from dba_hist_wr_control;
Modify the configuration to collect every 30 minutes for 1 day
execute dbms_workload_repository.modify_snapshot_settings(interval=>30,retention=>14000);
Turn off AWR automatic collection
SQL>exec dbms_workload_repository.modify_snapshot_settings (interval=>0,retention=>24*60);
Note: The default of 10g is to automatically turn on AWR information collection, which will have a certain impact on the system (very small); if you want to turn off AWR information collection, you only need to set the interval parameter to 0.However, when interval is set to 0, AWR reports cannot be generated.
1.3 Manual snapshot creation
In addition to creating snapshots automatically, you can also create snapshots manually
select dbms_workload_repository.create_snapshot() from dual;
1.4 Generating AWR reports
Using commands in sqlplus or plsql, ${ORACLE_HOME} is the Oracle installation path
@/${ORACLE_HOME}/.../RDBMS/ADMIN/awrrpt.sql
For example, my command is:
@D:/oracle/product/11.1.0/db_1/RDBMS/ADMIN/awrrpt.sql
Available for sqlplus login
@?/rdbms/admin/awrrpt/awrrpt.sql
@?/rdbms/admin/awrrpt; this example AWR includes:
@?/rdbms/admin/awrrpti; select instance number in RAC
@?/rdbms/admin/awrddrpt; AWR Comparison Report
@?/RDBMS/admin/awrgrpt; RAC Global AWR Report
After executing the command, you will be prompted to enter some parameters
- (1) Enter value of report_type
This means there are two formats for generating reports, html and txt. Select html here - (2) Enter value of num_days
Collect several days of report information, number, you can enter 1 - (3) Enter value of begin_snap
Enter the start snapshot id to fill in based on the range of snapshot IDS printed in the log
For example, during my experiment, the snapshot id range for log printing was 6727 ~6745
    Listing the last day's Completed Snapshots

INST_NAME    DB_NAME       SNAP_ID SNAPDAT            LV
------------ ------------ -------- ------------------ --
orcl        ORCL              6727 17 4 February 2019 00:00  1
orcl        ORCL              6728 17 4 February 2019 01:00  1
orcl        ORCL              6729 17 4 February 2019 02:00  1
orcl        ORCL              6730 17 4 February 2019 03:00  1
orcl        ORCL              6731 17 4 February 2019 04:00  1
orcl        ORCL              6732 17 4 February 2019 05:00  1
orcl        ORCL              6733 17 4 February 2019 06:00  1
orcl        ORCL              6734 17 4 February 2019 07:00  1
orcl        ORCL              6735 17 4 February 2019 08:00  1
orcl        ORCL              6736 17 4 February 2019 09:00  1
orcl        ORCL              6737 17 4 February 2019 10:00  1
orcl        ORCL              6738 17 4 February 2019 11:00  1
orcl        ORCL              6739 17 4 February 2019 12:00  1
orcl        ORCL              6740 17 4 February 2019 13:00  1
orcl        ORCL              6741 17 4 February 2019 14:00  1
orcl        ORCL              6742 17 4 February 2019 14:13  1
orcl        ORCL              6743 17 4 February 2019 14:15  1
orcl        OANET            6744 17 4 February 2019 14:16  1
orcl        OANET            6745 17 4 February 2019 14:40  1
So I fill it out at random: 6743
- (4) Enter value of end_snap
Enter the end snapshot id to fill in according to the range of snapshot IDS printed in the log, so I fill it out at random: 6745
SQL> @D:/oracle/product/11.1.0/db_1/RDBMS/ADMIN/awrrpt.sql

Current Instance
~~~~~~~~~~~~~~~~

      DBID DB_NAME      INST_ INST_NAME
---------- ------------ ----- ------------
4279242421 ORCL            1 orcl
rpt_options
---------
0

Specify the Report Type
~~~~~~~~~~~~~~~~~~~~~~~
Would you like an HTML report, or a plain text report?
Enter 'html' for an HTML report, or 'text' for plain text
Defaults to 'html'
Type Specified:  html
Cannot SET TRIMSPOOL
Cannot SET UNDERLINE


Instances in this Workload Repository schema
~~~~~~~~~~~~~~~~~~~~~~~~~~~~~~~~~~~~~~~~~~~~

DBBID        INSTT DBB_NAME     INSTT_NAME   HOST
------------ ----- ------------ ------------ ------------
* 4279242421     1 ORCL        ORCL        zwdb

Using 4279242421 for database Id
Using 1 for instance number
dbid
---------
4279242421
inst_num
---------
1
inst_num
---------
1
dbid
---------
4279242421
max_snap_time
---------
17/04/2019


Specify the number of days of snapshots to choose from
~~~~~~~~~~~~~~~~~~~~~~~~~~~~~~~~~~~~~~~~~~~~~~~~~~~~~~
Entering the number of days (n) will result in the most recent
(n) days of snapshots being listed.  Pressing <return> without
specifying a number lists all completed snapshots.


Listing the last day's Completed Snapshots

INST_NAME    DB_NAME       SNAP_ID SNAPDAT            LV
------------ ------------ -------- ------------------ --
orcl        ORCL              6727 17 4 February 2019 00:00  1
orcl        ORCL              6728 17 4 February 2019 01:00  1
orcl        ORCL              6729 17 4 February 2019 02:00  1
orcl        ORCL              6730 17 4 February 2019 03:00  1
orcl        ORCL              6731 17 4 February 2019 04:00  1
orcl        ORCL              6732 17 4 February 2019 05:00  1
orcl        ORCL              6733 17 4 February 2019 06:00  1
orcl        ORCL              6734 17 4 February 2019 07:00  1
orcl        ORCL              6735 17 4 February 2019 08:00  1
orcl        ORCL              6736 17 4 February 2019 09:00  1
orcl        ORCL              6737 17 4 February 2019 10:00  1
orcl        ORCL              6738 17 4 February 2019 11:00  1
orcl        ORCL              6739 17 4 February 2019 12:00  1
orcl        ORCL              6740 17 4 February 2019 13:00  1
orcl        ORCL              6741 17 4 February 2019 14:00  1
orcl        ORCL              6742 17 4 February 2019 14:13  1
orcl        ORCL              6743 17 4 February 2019 14:15  1
orcl        OANET            6744 17 4 February 2019 14:16  1
orcl        OANET            6745 17 4 February 2019 14:40  1
dbid
---------
4279242421
inst_num
---------
1
max_snap_time
---------
17/04/2019


Specify the Begin and End Snapshot Ids
~~~~~~~~~~~~~~~~~~~~~~~~~~~~~~~~~~~~~~
Begin Snapshot Id specified: 6743

End   Snapshot Id specified: 6745

bid
---------
6743
eid
---------
6745

inst_num
---------
1
dbid
---------
4279242421
bid
---------
6743
eid
---------
6745
Cannot SET TRIMSPOOL
Cannot SET UNDERLINE

Specify the Report Name
~~~~~~~~~~~~~~~~~~~~~~~
The default report file name is awrrpt_1_6743_6745.html.  To use this name,
press <return> to continue, otherwise enter an alternative.

Using the report name awr.html
Started spooling to D:\Program Files\PLSQL Developer 8.0.3.1510\awr.html
II. AWR Report Analysis
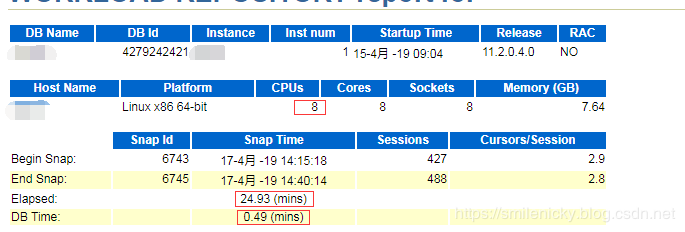
DB Time for 2.1 AWR
DB Time is mainly used to determine if there are any bottlenecks in the current system and if frequent access to the system results in long wait times?Then what do you think?Generally speaking, Elapsed time multiplied by the number of CPU s is normal if it is greater than DB Time, the system pressure is not big, otherwise it means the pressure is high. For example, in the figure, 24.93*8 is obviously greater than 0.49, so the system pressure is small.
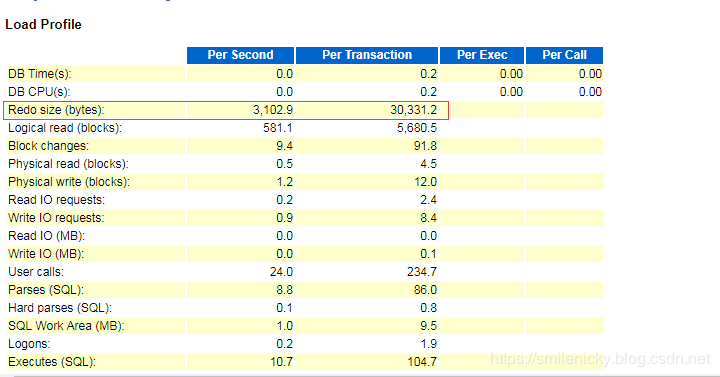
load_profile of 2.2 AWR
The load_profile metric is mainly used to show some overall parameters indicating the performance of the current system. Here are some Redo_size s used to show the average log size per second and the average log size per transaction. Sometimes you can analyze the busy level of the current transaction in conjunction with Transactions, which is the number of transactions per second.
As shown in the figure, the average number of transactions per second Transactions is very small, indicating that the system pressure is very low. Generally speaking, Transactions up to 200 are normal, or around 200 are normal, and over 1000 are very busy. Then look at the average log size per second is 4 digits, and the average log size per transaction is 5 digits, indicating that the system is not accessed frequently.Individual businesses are more complex. Conversely, the average log size per second is much larger than the average transaction log size per second, indicating that system access is frequent, while business is simple and does not require long response time.
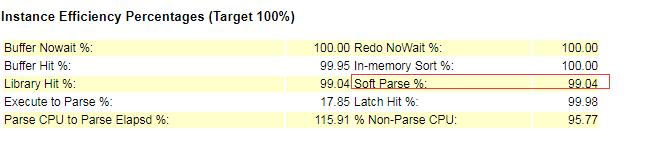
2.3 AWR efficiency percentages
efficiency percentages are some hit ratio indicators.Buffer Hint, Library Hint, etc. indicate the hit rate of SGA(System global area); Soft Parse indicates the soft resolution rate of the shared pool, if less than 90%, indicating the presence of unbound variables
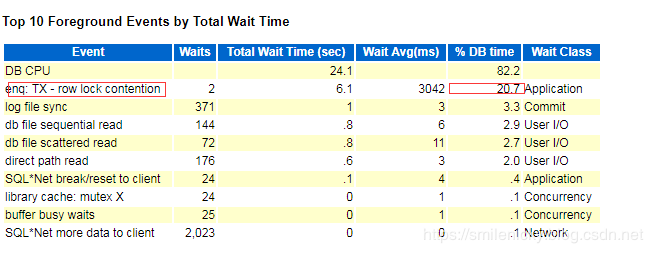
2.4 AWR top 10 events
Top 10 Foreground Events by Total Wait Time, wait events are an important indicator of database optimization. By observing the columns Event and%DB time, you can visually see the main wait events in the current database.
As you can see from the diagram, the main reasons for system interviews are that the CPU is too busy and the lock waiting
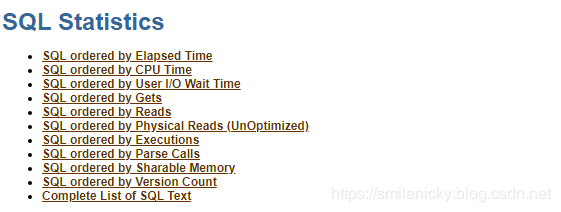
SQL Statistics for ### 2.5 AWR
SQL Statistics lists the slower execution of SQL from several dimensions. You can click on it and then tune it with SQL. Tuning SQL can be done with the execution plan.
There are many performance indicators for AWR. This blog is a note from Harvest, More than SQL Optimizations. Here are just a few of the more important indicators.