This case comes from a production failure of a two node rac of a customer. The phenomenon is that a large area of gc buffer busy acquire leads to business paralysis.
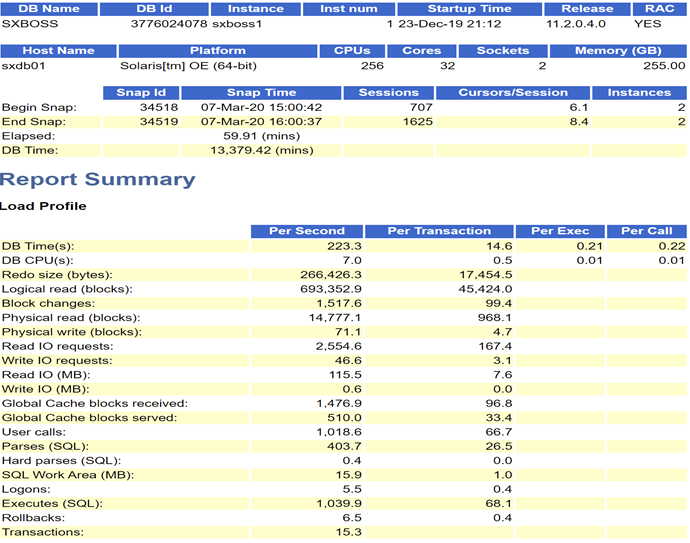
First, check the AWR header information and load profile of node 1:
1 node AWR
Key information points obtained:
For LCPU 256 system, AAS=13379.42/59.91=223, indicating that the system is very busy or has encountered abnormal waiting.
sessions grew several times abnormally, and DB CPU/DB Time accounted for a very low proportion, indicating that an abnormal wait was encountered.
Other indicators are fairly normal.
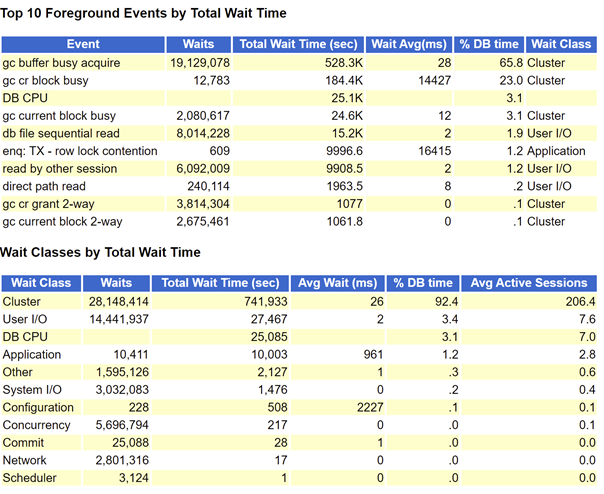
Since you are waiting for an exception, take a look at the top event section:
1 node AWR
You can see that a large number of wait class es are cluster session s and top event s also see a large number of gc buffer busy acquire wait events. This wait event is very common and will not be explained separately. According to rough calculation, cluster wait events account for about 90% of dbtime.
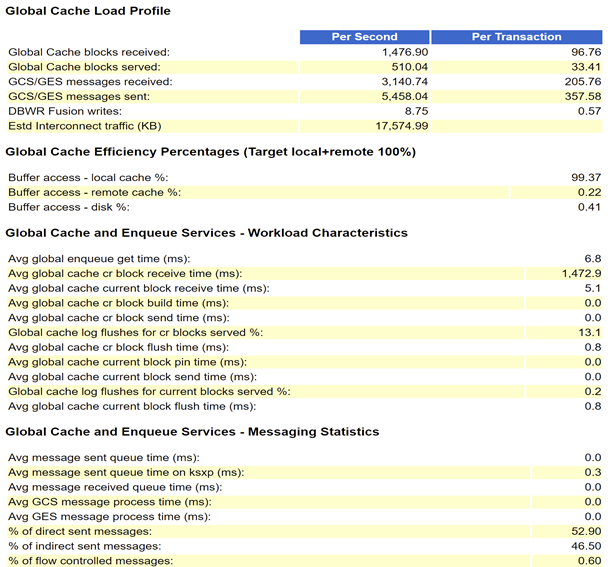
When you encounter a large number of Cluster waiting events, you must first look at RAC Statistics:
1 node AWR
It can be seen that there are not many blocks and message s transmitted per second, and the traffic is not large, so it is completely unnecessary to check the SQL ordered by Cluster Wait Time. Continue to look down and find that Avg global cache cr block receive time (ms) is too high, reaching 1473 Ms. It is judged that a large number of cluster waits this time are caused by the slow sending of Cr blocks from remote instances.
gc cr block receive time = gc cr block (flush time + build time + send time)
It can be seen from the formula that there is a problem with the gc cr block flush time /build time/send time of the remote instance, so you need to look at the RAC Statistics of the 2-node AWR at this time: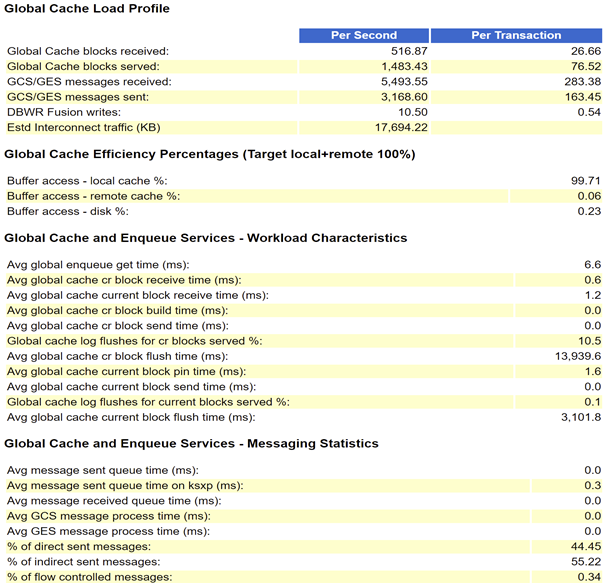
2-node AWR
You can see that Avg global cache cr block flush time (ms) is very high. There are many introductions about the behavior of current block flush redo, which will not be explained here. The behavior of cr block flush redo is usually generated when the cr block needs to be constructed from the current block of the remote instance.
Normally CR block buffer processing does not include the 'gc cr block flush time'. However, when a CR buffer is cloned from a current buffer that has redo pending, a log flush for a CR block transfer is required. A high percentage is indicative of hot blocks with frequent read after write access.
For current/cr flush time, there are usually two possibilities:
LGWR has poor write performance;
LGWR blocked.
So the next step is to directly look at the Background Wait Events and Wait Event Histogram of 2-node AWR to see how the write performance of LGWR is and whether it is stable.

2-node AWR

2-node AWR
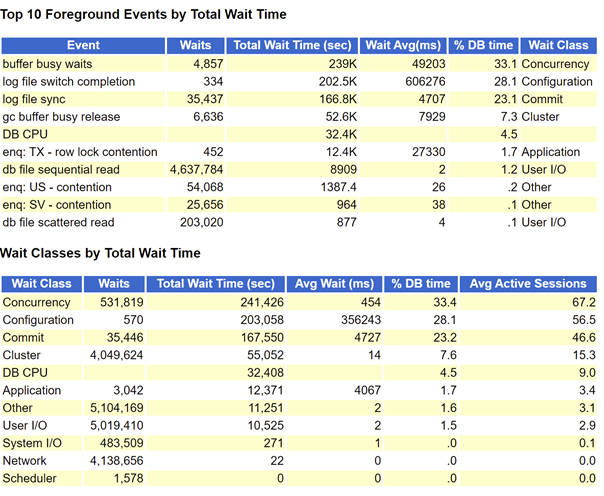
It can be seen that the write performance of 2-node LGWR is very stable and the delay is normal. Then it is not the problem of LGWR write performance. It is likely that LGWR is blocked.
2-node AWR
Through the top event, we can see that node 2 has a lot of waiting for log switching to complete, indicating that LGWR is indeed blocked. At this time, it is time to analyze ash. You can directly filter other information to view the ash information of LGWR separately.
SQL> select to_char(sample_time,'yyyy-mm-dd hh24:mi:ss'),program,session_id,event,seq#,BLOCKING_SESSION,BLOCKING_INST_ID from m_ash where program like '%LGWR%' and inst_id=2 order by 1;
TO_CHAR(SAMPLE_TIME PROGRAM                        SESSION_ID EVENT                                SEQ# BLOCKING_SESSION BLOCKING_INST_ID
------------------- ------------------------------ ---------- ------------------------------ ---------- ---------------- ----------------
...
2020-03-07 15:44:40 oracle@sxdb02 (LGWR)                  913 enq: CF - contention                 3850             2224                1
2020-03-07 15:44:41 oracle@sxdb02 (LGWR)                  913 enq: CF - contention                 3850             2224                1
2020-03-07 15:44:42 oracle@sxdb02 (LGWR)                  913 enq: CF - contention                 3850             2224                1
2020-03-07 15:44:43 oracle@sxdb02 (LGWR)                  913 enq: CF - contention                 3850             2224                1
2020-03-07 15:44:44 oracle@sxdb02 (LGWR)                  913 enq: CF - contention                 3850             2224                1
2020-03-07 15:44:45 oracle@sxdb02 (LGWR)                  913 enq: CF - contention                 3850             2224                1
2020-03-07 15:44:46 oracle@sxdb02 (LGWR)                  913 enq: CF - contention                 3850             2224                1
2020-03-07 15:44:47 oracle@sxdb02 (LGWR)                  913 enq: CF - contention                 3850             2224                1
2020-03-07 15:44:48 oracle@sxdb02 (LGWR)                  913 enq: CF - contention                 3850             2224                1
2020-03-07 15:44:49 oracle@sxdb02 (LGWR)                  913 enq: CF - contention                 3850             2224                1
2020-03-07 15:44:50 oracle@sxdb02 (LGWR)                  913 enq: CF - contention                 3850             2224                1
2020-03-07 15:44:51 oracle@sxdb02 (LGWR)                  913 enq: CF - contention                 3850             2224                1
2020-03-07 15:44:52 oracle@sxdb02 (LGWR)                  913 enq: CF - contention                 3850             2224                1
2020-03-07 15:44:53 oracle@sxdb02 (LGWR)                  913 enq: CF - contention                 3850             2224                1
2020-03-07 15:44:54 oracle@sxdb02 (LGWR)                  913 enq: CF - contention                 3850             2224                1
2020-03-07 15:44:55 oracle@sxdb02 (LGWR)                  913 enq: CF - contention                 3850             2224                1
2020-03-07 15:44:56 oracle@sxdb02 (LGWR)                  913 enq: CF - contention                 3850             2224                1
2020-03-07 15:44:57 oracle@sxdb02 (LGWR)                  913 enq: CF - contention                 3850             2224                1
2020-03-07 15:44:58 oracle@sxdb02 (LGWR)                  913 enq: CF - contention                 3850             2224                1
...
It can be seen that from 15:44:40, LGWR began to wait for the CF queue and lasted for a very long time. The blocking session is the session with sid 2224 of node 1. Combined with the previous analysis of AWR, it is speculated that the log switching was carried out at 15:44:40, because the log switching needs to read the control file. Now let's take a look at the information of blocking session.
SQL> select to_char(sample_time,'yyyy-mm-dd hh24:mi:ss'),program,session_id,event,seq#,BLOCKING_SESSION,BLOCKING_INST_ID from m_ash where session_id=2224 and inst_id=1 order by 1;
TO_CHAR(SAMPLE_TIME PROGRAM                   SESSION_ID EVENT                                SEQ# BLOCKING_SESSION BLOCKING_INST_ID
------------------- ------------------------- ---------- ------------------------------ ---------- ---------------- ----------------
...
2020-03-07 15:37:41 oracle@sxdb01 (M000)            2224 control file sequential read          479
2020-03-07 15:37:42 oracle@sxdb01 (M000)            2224                                       566
2020-03-07 15:37:43 oracle@sxdb01 (M000)            2224 control file sequential read          632
2020-03-07 15:37:44 oracle@sxdb01 (M000)            2224 control file sequential read          684
2020-03-07 15:37:45 oracle@sxdb01 (M000)            2224                                       736
2020-03-07 15:37:46 oracle@sxdb01 (M000)            2224                                       781
2020-03-07 15:37:47 oracle@sxdb01 (M000)            2224                                       824
2020-03-07 15:37:48 oracle@sxdb01 (M000)            2224                                       865
2020-03-07 15:37:49 oracle@sxdb01 (M000)            2224                                       915
2020-03-07 15:37:50 oracle@sxdb01 (M000)            2224                                      1031
2020-03-07 15:37:51 oracle@sxdb01 (M000)            2224                                      1183
2020-03-07 15:37:52 oracle@sxdb01 (M000)            2224 control file sequential read         1304
2020-03-07 15:37:53 oracle@sxdb01 (M000)            2224                                      1400
2020-03-07 15:37:54 oracle@sxdb01 (M000)            2224                                      1481
2020-03-07 15:37:55 oracle@sxdb01 (M000)            2224 control file sequential read         1631
2020-03-07 15:37:56 oracle@sxdb01 (M000)            2224 control file sequential read         1834
2020-03-07 15:37:57 oracle@sxdb01 (M000)            2224 control file sequential read         1947
2020-03-07 15:37:58 oracle@sxdb01 (M000)            2224 control file sequential read         2052
2020-03-07 15:37:59 oracle@sxdb01 (M000)            2224 control file sequential read         2159
2020-03-07 15:38:00 oracle@sxdb01 (M000)            2224 control file sequential read         2269
2020-03-07 15:38:01 oracle@sxdb01 (M000)            2224 control file sequential read         2404
2020-03-07 15:38:02 oracle@sxdb01 (M000)            2224 control file sequential read         2517
2020-03-07 15:38:03 oracle@sxdb01 (M000)            2224 control file sequential read         2672
2020-03-07 15:38:04 oracle@sxdb01 (M000)            2224                                      2801
2020-03-07 15:38:05 oracle@sxdb01 (M000)            2224                                      2857
2020-03-07 15:38:06 oracle@sxdb01 (M000)            2224                                      2866
2020-03-07 15:38:07 oracle@sxdb01 (M000)            2224 control file sequential read         2893
2020-03-07 15:38:08 oracle@sxdb01 (M000)            2224                                      3007
2020-03-07 15:38:09 oracle@sxdb01 (M000)            2224 control file sequential read         3111
2020-03-07 15:38:10 oracle@sxdb01 (M000)            2224                                      3184
2020-03-07 15:38:11 oracle@sxdb01 (M000)            2224 control file sequential read         3218
2020-03-07 15:38:12 oracle@sxdb01 (M000)            2224 control file sequential read         3263
2020-03-07 15:38:13 oracle@sxdb01 (M000)            2224                                      3304
..
Here we can see that the blocking process of M000 of node 1 has held the CF lock since 15:37 and has been reading the control file for a very long time. As a result, the LGWR of node 2 cannot hold the CF lock when the log of node 2 is switched. M000 is the slave process of MMON process. We know that MMON process is usually related to AWR. Why do we keep reading control files?
Check the short of M000 in the systemstate dump generated by diag_ Stack information:
Short stack dump: ksedsts()+380<-ksdxfstk()+52<-ksdxcb()+3592<-sspuser()+140<-__sighndlr()+12<-call_user_handler()+868<-sigacthandler()+92<-__pread()+12<-pread()+112<-skgfqio()+532<-ksfd_skgfqio()+756<-ksfd_io()+676<-ksfdread()+640<-kfk_ufs_sync_io()+416<-kfk_submit_io()+260<-kfk_io1()+916<-kfk_transitIO()+2512<-kfioSubmitIO()+408<-kfioRequestPriv()+220<-kfioRequest()+472<-ksfd_kfioRequest()+444<-ksfd_osmio()+2956<-ksfd_io()+1868<-ksfdread()+640<-kccrbp()+496<-kccrec_rbl()+296<-kccrec_read_write()+1680<-kccrrc()+1072<-krbm_cleanup_map()+28<-kgghstmap()+92<-krbm_cleanup_backup_records()+1100<-kraalac_slave_action()+1016<-kebm_slave_main()+744<-ksvrdp()+1928<-opirip()+1972<-opidrv()+748<-sou2o()+88<-opimai_real()+512<-ssthrdmain()+324<-main()+316<-_start()+380
kraalac_slave_action ->krbm_cleanup_backup_records-> krbm_cleanup_map -> kccrrc
Here you can see the control file that M000 was cleaning up the backup records to read. From the action name of M000 in M000 trace or ash, you can see that the action of M000 was Monitor FRA Space at that time. It shows that MMON initiated a slave to do Monitor FRA Space, and the FRA space is insufficient, so it triggered to clean up some backup records in FRA to read the control file.
Knowing why M000 reads the control file, the next question is why it takes so long to read it? Control file too large? Control file read too slow? Or did you find the answer from systemstate dump:
 SO: 0x22e13908e0, type: 10, owner: 0x23012ace68, flag: INIT/-/-/0x00 if: 0x1 c: 0x1
     proc=0x23012ace68, name=FileOpenBlock, file=ksfd.h LINE:6688 ID:, pg=0
    (FOB) 22e13908e0 flags=2560 fib=22fde0d288 incno=0 pending i/o cnt=0
     fname=+FASTDG/sxboss/controlfile/current.256.907844431
     fno=1 lblksz=16384 fsiz=118532
The control file size is lblksz fsiz=16384118532=1.8g. Why is the control file so large?

Because control_file_record_keep_time is set to 365 days.
Solution:
1. Reasonably set the control according to the backup strategy_ file_ record_ keep_ time;
2. Rebuild control documents.
The harvest of this case is that we don't know much about the role of MMON process at ordinary times. Tracking MMON through KST trace, we found that MMON plays a lot of roles, not only related to AWR. The action s of MMON tracked by KST trace are as follows:
(MMON) : (infrequent action) : acnum=[133] comment=[deferred controlfile autobackup action]
(MMON) : (infrequent action) : acnum=[150] comment=[recovery area alert action]
(MMON) : (infrequent action) : acnum=[167] comment=[undo usage]
(MMON) : (infrequent action) : acnum=[171] comment=[Block Cleanout Optim, Undo Segment Scan]
(MMON) : (infrequent action) : acnum=[175] comment=[Flashback Archive RAC Health Check]
(MMON) : (infrequent action) : acnum=[178] comment=[tune undo retention lob]
(MMON) : (infrequent action) : acnum=[179] comment=[MMON Periodic LOB MQL Selector]
(MMON) : (infrequent action) : acnum=[180] comment=[MMON Periodic LOB Spc Analyze ]
(MMON) : (infrequent action) : acnum=[183] comment=[tablespace alert monitor]
(MMON) : (infrequent action) : acnum=[197] comment=[OLS Cleanup]
(MMON) : (infrequent action) : acnum=[205] comment=[Sample Shared Server Activity]
(MMON) : (infrequent action) : acnum=[212] comment=[Compute cache stats in background]
(MMON) : (infrequent action) : acnum=[213] comment=[SPM: Auto-purge expired SQL plan baselines]
(MMON) : (infrequent action) : acnum=[214] comment=[SPM: Check SMB size]
(MMON) : (infrequent action) : acnum=[215] comment=[SPM: Delete excess sqllog$ batches]
(MMON) : (infrequent action) : acnum=[219] comment=[KSXM Advance DML Frequencies]
(MMON) : (infrequent action) : acnum=[220] comment=[KSXM Broadcast DML Frequencies]
(MMON) : (infrequent action) : acnum=[225] comment=[Cleanup client cache server state in background]
(MMON) : (infrequent action) : acnum=[226] comment=[MMON TSM Cleanup]
(MMON) : (infrequent action) : acnum=[296] comment=[alert message cleanup]
(MMON) : (infrequent action) : acnum=[297] comment=[alert message purge]
(MMON) : (infrequent action) : acnum=[298] comment=[AWR Auto Flush Task]
(MMON) : (infrequent action) : acnum=[299] comment=[AWR Auto Purge Task]
(MMON) : (infrequent action) : acnum=[300] comment=[AWR Auto DBFUS Task]
(MMON) : (infrequent action) : acnum=[301] comment=[AWR Auto CPU USAGE Task]
(MMON) : (infrequent action) : acnum=[305] comment=[Advisor delete expired tasks]
(MMON) : (infrequent action) : acnum=[313] comment=[run-once action driver]
(MMON) : (infrequent action) : acnum=[319] comment=[metrics monitoring]
(MMON) : (infrequent action) : acnum=[322] comment=[sql tuning hard kill defense]
(MMON) : (infrequent action) : acnum=[323] comment=[autotask status check]
(MMON) : (infrequent action) : acnum=[324] comment=[Maintain AWR Baseline Thresholds Task]
(MMON) : (infrequent action) : acnum=[325] comment=[WCR: Record Action Switcher]
(MMON) : (infrequent action) : acnum=[331] comment=[WCR: Replay Action Switcher]
(MMON) : (infrequent action) : acnum=[338] comment=[SQL Monitoring Garbage Collector]
(MMON) : (infrequent action) : acnum=[344] comment=[Coordinator autostart timeout]
(MMON) : (infrequent action) : acnum=[348] comment=[ADR Auto Purge Task]
(MMON) : (infrequent action) : acnum=[41] comment=[reload failed KSPD callbacks]
(MMON) : (infrequent action) : acnum=[75] comment=[flashcache object keep monitor]
(MMON) : (interrupt action) : acnum=[108] comment=[Scumnt mount lock]
(MMON) : (interrupt action) : acnum=[109] comment=[Poll system events broadcast channel]
(MMON) : (interrupt action) : acnum=[20] comment=[KSB action for ksbxic() calls]
(MMON) : (interrupt action) : acnum=[2] comment=[KSB action for X-instance calls]
(MMON) : (interrupt action) : acnum=[306] comment=[MMON Remote action Listener]
(MMON) : (interrupt action) : acnum=[307] comment=[MMON Local action Listener]
(MMON) : (interrupt action) : acnum=[308] comment=[MMON Completion Callback Dispatcher]
(MMON) : (interrupt action) : acnum=[309] comment=[MMON set edition interrupt action]
(MMON) : (interrupt action) : acnum=[341] comment=[Check for sync messages from other instances]
(MMON) : (interrupt action) : acnum=[343] comment=[Check for autostart messages from other instances]
(MMON) : (interrupt action) : acnum=[350] comment=[Process staged incidents]
(MMON) : (interrupt action) : acnum=[351] comment=[DDE MMON action to schedule async action slaves]
(MMON) : (interrupt action) : acnum=[39] comment=[MMON request for RLB metrics]
(MMON) : (requested action) : acnum=[314] comment=[shutdown MMON]
(MMON) : (requested action) : acnum=[315] comment=[MMON DB open]
(MMON) : (requested action) : acnum=[321] comment=[ADDM (KEH)]
(MMON) : (requested action) : acnum=[347] comment=[Job Autostart action force]
(MMON) : (requested action) : acnum=[349] comment=[Schedule slave to update incident meter]
(MMON) : (requested action) : acnum=[63] comment=[SGA memory tuning parameter update]
(MMON) : (timeout action) : acnum=[0] comment=[Monitor Cleanup]
(MMON) : (timeout action) : acnum=[11] comment=[Update shared pool advice stats]
(MMON) : (timeout action) : acnum=[154] comment=[Flashback Marker]
(MMON) : (timeout action) : acnum=[172] comment=[Block Cleanout Optim, Rac specific code]
(MMON) : (timeout action) : acnum=[173] comment=[BCO:]
(MMON) : (timeout action) : acnum=[1] comment=[Update KGSTM Translation]
(MMON) : (timeout action) : acnum=[3] comment=[KSB action for bast checking]
(MMON) : (timeout action) : acnum=[42] comment=[reconfiguration MMON action]
(MMON) : (timeout action) : acnum=[63] comment=[SGA memory tuning parameter update]
(MMON) : (timeout action) : acnum=[69] comment=[SGA memory tuning]
. . .
There are about hundreds of action s, and usually too little attention is paid to MMON.
Original link of ink Sky Wheel: https://www.modb.pro/db/17494... (copy link to browser)
Author about
Li Xiangyu, delivery technical consultant of Yunhe enmo West District, has long served customers in the mobile operator industry, and is familiar with Oracle Performance Optimization, fault diagnosis and special recovery.