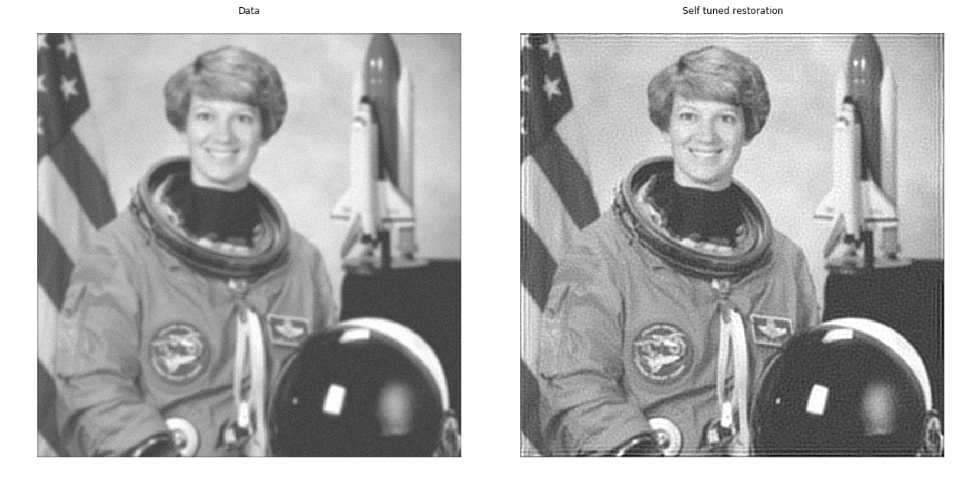
Wiener filter
Inverse filter based on PSF (Point Spread Function), previous regularization (high frequency penalty) and trade-off between data and previous adequacy. Regularization parameters must be adjusted manually.
In this example, we use Wiener and unsupervised Wiener algorithm to deconvolute the noise version of the image. The algorithm is based on linear model and can not restore sharp edges as the non-linear method (such as TV restoration), but it is much faster.
import numpy as np
import matplotlib.pyplot as plt
%matplotlib inline
from skimage import color, data, restoration

astro = color.rgb2gray(data.astronaut())
from scipy.signal import convolve2d as conv2
psf = np.ones((5, 5)) / 25
astro = conv2(astro, psf, 'same')
astro += 0.1 * astro.std() * np.random.standard_normal(astro.shape)

deconvolved, _ = restoration.unsupervised_wiener(astro, psf)

fig, ax = plt.subplots(nrows=1, ncols=2, figsize=(8, 5),
                       sharex=True, sharey=True)

plt.gray()

ax[0].imshow(astro, vmin=deconvolved.min(), vmax=deconvolved.max())
ax[0].axis('off')
ax[0].set_title('Data')

ax[1].imshow(deconvolved)
ax[1].axis('off')
ax[1].set_title('Self tuned restoration')

fig.tight_layout()

plt.show()
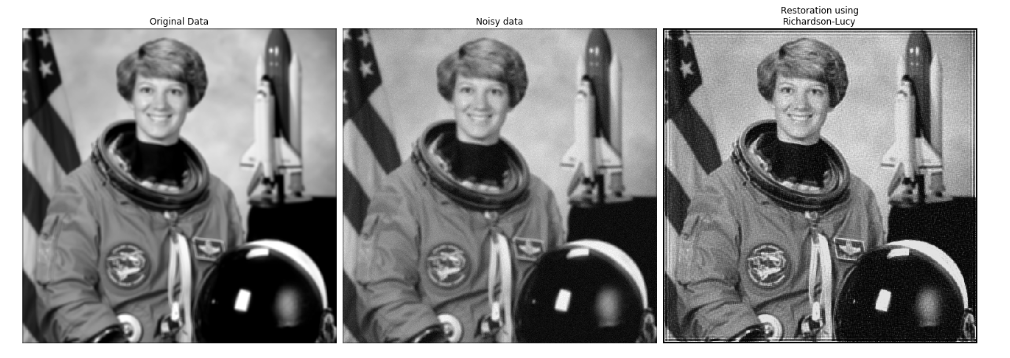
Lucy-Richardson algorithm
Wiener filtering is an image restoration algorithm in frequency domain, while LR algorithm is an image restoration algorithm in time domain. The algorithm is based on PSF (Point Spread Function), which is described as the impulse response of optical system. The blurred image needs to be sharpened manually through multiple iterations.
import numpy as np
import matplotlib.pyplot as plt

from scipy.signal import convolve2d as conv2

from skimage import color, data, restoration

astro = color.rgb2gray(data.astronaut())

psf = np.ones((5, 5)) / 25
astro = conv2(astro, psf, 'same')
# Add Noise to Image
astro_noisy = astro.copy()
astro_noisy += (np.random.poisson(lam=25, size=astro.shape) - 10) / 255.

# Restore Image using Richardson-Lucy algorithm
deconvolved_RL = restoration.richardson_lucy(astro_noisy, psf, iterations=30)

fig, ax = plt.subplots(nrows=1, ncols=3, figsize=(18, 9))
plt.gray()

for a in (ax[0], ax[1], ax[2]):
       a.axis('off')

ax[0].imshow(astro)
ax[0].set_title('Original Data')

ax[1].imshow(astro_noisy)
ax[1].set_title('Noisy data')

ax[2].imshow(deconvolved_RL, vmin=astro_noisy.min(), vmax=astro_noisy.max())
ax[2].set_title('Restoration using\nRichardson-Lucy')


fig.subplots_adjust(wspace=0.02, hspace=0.2,
                    top=0.9, bottom=0.05, left=0, right=1)
plt.show()